Sample Category Title
SNB cuts 25bps, slashes inflation forecasts
SNB lowered its policy rate by 25 basis points to 1.00%, citing that inflationary pressure "has again decreased significantly", largely driven by the recent appreciation of Swiss Franc. SNB’s statement also indicated that further rate cuts "may become necessary" in the coming quarters to maintain price stability in the medium term.
The revised inflation forecast shows significant downward adjustment compared to June, reflecting factors such as the stronger Swiss franc, lower oil prices, and upcoming electricity price cuts scheduled for January 2025.
The new conditional forecast sees inflation averaging 1.2% in 2024, 0.6% in 2025, and 0.7% in 2026, down from previous estimates of 1.3%, 1.1%, and 1.0%, respectively.
The SNB’s forecast is based on maintaining the policy rate at 1.0% throughout the projection period. The central bank also noted that without today's rate cut, inflation forecasts would have been even lower.
On the economic growth front, SNB expects "rather modest" performance in the coming quarters due to the recent strengthening of Swiss franc and slower global economic development. It forecasts GDP growth of around 1% for 2024 and 1.5% for 2025.
(SNB) Swiss National Bank eases monetary policy and lowers SNB policy rate to 1.0%
The Swiss National Bank is lowering the SNB policy rate by 0.25 percentage points to 1.0%. The change applies from tomorrow, 27 September 2024. Banks’ sight deposits held at the SNB will be remunerated at the SNB policy rate up to a certain threshold, and at 0.5% above this threshold. The SNB also remains willing to be active in the foreign exchange market as necessary.
Inflationary pressure in Switzerland has again decreased significantly compared to the previous quarter. Among other things, this decrease reflects the appreciation of the Swiss franc over the last three months. The SNB’s easing of monetary policy today takes the reduction in inflationary pressure into account. Further cuts in the SNB policy rate may become necessary in the coming quarters to ensure price stability over the medium term.
Inflation in the period since the last monetary policy assessment was lower than expected, standing at 1.1% in August compared to 1.4% in May. Imported goods and services in particular contributed to the decline. Overall, inflation in Switzerland is currently being driven mainly by higher prices for domestic services.
The new conditional inflation forecast is significantly lower than that of June. The stronger Swiss franc, the lower oil price and electricity price cuts announced for next January have contributed to the downward revision. The stronger decline in inflation also means that weaker second-round effects are expected in the medium term. The new forecast is within the range of price stability over the entire forecast horizon (cf. chart). It puts average annual inflation at 1.2% for 2024, 0.6% for 2025 and 0.7% for 2026 (cf. table). The forecast is based on the assumption that the SNB policy rate is 1.0% over the entire forecast horizon. Without today’s rate cut, the conditional inflation forecast would have been even lower.
Global economic growth was moderate in the second quarter of 2024. Inflation in many countries remains above central banks’ targets. However, it has continued to decline in recent months. Various central banks have cut their policy rates as a result.
Inflationary pressure abroad is likely to continue to ease gradually over the next quarters. At the same time, the moderate pace of global growth should continue.
This scenario for the global economy is still subject to significant risks. For example, geopolitical tensions could increase, resulting in weaker development of global economic activity. Equally, it cannot be ruled out that inflation will remain elevated for longer in some countries.
Swiss GDP growth was solid in the second quarter of 2024. Growth momentum in the chemicals/pharmaceuticals industry was particularly strong, while growth in many other industries was moderate. There was a further slight increase in unemployment. The utilisation of overall production capacity was normal.
Growth is likely to remain rather modest in Switzerland in the coming quarters due to the recent appreciation of the Swiss franc and the moderate development of the global economy. The SNB anticipates GDP growth of around 1% this year. In this environment, unemployment should continue to rise slightly, while the utilisation of production capacity is likely to decline slightly. Over the medium term, the growth-dampening effect of the recent appreciation should subside and economic development should gradually improve as a result. The SNB currently expects growth of around 1.5% for 2025.
The forecast for Switzerland, as for the global economy, is subject to significant uncertainty. Developments abroad represent the main risk.
Momentum on the mortgage and real estate markets in recent quarters has been weaker than in previous years. While the vulnerabilities in these markets have receded slightly, they still exist.
More detailed information on the monetary policy decision can be found in the introductory remarks of the Governing Board.
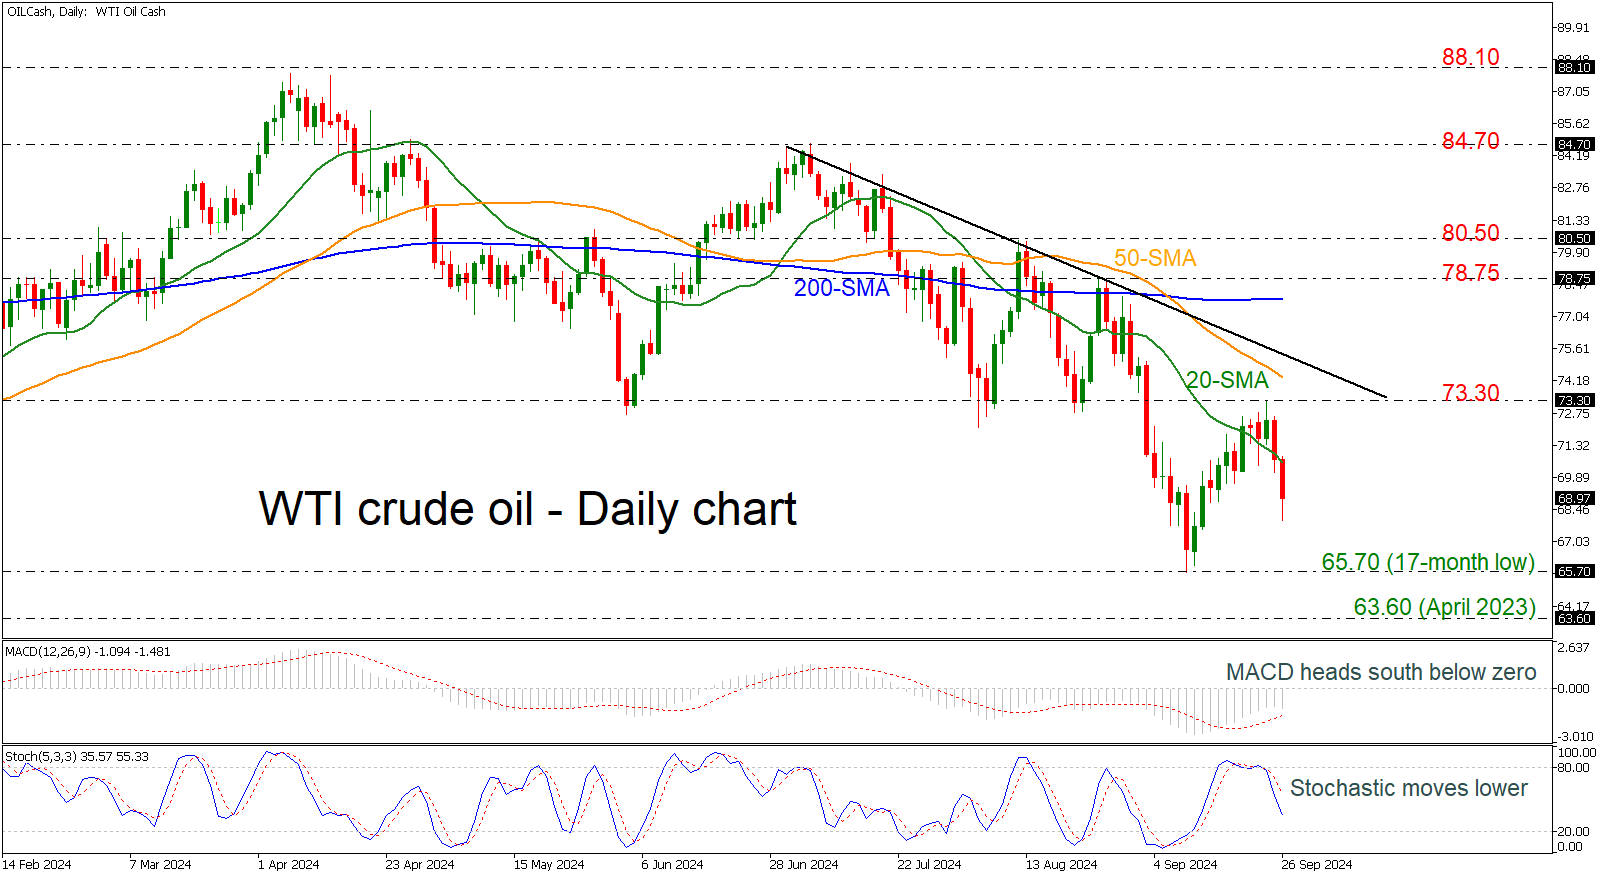
WTI Crude Oil Plunges in Descending Tendency
- WTI dives 7% from 73.30
- 200-day SMA moves horizontally
- MACD and stochastics confirm bearish outlook
WTI crude oil prices have lost more than 7% over the last couple of days after the pullback from the 73.30 resistance level. The commodity is also declining beneath the 20-day simple moving average (SMA) with the next support coming from the 17-month low of 65.70. Below that, the trough of April 2023 at 63.60 could be the next target.
On the flip side, a recoup of the latest losses could drive the market up to the 73.30 barrier ahead of the 50-day SMA at 74.30. A break above the short-term falling trend line could send the commodity towards the flat 200-day SMA at 77.75, switching the bias to neutral.
According to technical oscillators, the MACD is extending its negative momentum below the zero level, while the stochastic is diving from the 80 level.
In brief, oil prices have been creating a bearish tendency since the beginning of July and only a jump above the 84.70 resistance may change the current outlook to bullish.
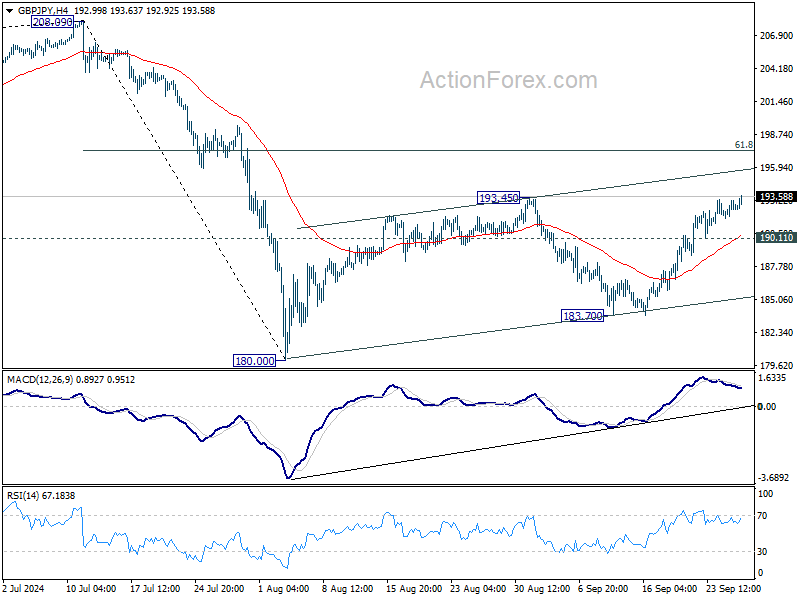
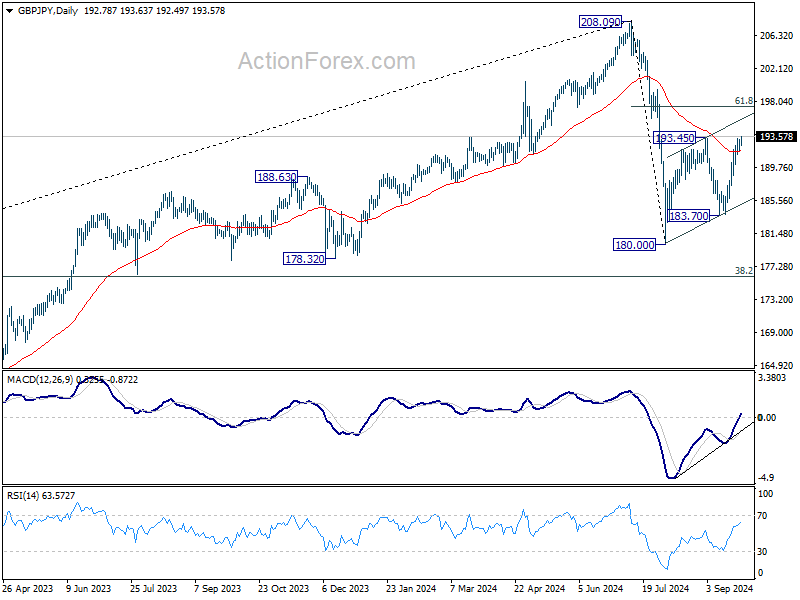
GBP/JPY Daily Outlook
Daily Pivots: (S1) 192.00; (P) 192.64; (R1) 193.49; More...
GBP/JPY's rise from 183.70, as the third leg of the corrective pattern from 180.00, is in progress and breached 193.45 resistance. Intraday bias stays on the upside for 61.8% retracement of 208.09 to 180.00 at 197.35 next. On the downside, below 190.11 minor support will turn intraday bias neutral first.
In the bigger picture, price actions from 208.09 are seen as a correction to whole rally from 123.94 (2020 low). The range of consolidation should be set between 38.2% retracement of 123.94 to 208.09 at 175.94 and 208.09. However, decisive break of 175.94 will argue that deeper correction is underway.
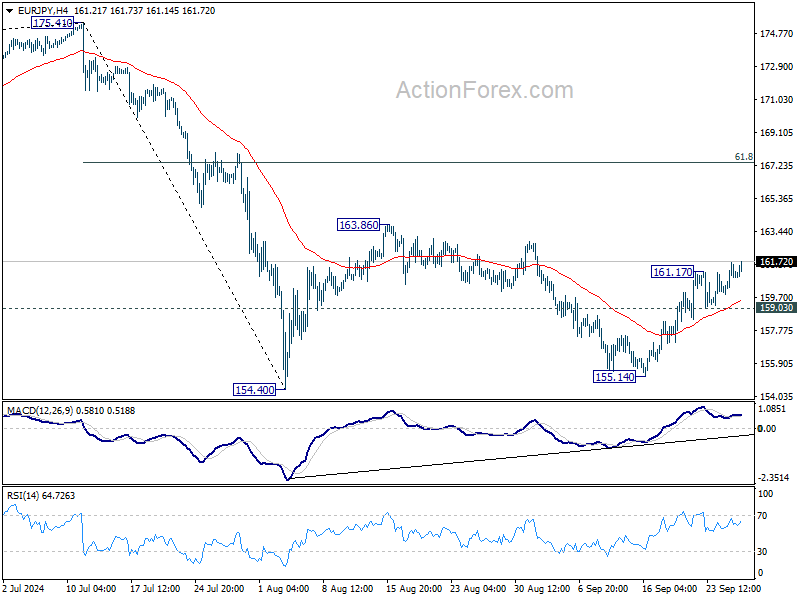
EUR/JPY Daily Outlook
Daily Pivots: (S1) 160.12; (P) 160.89; (R1) 161.93; More....
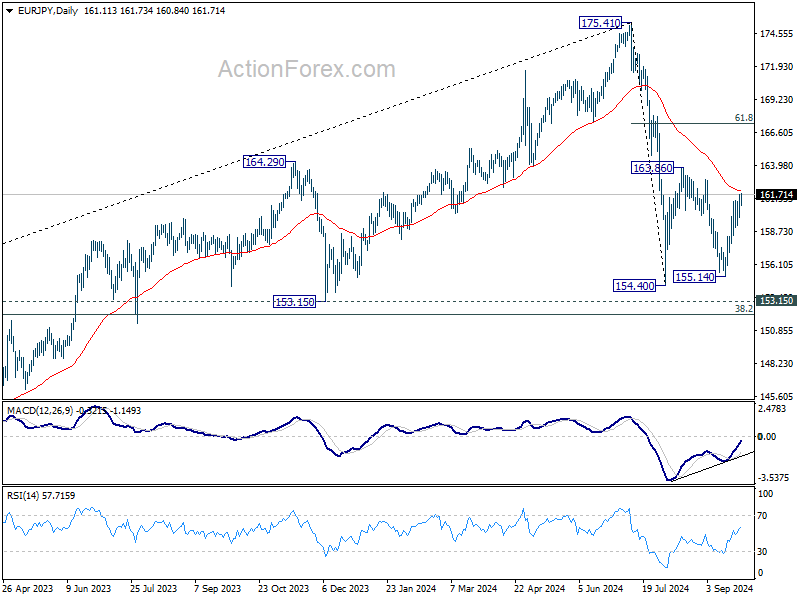
EUR/JPY's rally resumed after brief consolidations and intraday bias is back on the upside. Rise from 155.14, as the third leg of the corrective pattern from 154.40, should target 163.86 resistance. Break there will target 61.8% retracement of 175.41 to 154.40 at 167.38. On the downside, below 159.03 minor support will turn intraday bias neutral again.
In the bigger picture, price actions from 175.41 are seen as correction to rally from 114.42 (2020 low). The range of consolidation should have been set between 38.2% retracement of 114.42 to 175.41 at 152.11 and 175.41 high. However, decisive break of 152.11 would argue that deeper correction is underway.
EUR/GBP Daily Outlook
Daily Pivots: (S1) 0.8335; (P) 0.8354; (R1) 0.8374; More...
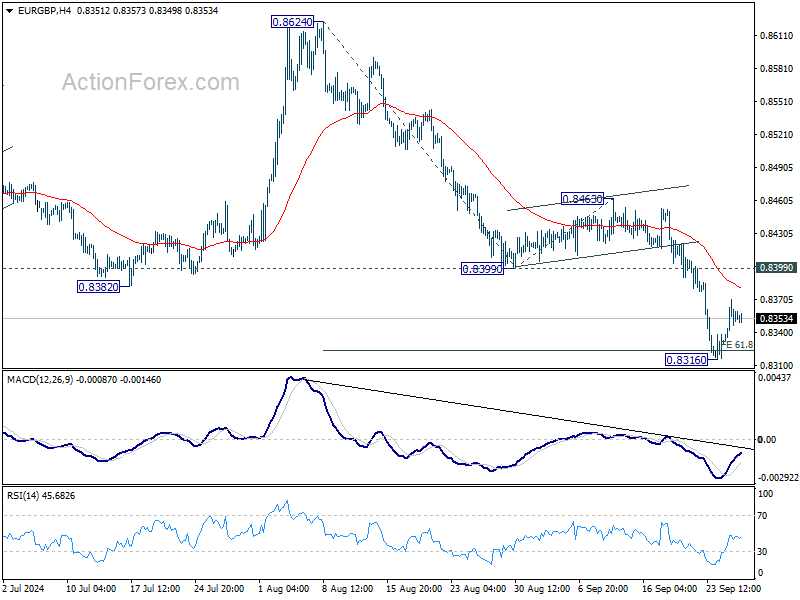
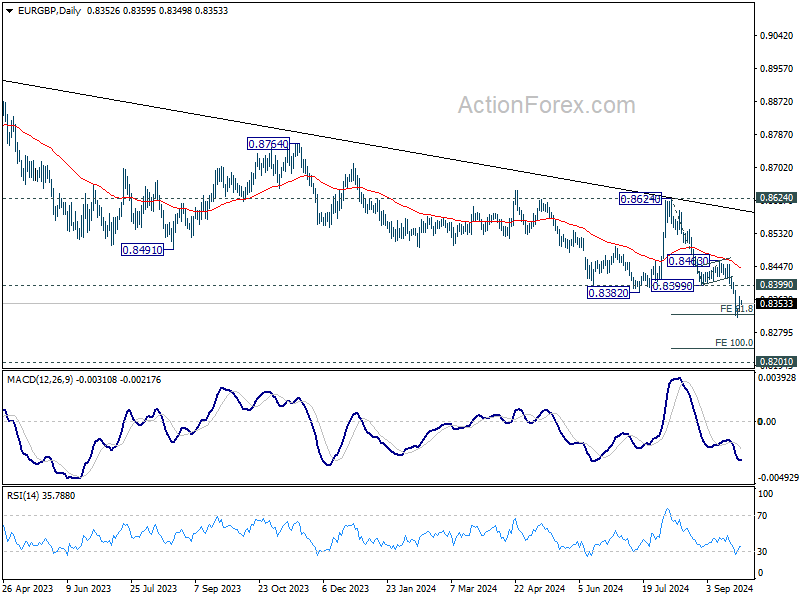
Intraday bias in EUR/GBP remains neutral for consolidation above 0.8316 temporary low. Outlook will remain bearish as long as 0.8399 support turned resistance holds. On the downside, below 0.8316 will resume the fall from 0.8624 to 100% projection of 0.8624 to 0.8399 from 0.8463 at 0.8237 next.
In the bigger picture, down trend from 0.9267 (2022 high) is resuming. Next target is 0.8201 (2022 low), but strong support should be seen there to bring rebound. Outlook will remain bearish as long as 0.8624 resistance holds even in case of strong rebound.
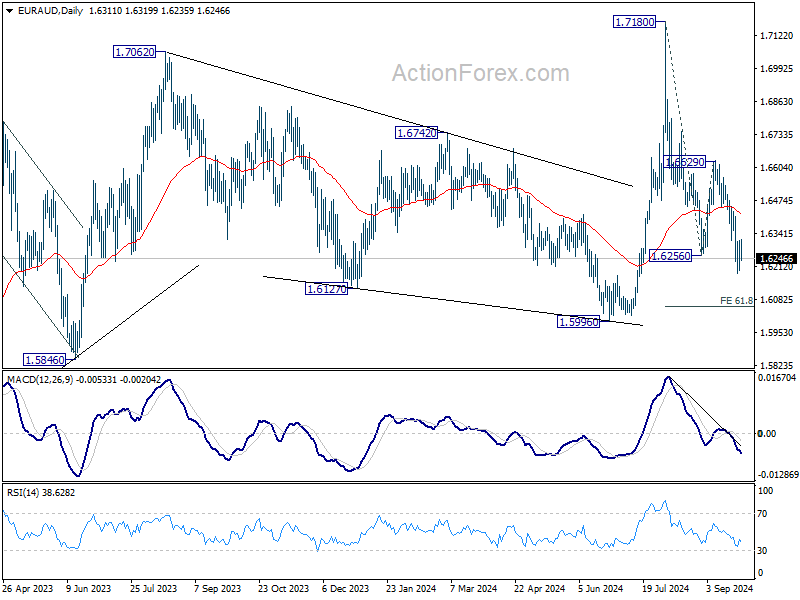
EUR/AUD Daily Outlook
Daily Pivots: (S1) 1.6236; (P) 1.6278; (R1) 1.6357; More...
A temporary low was formed at 1.6184 with current recovery and intraday bias in EUR/AUD is turned neutral first. But t outlook will remains bearish as long as 1.6629 resistance holds. Break of 1.6184 will extend the whole decline from 1.7180 and target 61.8% projection of 1.7180 to 1.6256 from 1.6629 at 1.6058, which is close to 1.5996 key support level.
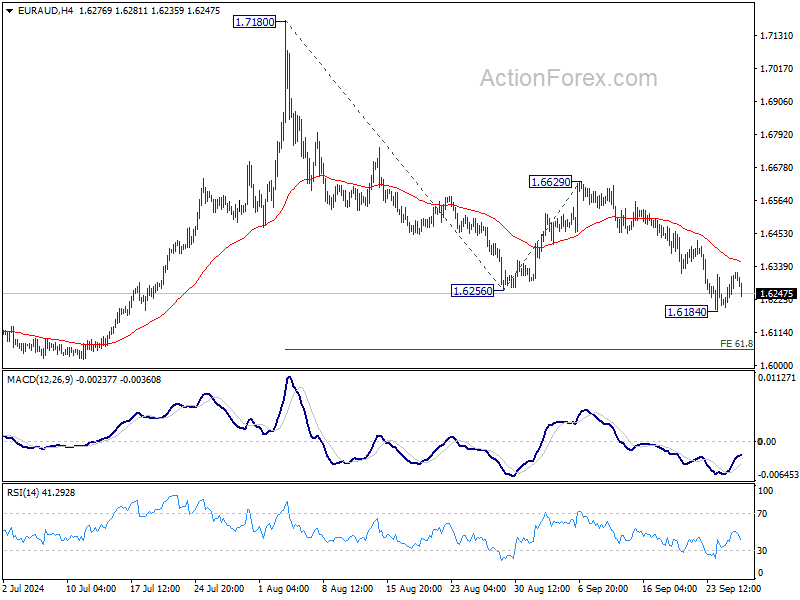
In the bigger picture, outlook is mixed up by the deeper than expected fall from 1.7180. Yet as long as 1.5996 support holds, up trend from 1.4281 (2022 low) is still in favor to resume at a later stage. Firm break of 1.7180 will pave the way to 61.8% projection of 1.4281 to 1.7062 from 1.5996 at 1.7715.
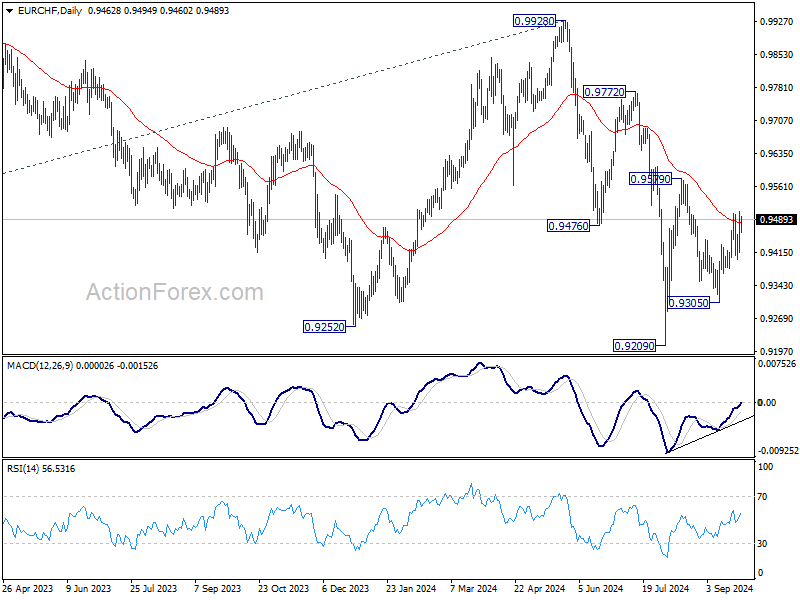
EUR/CHF Daily Outlook
Daily Pivots: (S1) 0.9421; (P) 0.9465; (R1) 0.9511; More....
Intraday bias in EUR/CHF remains neutral for the moment. Another rally is still in favor as long as 0.9305 support holds. On the upside, above 0.9502 will resume the rally from 0.9305, as the third leg of the pattern from 0.9209, to 0.9579 resistance. However, break of 0.9305 will resume the decline from 0.9579 towards 0.9209 low.
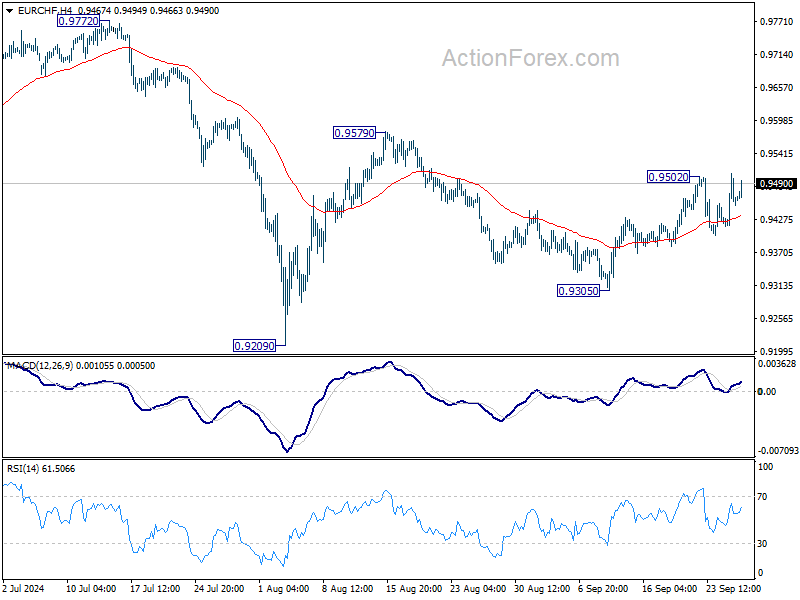
In the bigger picture, medium term corrective pattern from 0.9407 (2022 low) might have completed with three waves to 0.9928. Decisive break of 0.9252 (2023 low) will confirm long term down trend resumption. Next target will be 61.8% projection of 1.1149 to 0.9407 from 0.9928 at 0.8851. For now, outlook will stay bearish as long as 0.9928 resistance holds, even in case of strong rebound.
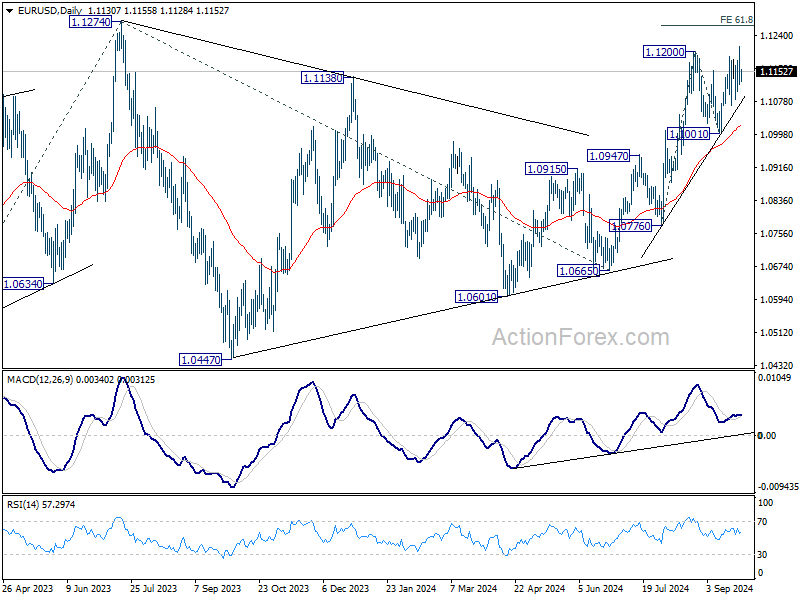
EUR/USD Daily Outlook
Daily Pivots: (S1) 1.1099; (P) 1.1156; (R1) 1.1191; More....
Intraday bias in EUR/USD is turned neutral again with current retreat. Some consolidations would be seen below 1.1213, but further rally is expected as long as 1.1001 support holds. Above 1.1213 will extend larger rally from 1.0665 to 100% projection of 1.0776 to 1.1200 from 1.1001 at 1.1425.
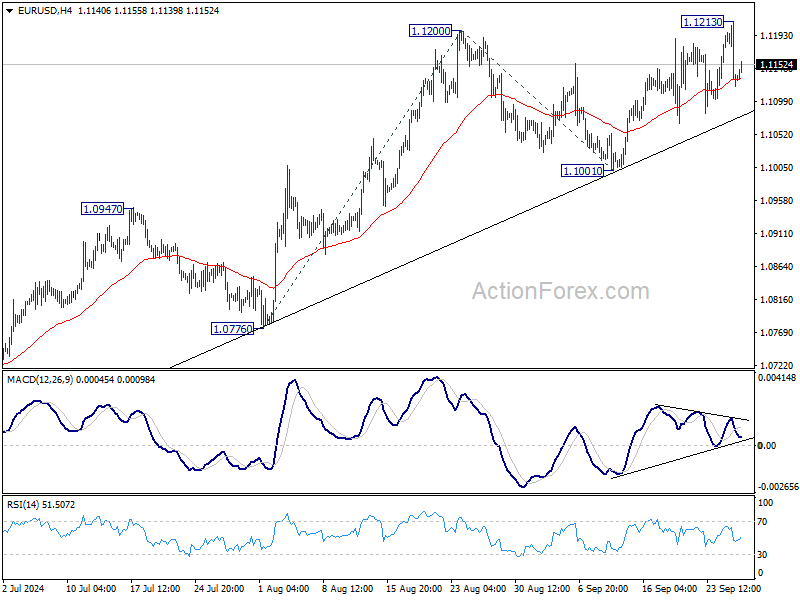
In the bigger picture, corrective pattern from 1.1274 should have completed at 1.0665 already. Decisive break of 1.1274 (2023 high) will confirm resumption of whole up trend from 0.9534 (2022 low). Next target will be 61.8% projection of 0.9534 to 1.1274 from 1.0665 at 1.1740. This will now be the favored case as long as 1.1001 support holds.
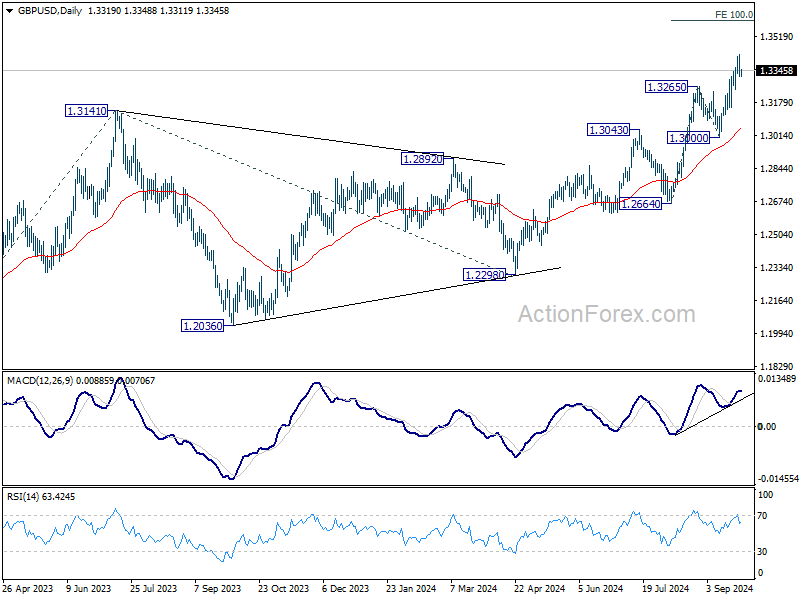
GBP/USD Daily Outlook
Daily Pivots: (S1) 1.3281; (P) 1.3355; (R1) 1.3398; More...
A temporary top is formed at 1.3429 in GBP/USD and intraday bias is turned neutral first. Some consolidations would be seen but outlook will stay bullish as long as 1.3265 resistance turned support holds. Above 1.3429 will extend larger rally to 100% projection of 1.2664 to 1.3265 from 1.3000 at 1.3601 next. Nevertheless, break of 1.3265 will turn bias to the downside for deeper pullback.
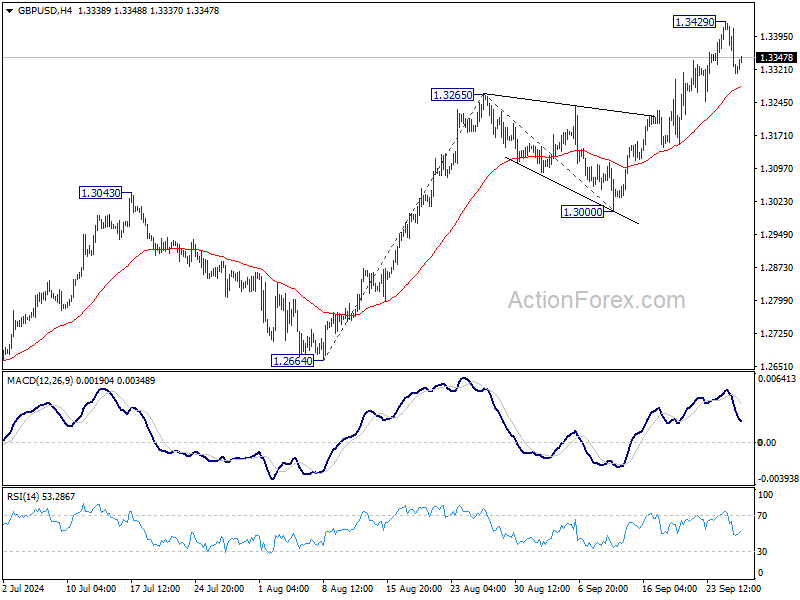
In the bigger picture, up trend from 1.0351 (2022 low) is in progress. Next target is 61.8% projection of 1.0351 to 1.3141 from 1.2298 at 1.4022. For now, outlook will stay bullish as long as 1.3000 support holds, even in case of deep pullback.