Sample Category Title
Dollar Tests Psychological Support
After two weeks of dollar weakness, the currency market is experiencing a pullback. The Dollar Index DXY is rising after briefly dipping below the 100 level. This level had already attracted buyers on the dips of 18 September but failed to reverse the trend.
Since the beginning of 2023, a move towards or through this level has sparked interest in the dollar and triggered several 4-7% rallies. Obviously, the Bulls are hoping for a new reversal from the support line that has been in place for almost two years.
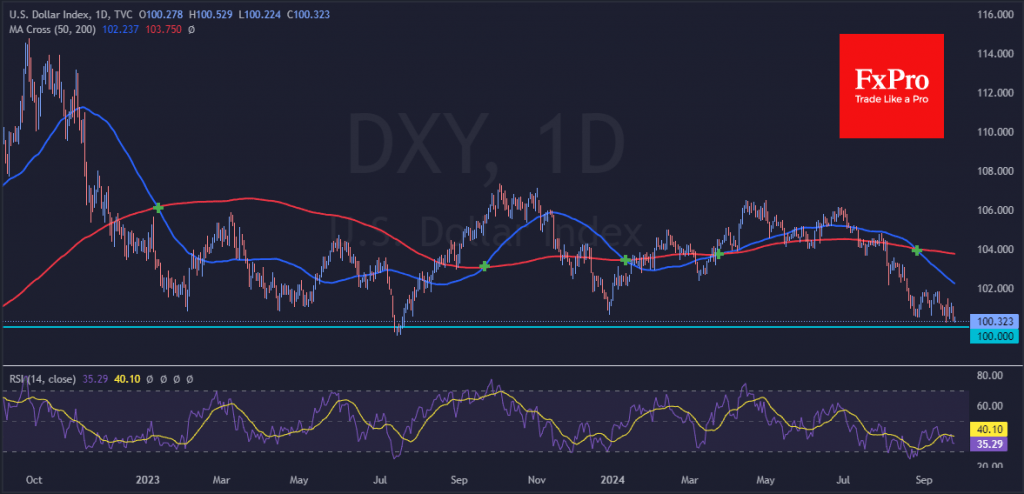
In addition, a price and RSI divergence is forming on the daily timeframe, with lower price lows corresponding to higher index lows. A bounce or reversal often follows this.
However, we see limited room for a bounce in the dollar, the value is being eroded by monetary easing, as markets are pricing in almost a 60% chance of another 50-point decline in early November after a double dip in September.
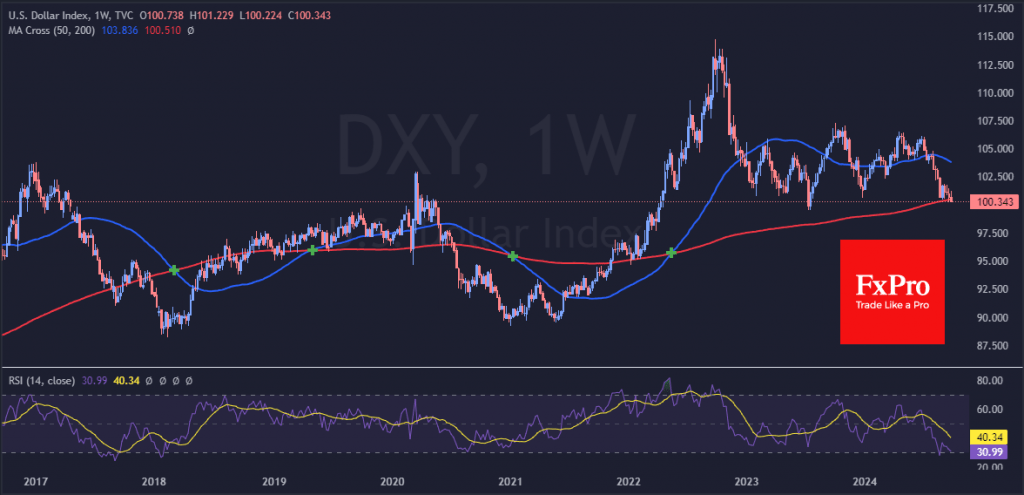
At a higher level—on a weekly basis—the index has fallen below its 200-week moving average. A similar break in the ultra-long-term trend occurred in July 2020 and December 2017. In both cases, it was followed by several consecutive weeks of declines of more than 5%.
The RSI dip into oversold territory on these timeframes was not an early reversal signal. Still, it did trigger a prolonged consolidation – the dollar bulls’ last hope for the coming months.
Sunset Market Commentary
Markets
After last week’s Fed decision, investors were happy to use soft/disappointing data to push money market pricing for ever more aggressive font-loading on Fed and ECB interest rate cuts. Fed members and even more ECB policy makers for now kept a balanced communication mostly favoring a gradual approach. Still markets now see a > 50% chance that the ECB will (have to) step up the pace of rate cuts with an ‘interim’ move in October rather than holding its quarterly pace with a next step in December. For the Fed, a cumulative 75+ bps further easing is discounted despite Fed dots suggesting a main scenario of two 25 bps steps. The US 2y yield is testing 3.55% support (low reached in the wake of the SVB crisis). The EMU 2y swap even trades at the lowest level since September 2022. Today, there was no eco news to further build on this front-loading exercise. It would be an exaggeration to call it a real rebound/correction, but US yields ‘rise’ around 3 bps, awaiting more directional impetus. German yields ‘add’ about 2-3 bps. Further out this week, US durable orders and jobless claims (tomorrow) and Friday’s (expected soft) US PC deflators, might keep yields near recent lows. The next real reference for markets and policy makers will come next week with the US ISM’s and next Friday’s payrolls. EMU flash September inflation will be published on Tuesday next week. The positive fall-out from Chinese multiple easing measures on (mostly) European equity markets already stalled (EuroStoxx 50 -0.2%). That also was the case for the impact on some cyclical commodities including Brent oil ($74/b).
In line with global yields’ trends (easing of global financial conditions), the dollar is holding close to recent lows against most other majors (DXY 100.35). The yen underperforms as markets take somewhat of a more wait-and-see approach on the pace and timing of additional BoJ tightening (USD/JPY rises from 143.23 to 144.05). Maybe a bit strange given recent awful EMU data, EUR/USD remains well bid, slightly outperforming and challenging the YTD top at 1.1202. Sterling this morning briefly tested the GBP/USD 1.343 area (highest since end Feb 2022), but sterling outperformance gradually evaporated despite BoE Green advocating a cautious approach to BoE easing and the OECD upwardly revising UK growth this and next year. After testing the 0.8320 area yesterday, EUR/GBP today rebounds to trade in the 0.8365 area. Cyclically sensitive currency (AUD, NZD, CAD, NOK) and smaller currencies (CZK, HUF, PLN) also are ceding marginal ground.
News & Views
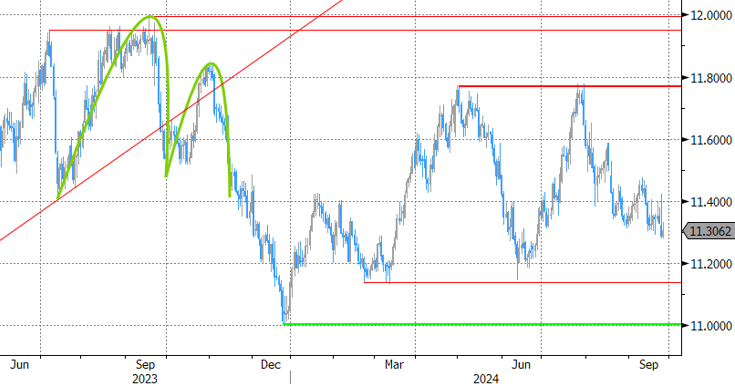
The Swedish Riksbank cut its policy rate for a third time this year and for a second consecutive meeting by 25 bps, from 3.50% to 3.25%. If the outlook for inflation and activity remains unchanged, the policy rate may be cut at the two remaining meetings this year. A 50 bps rate cut is possible at one of these meetings. During H1 2025, the Riksbank also plots one or two further rate cuts (towards 2.25%). That’s a faster path than previously indicated which will contribute to stronger growth and inflation close to target. Updated core inflation forecasts show an average of 1.7% and 1.6% in 2024-2025, down from 1.8%-1.9% in June. The GDP pace is downwardly revised for this year (0.8% from 1.1%) with the recovery set to accelerate next year (1.9% from 1.7%) and in 2026 (2.5% from 2.4%). Risks to the scenario are linked to the recovery in the Swedish economy, the geopolitical unease, and the krona exchange rate that can lead to a different outcome for inflation and the stance of monetary policy. The krona isn’t impressed by the dovish RB turn. A large part was discounted. EUR/SEK holds near lowest levels since June at 11.31.
The OECD published its interim economic outlook today. With robust growth in trade, improvements in real incomes and a more accommodative monetary policy in many economies, the outlook projects global growth persevering at 3.2% in 2024 and 2025, after 3.1% in 2023. Inflation is projected to be back to central bank targets in most G20 economies by the end 2025. Headline inflation in the G20 economies is projected to ease to 5.4% in 2024 and 3.3% in 2025 (6.1% in 2023, with core inflation in the G20 advanced economies easing to 2.7% in 2024 and 2.1% in 2025. OECD Secretary-General Cormann sees the global economy starting to turn the corner. Downside risks include a larger than expected impact on demand from tight monetary policies and persisting geopolitical and trade tensions. Rebuilding fiscal space is key to be able to react to future shocks and future spending pressures, including from population ageing and needed investments in the digital transformation and the climate transition.
Graphs
EUR/SEK: krona holding up well even as Riksbank signals to speed up pace of policy easing/normalization.
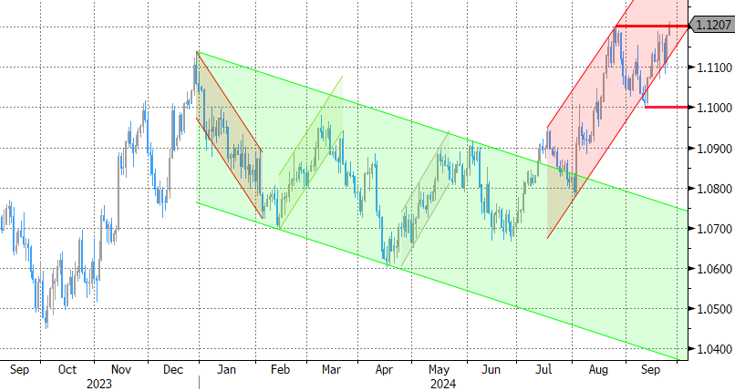
EUR/USD setting new YTD top. Considerations of global easing outweigh poor EMU data.
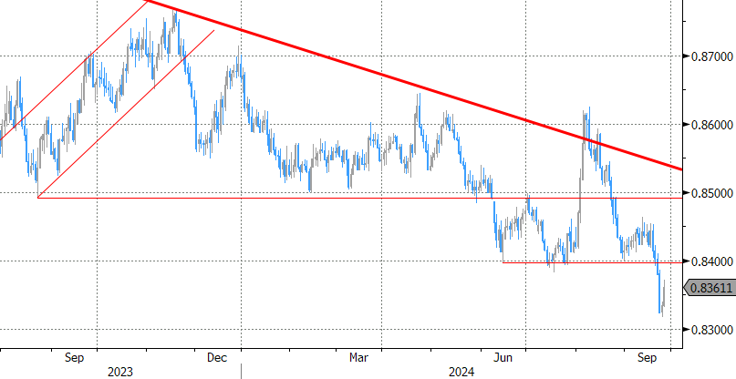
EUR/GBP: sterling taking a breather after recent outperformance against the euro (and the dollar).
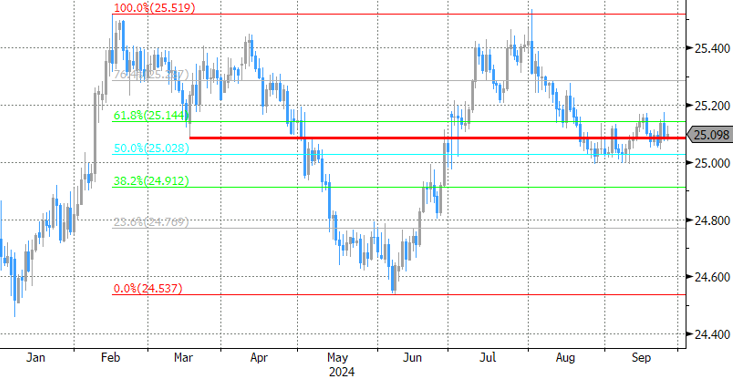
EUR/CZK: Krone shows no directional trend. CNB maintains 25 bps easing pace.
USD/JPY Mid-Day Outlook
Daily Pivots: (S1) 142.67; (P) 143.67; (R1) 144.23; More...
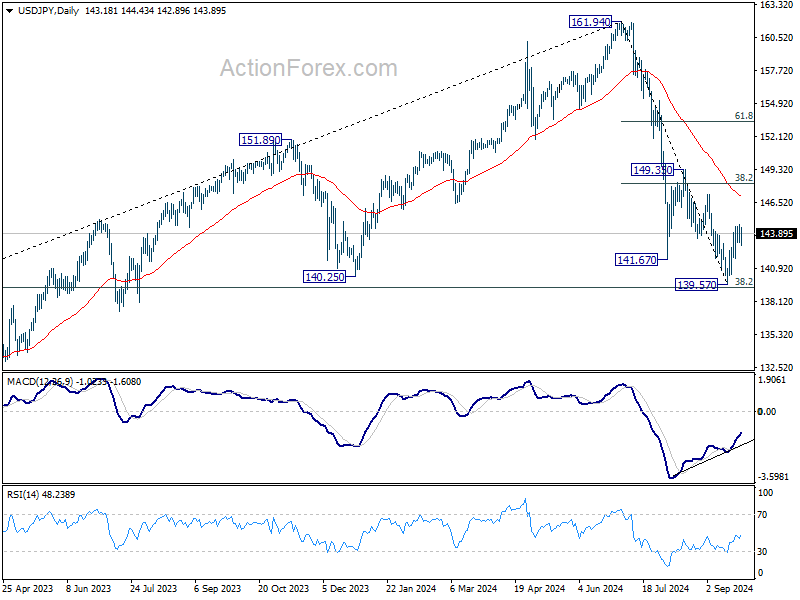
No change in USD/JPY's outlook and further rise is still in favor with 141.73 minor support intact, despite loss of upside momentum as seen in 4H MACD. Rebound from 139.57 short term bottom should extend to 38.2% retracement of 161.94 to 139.57 at 148.11. On the downside, below 141.73 will turn bias to the downside for retesting 139.57 instead.
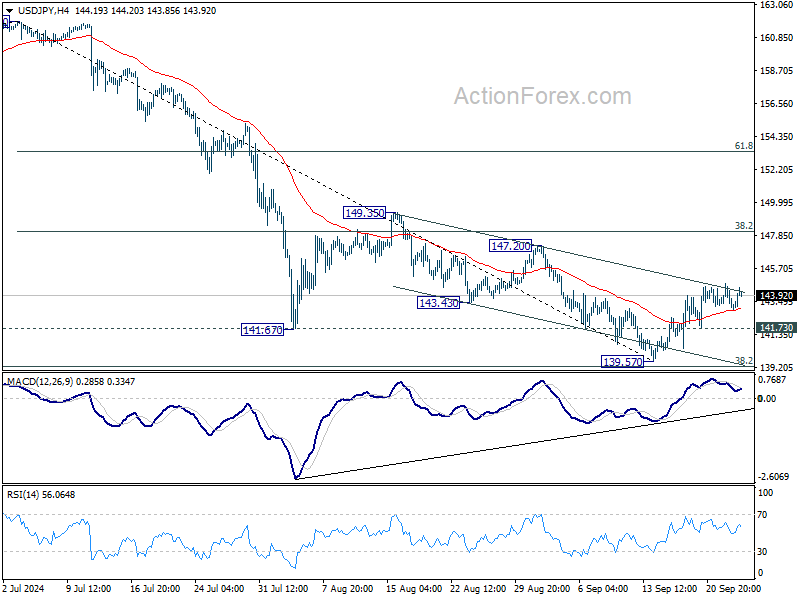
In the bigger picture, fall from 161.94 medium term top is seen as correcting whole up trend from 102.58 (2021 low). Strong support could be seen from 38.2% retracement of 102.58 to 161.94 at 139.26 to contain downside, at least on first attempt. But in any case, risk will stay on the downside as long as 149.35 resistance holds. Sustained break of 139.26 would open up deeper medium term decline to 61.8% retracement at 125.25.
USD/CHF Mid-Day Outlook
Daily Pivots: (S1) 0.8413; (P) 0.8452; (R1) 0.8472; More…
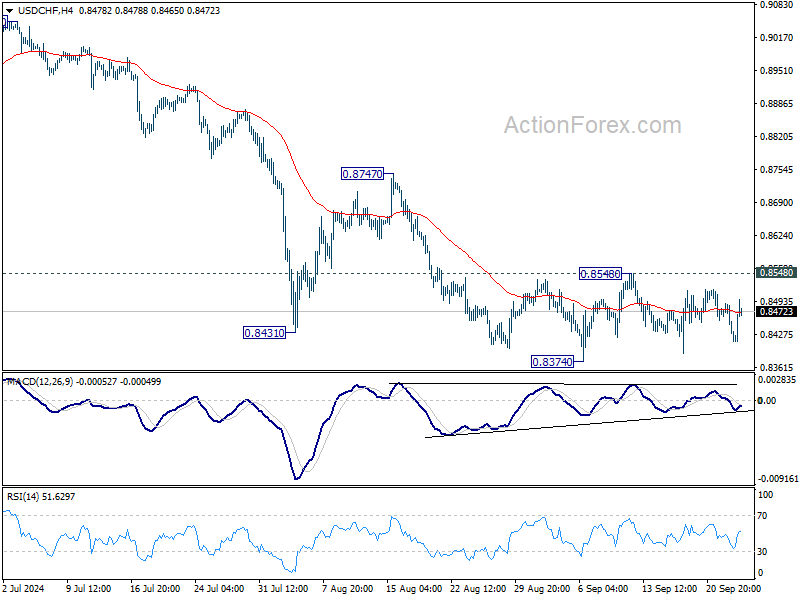
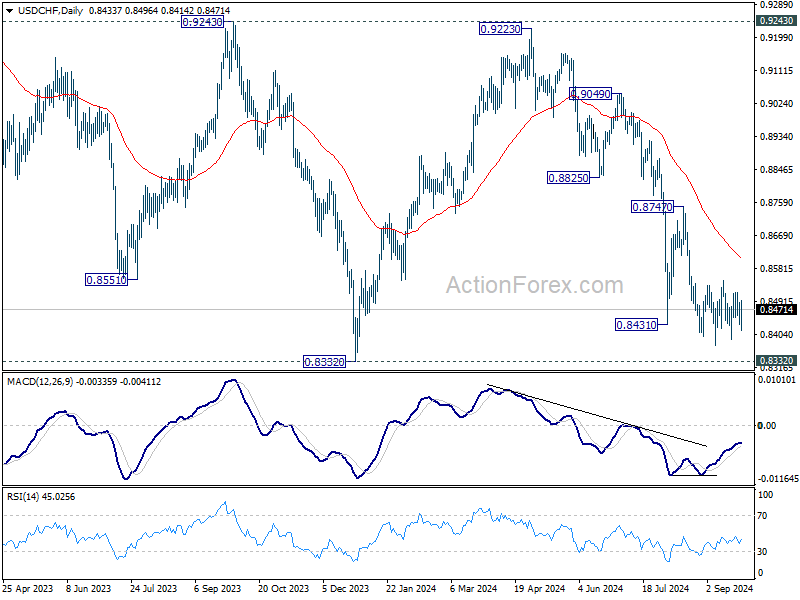
USD/CHF is still bounded in range of 0.8374/8548 and intraday bias remains neutral. On the downside, break of 0.8374 will resume the fall from 0.9223 to retest 0.8332 low. Decisive break there will indicate larger down trend resumption. However, break of 0.8548 resistance will confirm short term bottoming, and turn bias back to the upside for 0.8747 resistance.
In the bigger picture, price actions from 0.8332 (2023 low) are currently seen as a medium term corrective pattern, with fall from 0.9223 as the second leg. Strong support could be seen from 0.8332 to bring rebound. Yet, overall outlook will continue to stay bearish as long as 0.9243 resistance holds. Firm break of 0.8332, however, will resume larger down trend from 1.0146 (2022 high).
GBP/USD Mid-Day Outlook
Daily Pivots: (S1) 1.3358; (P) 1.3387; (R1) 1.3442; More...
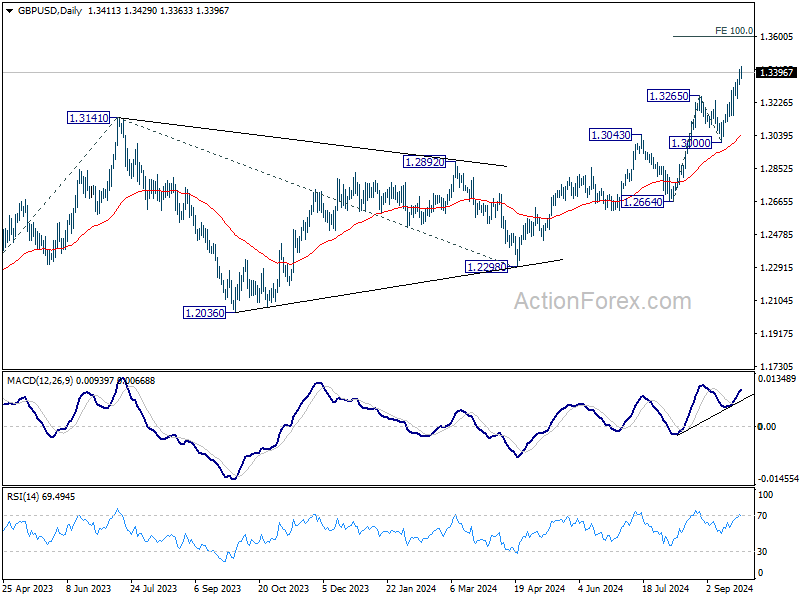
Intraday bias in GBP/USD remains on the upside with 1.3331 minor support intact. Current rally should target 100% projection of 1.2664 to 1.3265 from 1.3000 at 1.3601 next. On the downside, below 1.3331 minor support will turn intraday bias neutral and bring consolidations first, before staging another rise.
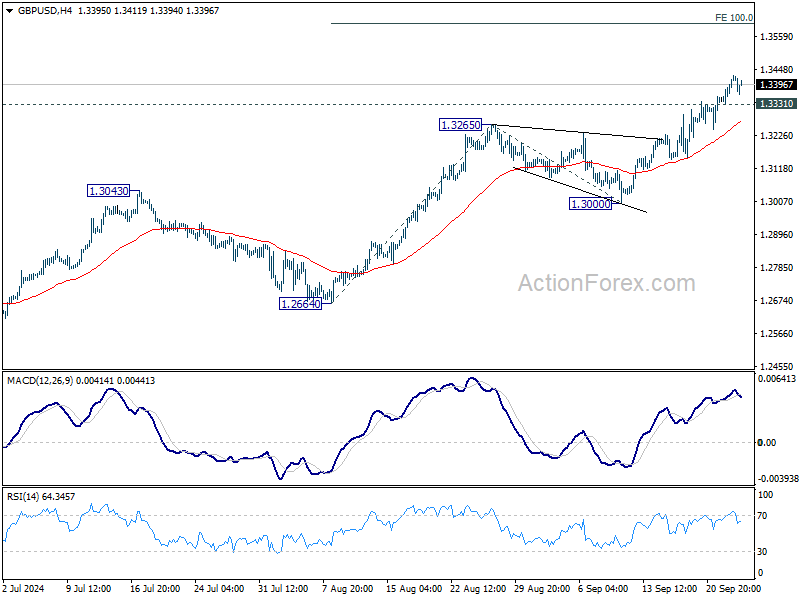
In the bigger picture, up trend from 1.0351 (2022 low) is in progress. Next target is 61.8% projection of 1.0351 to 1.3141 from 1.2298 at 1.4022. For now, outlook will stay bullish as long as 1.3000 support holds, even in case of deep pullback.
EUR/USD Mid-Day Outlook
Daily Pivots: (S1) 1.1128; (P) 1.1155; (R1) 1.1206; More....
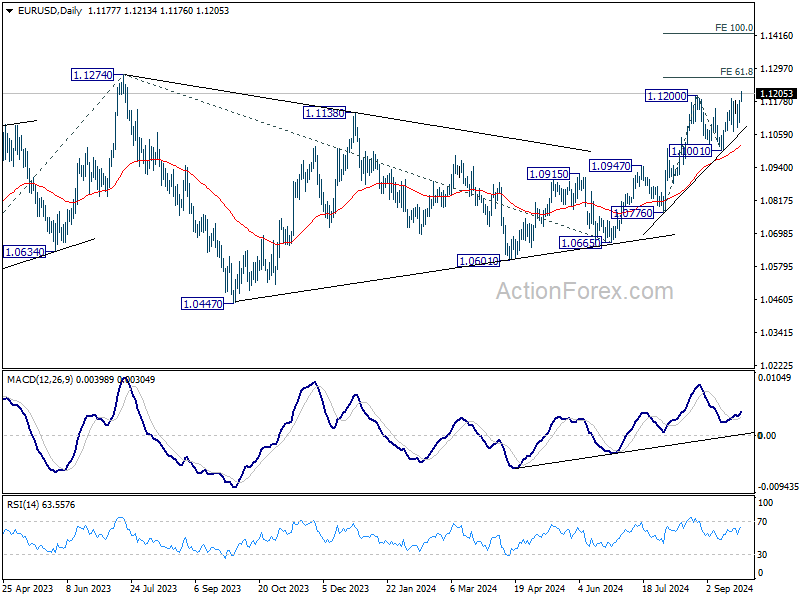
EUR/USD's rise from 1.0665 resumed by breaking 1.1200. Intraday bias is now on the upside to retest 1.1274 high. Firm break there will resume larger up trend. Next near term target will be 100% projection of 1.0776 to 1.1200 from 1.1001 at 1.1425. On the downside, below 1.1020 minor support will turn intraday bias neutral first.
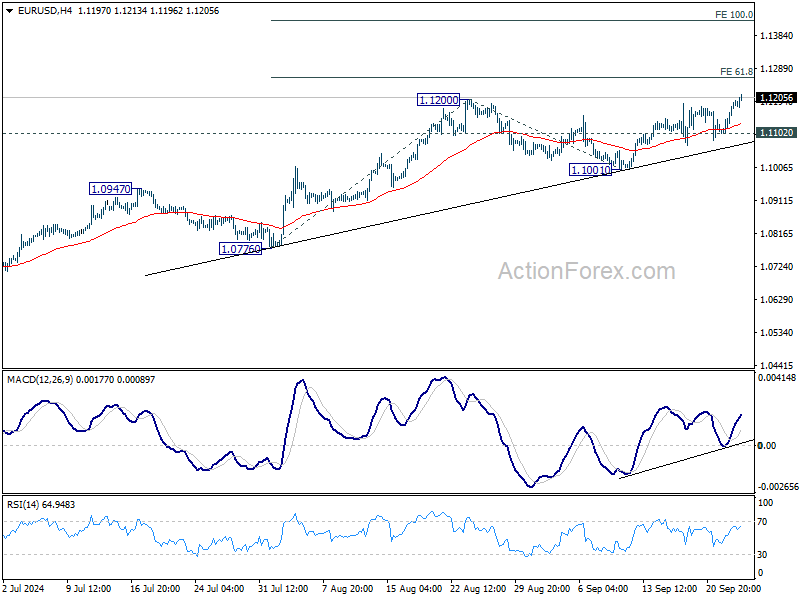
In the bigger picture, corrective pattern from 1.1274 should have completed at 1.0665 already. Decisive break of 1.1274 (2023 high) will confirm resumption of whole up trend from 0.9534 (2022 low). Next target will be 61.8% projection of 0.9534 to 1.1274 from 1.0665 at 1.1740. This will now be the favored case as long as 1.1001 support holds.
Euro Gains Momentum Despite ECB Rate Cut Speculations
Euro is gaining broadly today, even though there is no major fundamental news driving its ascent. Market expectations are mounting that ECB may cut interest rates as early as October, with HSBC projecting 25bps cuts at every meeting from October through April 2025. This would bring the deposit rate to 2.25%, which is considered close to neutral. These predictions are arising even amid cautious remarks from ECB officials.
One factor behind Euro's rise could be the market's growing anticipation of aggressive rate cuts by Fed, , with futures markets pricing in nearly 60% chance of another 50bps cut in November. This suggests that, despite potential rate cuts by ECB in October, Fed's moves could outpace those of ECB for 2024. Additionally, Euro is gaining against Swiss Franc, as speculation mounts that the SNB might deliver a 50bps rate cut in its upcoming meeting tomorrow. Meanwhile, Euro's recovery appears to be driven more by technical factors, as it found support at a near-term fibonacci projection level.
In the broader forex market, the Yen so far is the worst performer this week, followed by Dollar and Swiss Franc, while Kiwi leads gains, followed by Aussie and Loonie. Sterling and Euro sit in the middle, reflecting a typical risk-on sentiment in the market.
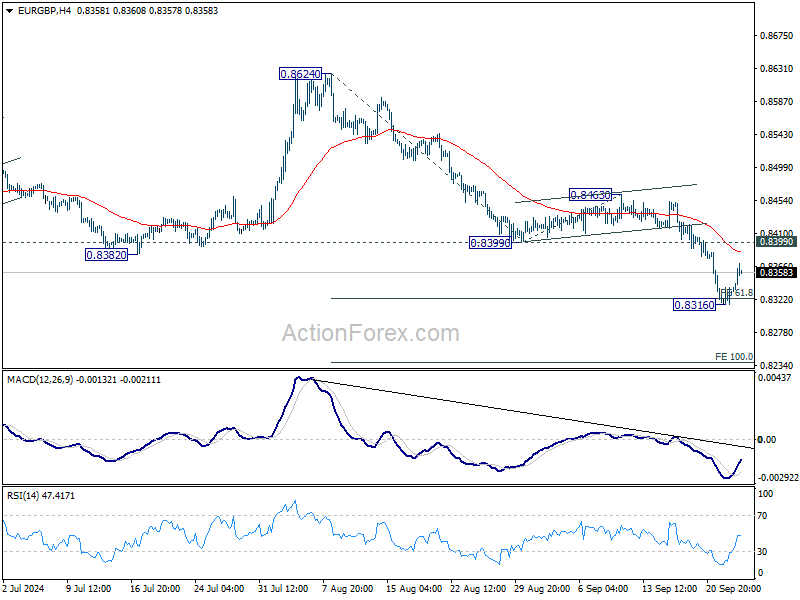
Technically, while EUR/GBP recovered after hitting 61.8% projection of 0.8624 to 0.8399 from 0.8463 at 0.8324, outlook will stay bearish as long as 0.8399 support turned resistance holds. Break of 0.8316 will extend the larger down trend to 100% projection at 0.8237 next.
In Europe, at the time of writing, FTSE is up 0.08%. DAX is down -0.24%. CAC is down -0.23%. UK 10-year yield is up 0.0201 at 3.962. Germany 10-year yield is up 0.029 at 2.177. Earlier in Asia, Nikkei fell -0.19%. Hong Kong HSI rose 0.68%. China Shanghai SSE rose 1.16%. Singapore Strait Times fell -1.09%. Japan 10-year JGB yield rose 0.0018 to 0.813.
OECD sees 3.2% global growth in 2024 and 2025
In the Economic Outlook Interim Report, OECD raised its global GDP growth forecast for 2024 by 0.1% to 3.2%, while keeping the 2025 projection steady at 3.2%.
In the US, growth forecasts remain unchanged at 2.6% for 2024 but have been downgraded by 0.2% to 1.6% for 2025. Eurozone's GDP growth forecast is unchanged at 0.7% for 2024 and revised down by 0.2% to 1.3% for 2025. Japan faces a significant downgrade for 2024, with growth reduced by -0.6% to -0.1%, but 2025 forecast is upgraded by 0.3% to 1.4%.
The UK sees a notable upward revision, with growth forecasts increased by 0.7% to 1.1% in 2024 and by 0.2% to 1.2% in 2025. Canada's GDP growth is slightly upgraded by 0.1% to 1.1% in 2024, remaining unchanged at 1.8% in 2025. Australia faces a sharp downgrade, with 2024 growth reduced by -0.4% to 1.1% and 2025 growth also cut by -0.4% to 1.8%.
As inflation trends toward central bank targets, OECD projects that Fed's main interest rate could ease to 3.5% by the end of 2025 from the current range of 4.75%-5%. Similarly, ECB is expected to reduce its rate to 2.25% from 3.5% now. In contrast, Japan may see "further mild increases in policy interest rates," with gradual withdrawal of policy accommodation, provided inflation stabilizes at the 2%.
BoE's Greene warns of higher neutral Rate, supports measured easing approach
BoE MPC member Megan Greene emphasized the need for a "gradual approach" to easing monetary policy in her speech today. She highlighted that her recent vote to hold the Bank Rate at 5% in September, following a 25bpps cut in August, aligns with this stance.
Greene outlined three key economic scenarios influencing inflation and policy decisions.
In the first scenario, global shocks fade, allowing inflation pressures to ease with "less restrictive" policy. In the second, some "economic slack" is needed to bring inflation back to the target sustainably. In the third, structural changes affecting wage and price-setting could require monetary policy to remain "tighter for longer".
Greene sees the second scenario as the most likely, where slack in the economy will be needed to tame inflation. However, she warned that there is a "higher risk" of the third scenario playing out, suggesting that the neutral interest rate could be higher than previously thought, meaning that current policy may not be as restrictive as anticipated. Greene noted, "I believe the risks to activity are to the upside," which could require maintaining higher rates for longer.
She will monitor data to confirm whether the third scenario risk is decreasing and the second is becoming more likely. Until then, "steady-as-she goes approach to monetary policy easing is appropriate," she added.
Australia's monthly CPI falls to 2.7%, lowest since 2021
Australia's monthly CPI slowed from 3.5% yoy to 2.7% yoy in August, marking the lowest reading since August 2021. Core inflation measures also eased, with CPI excluding volatile items and holiday travel declining to 3.0% yoy from 3.7% yoy, and the annual trimmed mean falling to 3.4% yoy from 3.8% yoy. Both underlying inflation indicators are now at their lowest levels in two and a half years.
Significant price increases were observed in Housing (+2.6%), Food and non-alcoholic beverages (+3.4%), and Alcohol and tobacco (+6.6%). These gains were "partly offset" by a -1.1% decrease in Transport costs.
Notably, electricity prices plummeted by -17.9% over the 12 months to August—the largest annual fall since the early 1980s—driven by Commonwealth and State Government rebates that led to a -14.6% drop in August following a -6.4% decline in July. Excluding these rebates, electricity prices would have risen 0.1% in August and 0.9% in July.
EUR/USD Mid-Day Outlook
Daily Pivots: (S1) 1.1128; (P) 1.1155; (R1) 1.1206; More....
EUR/USD's rise from 1.0665 resumed by breaking 1.1200. Intraday bias is now on the upside to retest 1.1274 high. Firm break there will resume larger up trend. Next near term target will be 100% projection of 1.0776 to 1.1200 from 1.1001 at 1.1425. On the downside, below 1.1020 minor support will turn intraday bias neutral first.
In the bigger picture, corrective pattern from 1.1274 should have completed at 1.0665 already. Decisive break of 1.1274 (2023 high) will confirm resumption of whole up trend from 0.9534 (2022 low). Next target will be 61.8% projection of 0.9534 to 1.1274 from 1.0665 at 1.1740. This will now be the favored case as long as 1.1001 support holds.
Economic Indicators Update
| GMT | CCY | EVENTS | ACT | F/C | PP | REV |
|---|---|---|---|---|---|---|
| 23:50 | JPY | Corporate Service Price Index Y/Y Aug | 2.70% | 2.70% | 2.80% | 2.70% |
| 01:30 | AUD | Monthly CPI Y/Y Aug | 2.70% | 2.70% | 3.50% | |
| 08:00 | CHF | UBS Economic Expectations Sep | -8.8 | -3.4 | ||
| 14:00 | USD | New Home Sales Aug | 693K | 739K | ||
| 14:30 | USD | Crude Oil Inventories | -1.3M | -1.6M |
Swiss National Bank (SNB) Preview – FX Intervention Chatter, USD/CHF Eyes Range Breakout
- Swiss National Bank (SNB) decision anticipated, markets split on 25 or 50 basis point rate cut.
- Strong Swiss Franc pressures exporters, raising expectations of FX intervention.
- SNB’s comments on Franc and intervention will be key to future price movements.
SNB Preview: FX Intervention Ahead?
Market participants are awaiting the next major Central Bank decision which comes from the SNB tomorrow. The Swiss Franc has been enjoying an excellent run since the May 1st high around the 0.92246 handle.
Looking at the Swiss economy, inflation has been consistently lower than expected, but the strong Swiss franc is putting pressure on exporting companies. Looking at refinitiv data and markets are split between a 25 and 50 basis point rate cut on Thursday. Market participants will keep a close eye on any guidance from the Swiss National Bank about intervening in the currency markets.
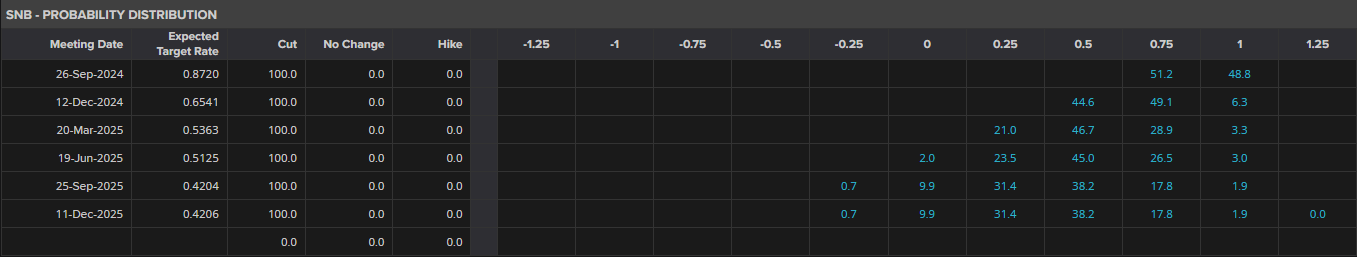
Source: LSEG
The SNB is also expected to downgrade its outlook on inflation moving forward following the most recent inflation data. Inflation is currently averaging 1.2% in Q3 versus the 1.5% expected with concern now resting more on the effect of a strong Swiss Franc on companies amid weakening demand in Europe.
The stronger Franc has become a major issue for Swiss exporters with watch manufacturers last week urging the SNB to ensure the Swiss Franc weakens. This has raised the question of FX intervention once more, with growing expectation that the Central Bank will intervene and step up its intervention in the coming weeks. Growing uncertainty around the globe has also made the Swiss Franc more appealing thanks to its safe haven status and this is another reason why FX intervention may be necessary.
Potential Impact and USD/CHF Technical Analysis
Despite the split consensus heading into tomorrow’s meeting, I am leaning more to the 25bps camp. This is the least risky option at present for the SNB as they do have FX intervention available to ensure weakness in the Franc.
A 25 bps cut may see some short term appreciation in the Franc but with intervention chatter prevalent, any gains could prove short-lived. Market participants should pay attention to comments from the SNB Chairman regarding the Franc and the potential for intervention as this may play a key role in how price develops once the SNB decision is over.
USD/CHF
From a technical perspective, USD/CHF has been in a period of consolidation since August 22. The range between 0.85288 and 0.84099 has held firm with the pair appearing to form a base here for potential longs.
The Fed decision of a 50 bps cut was not enough to inspire a breakout to the downside and thus my take is such a breakout remains unlikely. A short-term retest of the range low may occur but I expect the daily candle to remain inside the range barring any unexpected surprises.
Looking at the RSI, it has crossed above the neutral 50 level which is a sign that bullish momentum is present. This could prove beneficial for USD/CHF bulls eyeing a move higher.
A move higher and daily candle above the range high at 0.8528 will then face the inner trendline which rests around the 0.8580 to 0.8600 handle. A break higher brings resistance at 0.8700 ad 0.8750 into focus.
USD/CHF Daily Chart, September 25, 2024
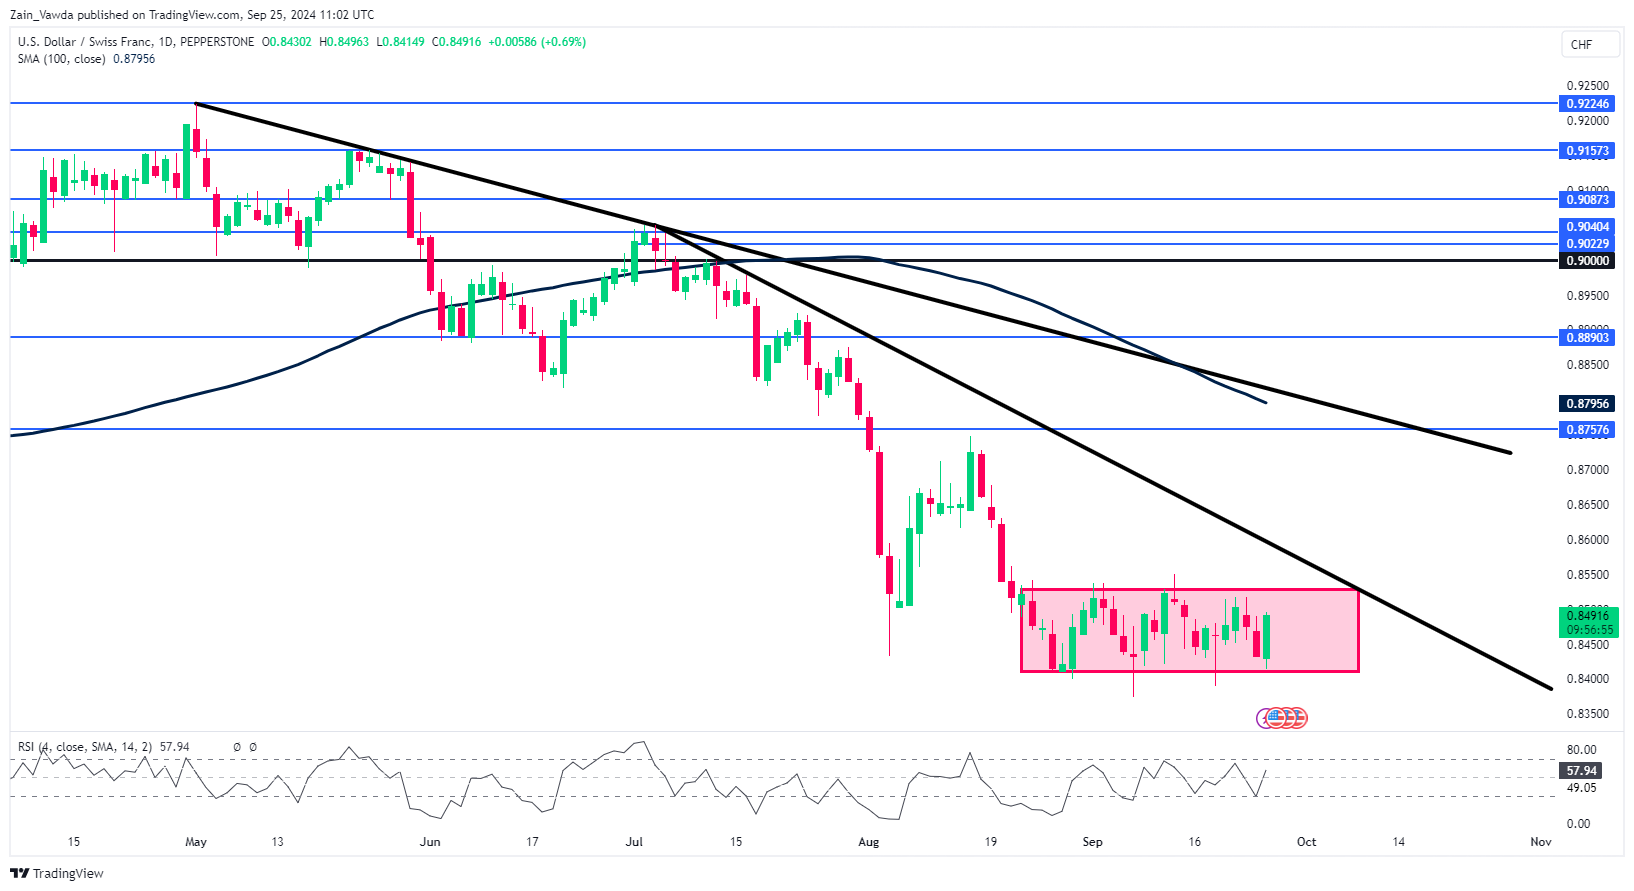
Support
- 0.8400
- 0.8334
Resistance
- 0.8528
- 0.8600
USD/JPY Stabilises Amid Bank of Japan’s Cautious Signals
The USD/JPY pair has found a stable footing around 143.22 as investors carefully analyse the recent comments from Bank of Japan Governor Kazuo Ueda. His remarks suggest that the BoJ is taking a measured approach to monetary policy adjustments, signalling a possible delay in interest rate hikes.
Governor Ueda emphasised the need to thoroughly analyse market and economic conditions before making policy decisions, indicating that immediate rate hikes are unlikely. He also highlighted external risks, including financial market volatility and uncertainties surrounding the US economy, which are critical considerations for Japan's monetary policy.
At its September meeting, the BoJ maintained the interest rate at 0.25% per annum, aligning with market expectations. Speculation suggests that the October meeting may not change the Monetary Policy Committee's structure. Still, by December, the BoJ might gather sufficient evidence to justify a rate increase.
The recent dip in the US dollar, spurred by weak consumer confidence figures in the US, has incidentally strengthened the yen. This shift has heightened expectations for further rate cuts by the Federal Reserve.
Technical Analysis of USD/JPY
The USD/JPY is currently in a broad consolidation range centred around 143.43, extending to 144.66. The market has initiated a downward movement towards 142.55, testing this level from above. Subsequently, we anticipate a rebound to the upper boundary of this range. A breach above 144.70 could pave the way for a rise to 145.77, potentially extending to 146.66. Conversely, a decline to 142.00 and a subsequent breakdown could signal a trend continuation towards 137.77. The MACD indicator supports this bullish scenario, with its signal line positioned above zero and pointing upwards.
On the H1 chart, USD/JPY has crafted a consolidation range around 143.60, achieving the 142.90 local downside target. The pair is now moving upward towards 143.60, testing this level from below. The current setup suggests a retest of 143.60 could be followed by a new decline towards 142.55. The Stochastic oscillator, with its signal line above 50 and pointing upwards, corroborates this potential for a brief uptick followed by a continued downward trajectory.
OECD sees 3.2% global growth in 2024 and 2025
In the Economic Outlook Interim Report, OECD raised its global GDP growth forecast for 2024 by 0.1% to 3.2%, while keeping the 2025 projection steady at 3.2%.
In the US, growth forecasts remain unchanged at 2.6% for 2024 but have been downgraded by 0.2% to 1.6% for 2025. Eurozone's GDP growth forecast is unchanged at 0.7% for 2024 and revised down by 0.2% to 1.3% for 2025. Japan faces a significant downgrade for 2024, with growth reduced by -0.6% to -0.1%, but 2025 forecast is upgraded by 0.3% to 1.4%.
The UK sees a notable upward revision, with growth forecasts increased by 0.7% to 1.1% in 2024 and by 0.2% to 1.2% in 2025. Canada's GDP growth is slightly upgraded by 0.1% to 1.1% in 2024, remaining unchanged at 1.8% in 2025. Australia faces a sharp downgrade, with 2024 growth reduced by -0.4% to 1.1% and 2025 growth also cut by -0.4% to 1.8%.

As inflation trends toward central bank targets, OECD projects that Fed's main interest rate could ease to 3.5% by the end of 2025 from the current range of 4.75%-5%. Similarly, ECB is expected to reduce its rate to 2.25% from 3.5% now. In contrast, Japan may see "further mild increases in policy interest rates," with gradual withdrawal of policy accommodation, provided inflation stabilizes at the 2%.