
Sample Category Title
USD/CHF Daily Outlook
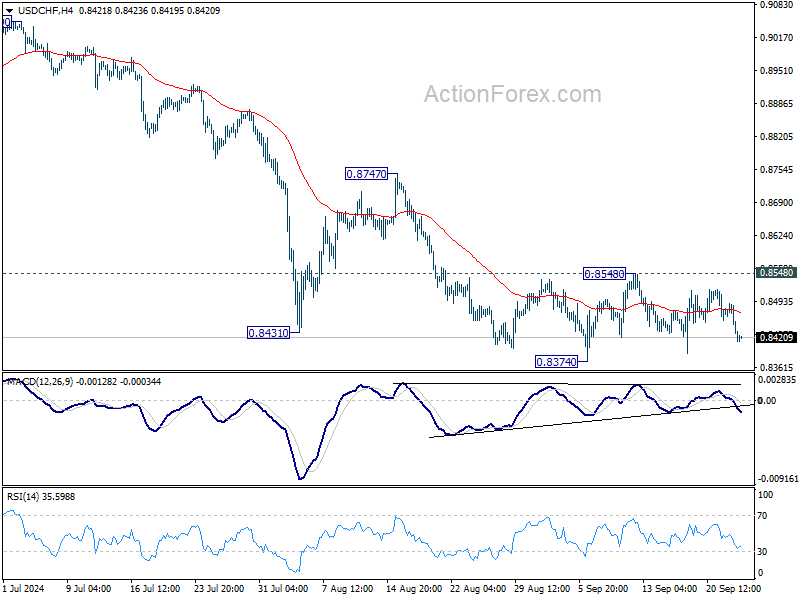
Daily Pivots: (S1) 0.8413; (P) 0.8452; (R1) 0.8472; More…
No change in USD/CHF's outlook as range trading continues. Intraday bias stays neutral for the moment. On the downside, break of 0.8374 will resume the fall from 0.9223 to retest 0.8332 low. Decisive break there will indicate larger down trend resumption. However, break of 0.8548 resistance will confirm short term bottoming, and turn bias back to the upside for 0.8747 resistance.
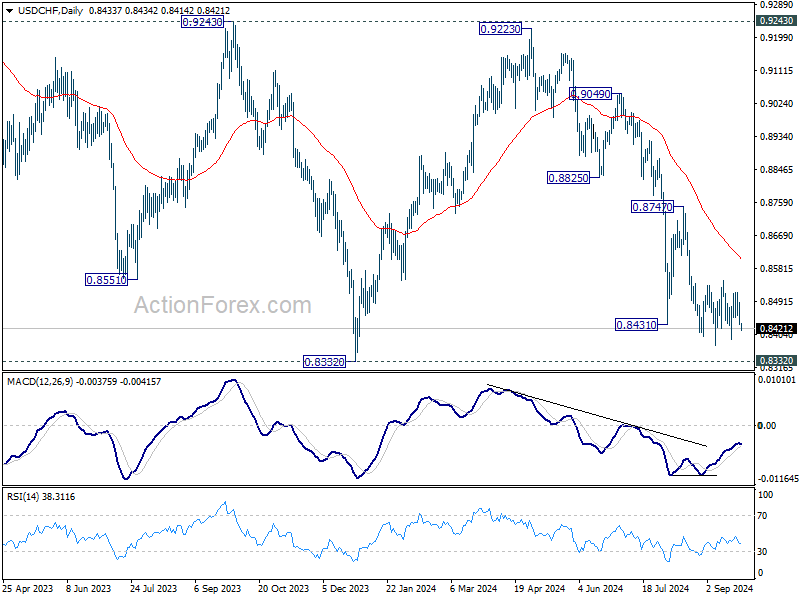
In the bigger picture, price actions from 0.8332 (2023 low) are currently seen as a medium term corrective pattern, with fall from 0.9223 as the second leg. Strong support could be seen from 0.8332 to bring rebound. Yet, overall outlook will continue to stay bearish as long as 0.9243 resistance holds. Firm break of 0.8332, however, will resume larger down trend from 1.0146 (2022 high).
GBP/USD Daily Outlook
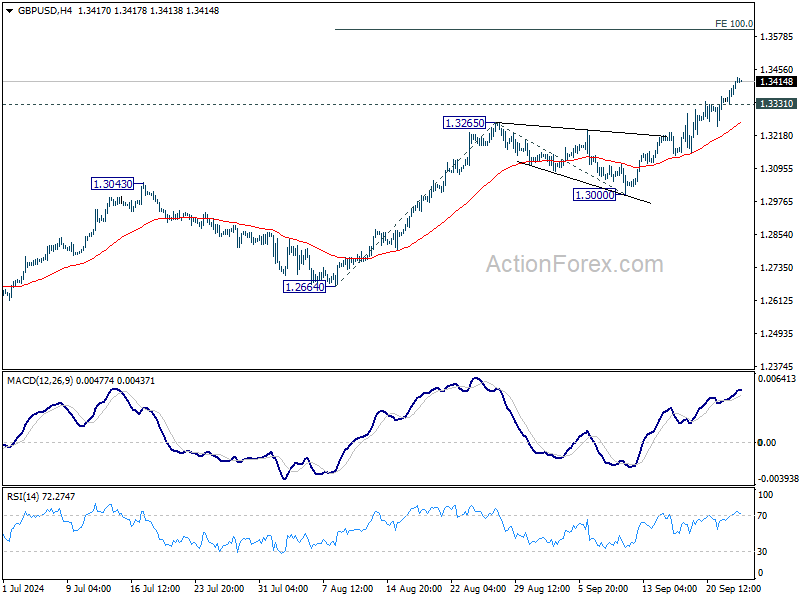
Daily Pivots: (S1) 1.3358; (P) 1.3387; (R1) 1.3442; More...
GBP/USD's rally continues today and hit as high as 1.3429 so far. Intraday bias stays on the upside for 100% projection of 1.2664 to 1.3265 from 1.3000 at 1.3601 next. On the downside, below 1.3331 minor support will turn intraday bias neutral and bring consolidations first, before staging another rally.
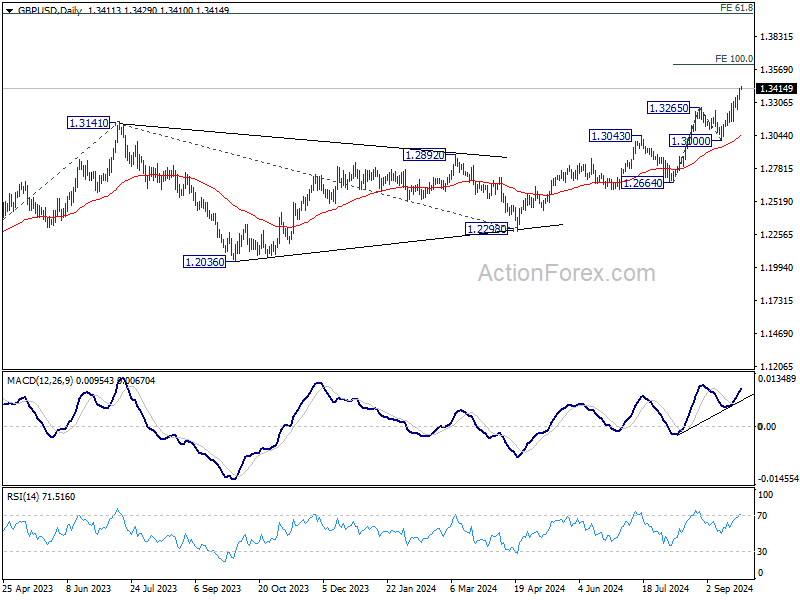
In the bigger picture, up trend from 1.0351 (2022 low) is in progress. Next target is 61.8% projection of 1.0351 to 1.3141 from 1.2298 at 1.4022. For now, outlook will stay bullish as long as 1.3000 support holds, even in case of deep pullback.
EUR/USD Daily Outlook
Daily Pivots: (S1) 1.1128; (P) 1.1155; (R1) 1.1206; More....
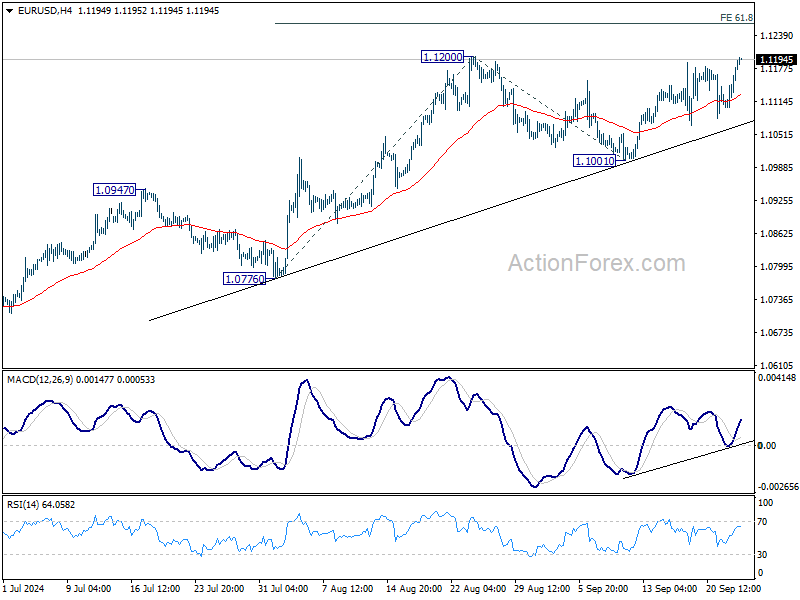
Immediate focus is now on 1.1200 resistance as EUR/USD's rebound from 1.1001 extends today. Break there will resume the rally from 1.0665 to retest 1.1274 high. Firm break there will resume larger up trend. Next near term target will be 100% projection of 1.0776 to 1.1200 from 1.1001 at 1.1425. Rejection by 1.1200 will bring another retreat. But outlook will continue to stay bullish as long as 1.1001 support holds.
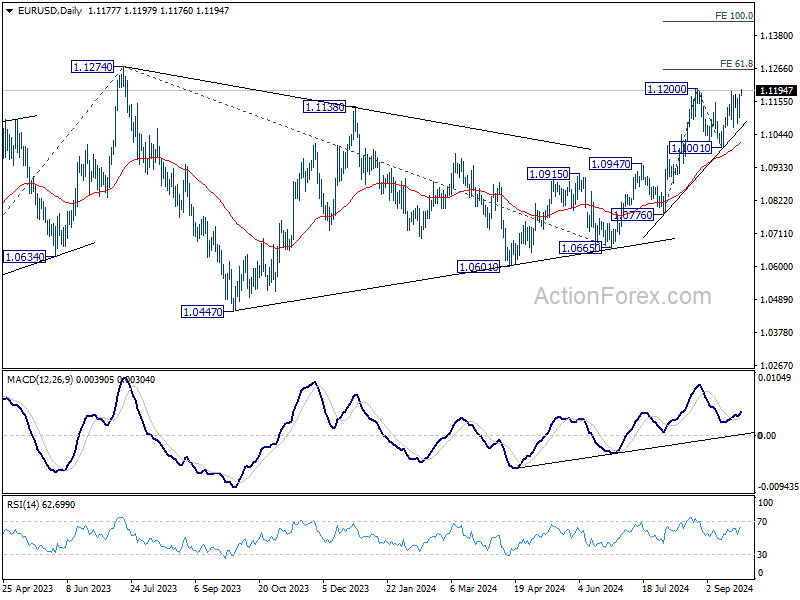
In the bigger picture, prior break of 1.1138 resistance indicates that corrective pattern from 1.1274 might have completed at 1.0665 already. Decisive break of 1.1274 (2023 high) will confirm resumption of whole up trend from 0.9534 (2022 low). Next target will be 61.8% projection of 0.9534 to 1.1274 from 1.0665 at 1.1740. This will now be the favored case as long as 1.0947 resistance turned support holds.
Dollar Slumps as Euro Eyes August High, Hong Kong Markets Approach Crucial Resistance
Dollar continued its broad-based weakness in Asian session, with selling pressure shifting towards European majors. EUR/USD is approaching its August high as the near-term rebound gathers momentum. This decline in the Dollar is partly attributed to weaker-than-expected US consumer confidence data released overnight, which has intensified market expectations of consecutive 50bps rate cuts by Fed in November.
On the European front, speculation about another 25bps rate cut by ECB in October has been tempered by recent comments from policymakers. It appears that ECB officials are still viewing December as a more suitable time for further monetary adjustments, given that more comprehensive economic data will be available by then.
So far this week, Dollar is the worst-performing major currency, followed by Euro and Japanese Yen. Kiwi leads gains, buoyed by positive risk sentiment, followed by Aussie and Loonie. Sterling and Swiss Franc are trading in the middle range, with attention on Swiss Franc ahead of tomorrow's SNB rate decision.
Meanwhile, risk-on sentiment continues to dominate Hong Kong and China markets, as supported by yesterday's stimulus announcement by PBoC. Hong Kong HSI is now eyeing an important medium term resistance level at around 20000 psychological level, with 61.8% projection of 14794.16 to 19706.12 from 17127.25 at 19999.87. Decisive break of this level would confirm that it's already in a medium term up trend and target 100% projection at 21876.24. That, if realized, would be supportive to Aussie and Kiwi.
In Asia, at the time of writing, Nikkei is up 0.13%. Hong Kong HSI is up 2.01%. China Shanghai SSE is up 1.73%. Singapore Strait Times is down -0.64%. Japan 10-year JGB yield is up 0.005 at 0.816. Overnight, DOW rose 0.20%. S&P 500 rose 0.25%. NASDAQ rose 0.56%. 10-year yield fell -0.003 to 3.736.
Australia's monthly CPI falls to 2.7%, lowest since 2021
Australia's monthly CPI slowed from 3.5% yoy to 2.7% yoy in August, marking the lowest reading since August 2021. Core inflation measures also eased, with CPI excluding volatile items and holiday travel declining to 3.0% yoy from 3.7% yoy, and the annual trimmed mean falling to 3.4% yoy from 3.8% yoy. Both underlying inflation indicators are now at their lowest levels in two and a half years.
Significant price increases were observed in Housing (+2.6%), Food and non-alcoholic beverages (+3.4%), and Alcohol and tobacco (+6.6%). These gains were "partly offset" by a -1.1% decrease in Transport costs.
Notably, electricity prices plummeted by -17.9% over the 12 months to August—the largest annual fall since the early 1980s—driven by Commonwealth and State Government rebates that led to a -14.6% drop in August following a -6.4% decline in July. Excluding these rebates, electricity prices would have risen 0.1% in August and 0.9% in July.
BoC's Macklem signals more rate cuts as inflation progress continue
BoC Governor Tiff Macklem, in a speech overnight, suggested that more interest rate cuts are likely, contingent on incoming economic data. He acknowledged, "With the continued progress we've seen on inflation, it is reasonable to expect further cuts in our policy rate."
However, he emphasized that the timing and pace of such cuts would be determined by the assessment of future inflation and broader economic conditions.
Macklem noted that economic growth had picked up in H1, but some recent indicators suggest it may not be as robust as previously anticipated. "We will be closely watching consumer spending, as well as business hiring and investment," he said.
He also expressed the need to see core inflation ease further. Shelter cost inflation remains elevated but is beginning to decline, and BoC is looking for this trend to continue. "Continued progress on inflation will be crucial to ensure our policy remains effective," Macklem added.
ECB's Knot: Likely to continue rate cuts into H1 2025
In an interview on Dutch television overnight, ECB Governing Council member Klaas Knot emphasized that interest rates across Europe are poised for continued gradual reductions. Knot affirmed that as ECB gains confidence in achieving its 2% inflation target, "interest rates will simply keep falling."
Looking ahead, "I would expect us to continue to gradually reduce interest rates in the coming time, also in the first half of 2025," Knot added.
However, he cautioned against expectations of a return to the ultra-low rates seen before the pandemic. Instead, he suggested that rates are likely to settle at a "more natural level" within a range starting with a 2.
EUR/USD Daily Outlook
Daily Pivots: (S1) 1.1128; (P) 1.1155; (R1) 1.1206; More....
Immediate focus is now on 1.1200 resistance as EUR/USD's rebound from 1.1001 extends today. Break there will resume the rally from 1.0665 to retest 1.1274 high. Firm break there will resume larger up trend. Next near term target will be 100% projection of 1.0776 to 1.1200 from 1.1001 at 1.1425. Rejection by 1.1200 will bring another retreat. But outlook will continue to stay bullish as long as 1.1001 support holds.
In the bigger picture, prior break of 1.1138 resistance indicates that corrective pattern from 1.1274 might have completed at 1.0665 already. Decisive break of 1.1274 (2023 high) will confirm resumption of whole up trend from 0.9534 (2022 low). Next target will be 61.8% projection of 0.9534 to 1.1274 from 1.0665 at 1.1740. This will now be the favored case as long as 1.0947 resistance turned support holds.
Economic Indicators Update
| GMT | CCY | EVENTS | ACT | F/C | PP | REV |
|---|---|---|---|---|---|---|
| 23:50 | JPY | Corporate Service Price Index Y/Y Aug | 2.70% | 2.70% | 2.80% | 2.70% |
| 01:30 | AUD | Monthly CPI Y/Y Aug | 2.70% | 2.70% | 3.50% | |
| 08:00 | CHF | UBS Economic Expectations Sep | -3.4 | |||
| 14:00 | USD | New Home Sales Aug | 693K | 739K | ||
| 14:30 | USD | Crude Oil Inventories | -1.3M | -1.6M |
Gold Surges to New Peak: Is $2,750 The Next Milestone?
Key Highlights
- Gold rallied to a new all-time high above the $2,660 level.
- A major bullish trend line is forming with support at $2,590 on the 4-hour chart.
- Oil prices might struggle to settle above the $73.50 resistance zone.
- EUR/USD is consolidating gains above the 1.1080 support level.
Gold Price Technical Analysis
Gold prices started a fresh increase above the $2,580 level against the US Dollar. The price cleared many hurdles near $2,600 to extend its rally.
The 4-hour chart of XAU/USD indicates that the price settled well above the 100 Simple Moving Average (red, 4 hours) and the 200 Simple Moving Average (green, 4 hours). It gained steadily after the Fed rate cut and traded to a new all-time high above $2,660.
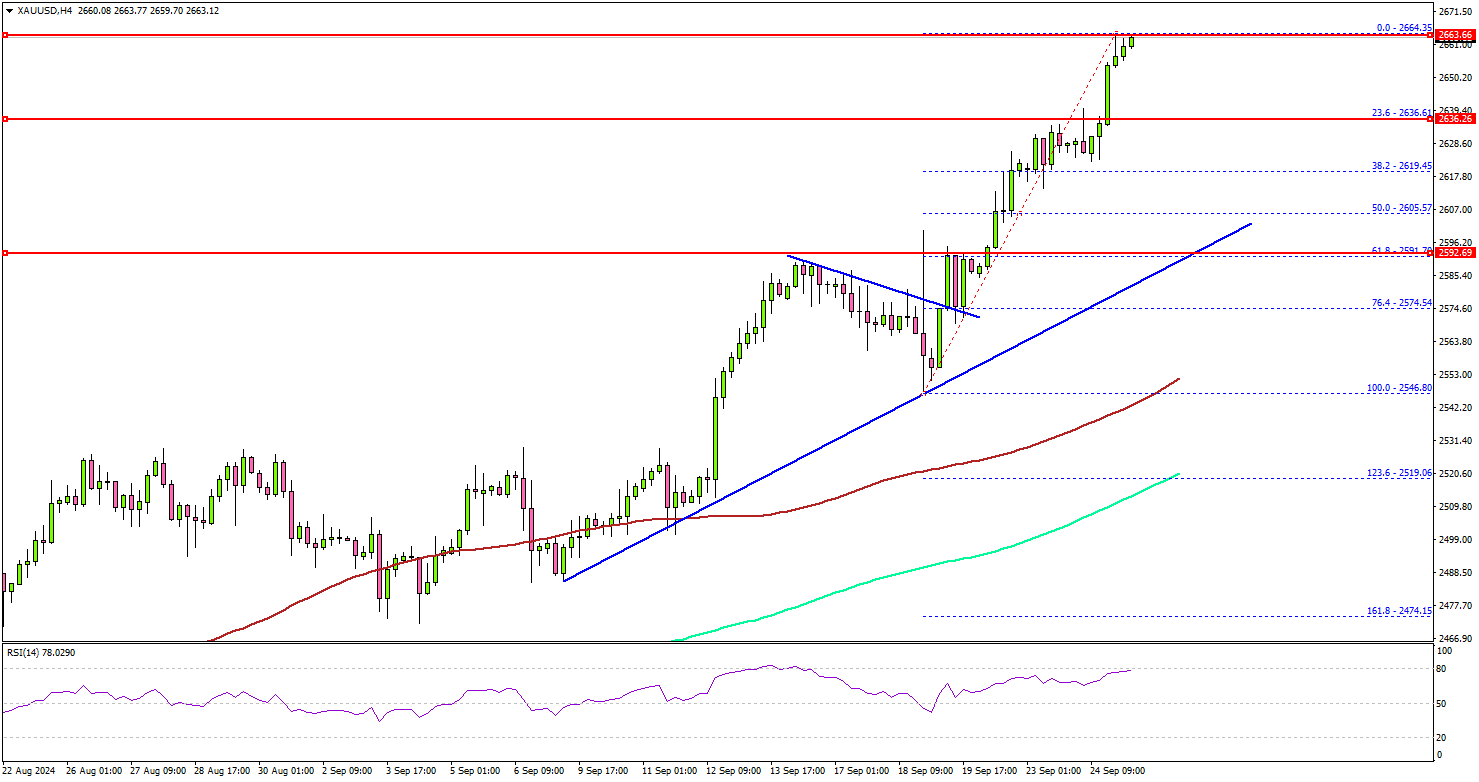
On the upside, immediate resistance is near the $2,665 level. The first major resistance sits near the $2,680 level. A clear move above the $2,680 resistance could open the doors for more upsides. The next major resistance could be near $2,700, above which the price could rally toward the $2,750 level.
On the downside, initial support is near the $2,635 level. The first major support is near the $2,605 level. The main support is now near $2,590. There is also a major bullish trend line forming with support at $2,590 on the same chart.
A downside break below the $2,590 support might call for more downsides. The next major support is near the $2,550 level and the 100 Simple Moving Average (red, 4 hours).
Looking at Oil, the price started a recovery wave above the $70.00 level, but it might struggle to settle above the $73.50 resistance.
Economic Releases to Watch Today
- US New Home Sales for August 2024 (MoM) – Forecast +5.8% versus +10.6% previous.
Australia’s monthly CPI falls to 2.7%, lowest since 2021
Australia's monthly CPI slowed from 3.5% yoy to 2.7% yoy in August, marking the lowest reading since August 2021. Core inflation measures also eased, with CPI excluding volatile items and holiday travel declining to 3.0% yoy from 3.7% yoy, and the annual trimmed mean falling to 3.4% yoy from 3.8% yoy. Both underlying inflation indicators are now at their lowest levels in two and a half years.
Significant price increases were observed in Housing (+2.6%), Food and non-alcoholic beverages (+3.4%), and Alcohol and tobacco (+6.6%). These gains were "partly offset" by a -1.1% decrease in Transport costs.
Notably, electricity prices plummeted by -17.9% over the 12 months to August—the largest annual fall since the early 1980s—driven by Commonwealth and State Government rebates that led to a -14.6% drop in August following a -6.4% decline in July. Excluding these rebates, electricity prices would have risen 0.1% in August and 0.9% in July.

BoC’s Macklem signals more rate cuts as inflation progress continue
BoC Governor Tiff Macklem, in a speech overnight, suggested that more interest rate cuts are likely, contingent on incoming economic data. He acknowledged, "With the continued progress we've seen on inflation, it is reasonable to expect further cuts in our policy rate."
However, he emphasized that the timing and pace of such cuts would be determined by the assessment of future inflation and broader economic conditions.
Macklem noted that economic growth had picked up in H1, but some recent indicators suggest it may not be as robust as previously anticipated. "We will be closely watching consumer spending, as well as business hiring and investment," he said.
He also expressed the need to see core inflation ease further. Shelter cost inflation remains elevated but is beginning to decline, and BoC is looking for this trend to continue. "Continued progress on inflation will be crucial to ensure our policy remains effective," Macklem added.
ECB’s Knot: Likely to continue rate cuts into H1 2025
In an interview on Dutch television overnight, ECB Governing Council member Klaas Knot emphasized that interest rates across Europe are poised for continued gradual reductions. Knot affirmed that as ECB gains confidence in achieving its 2% inflation target, "interest rates will simply keep falling."
Looking ahead, "I would expect us to continue to gradually reduce interest rates in the coming time, also in the first half of 2025," Knot added.
However, he cautioned against expectations of a return to the ultra-low rates seen before the pandemic. Instead, he suggested that rates are likely to settle at a "more natural level" within a range starting with a 2.
Gold (XAU/USD) Prices Underpinned by Geopolitics, China Stimulus and ETF Flows, $2650 Up Next
- Gold prices advance, underpinned by ETF Flows, China stimulus and safe haven flows,
- Gold ETF flows have been positive, and if this trend continues, it could further support the upward momentum of gold prices.
- From a technical analysis perspective, gold is in overbought territory, but this may not be a significant obstacle. The psychological $2,650 and $2675 handles are the next key resistance levels to watch.
Gold prices continue to hold the high ground, underpinned by heightened tension in the Middle East and stimulus from China. The precious metal is enjoying its best year in 14 as a host of challenges and concerns plague market participants.
Gold continues to print fresh highs as geopolitical headwinds continue to sway back and forth. Earlier today we had a stimulus package announcement by the People’s Bank of China (PBoC) which has further aided the precious metal. As big as the stimulus package from China is, I do not believe it will hold a major sway on Gold prices but rather other metals in the sector.
Ongoing dovish comments from Federal Reserve officials only serve to add fuel to a fire which is already raging. Some policymakers have hinted at more aggressive cuts ahead which have underpinned gold prices to a degree overnight. The question regarding a lot of these events is how much of the premium is yet to be priced in given the current nature of the market.
As things stand, markets are pricing in another 50 bps cut from the Federal reserve at the November meeting.
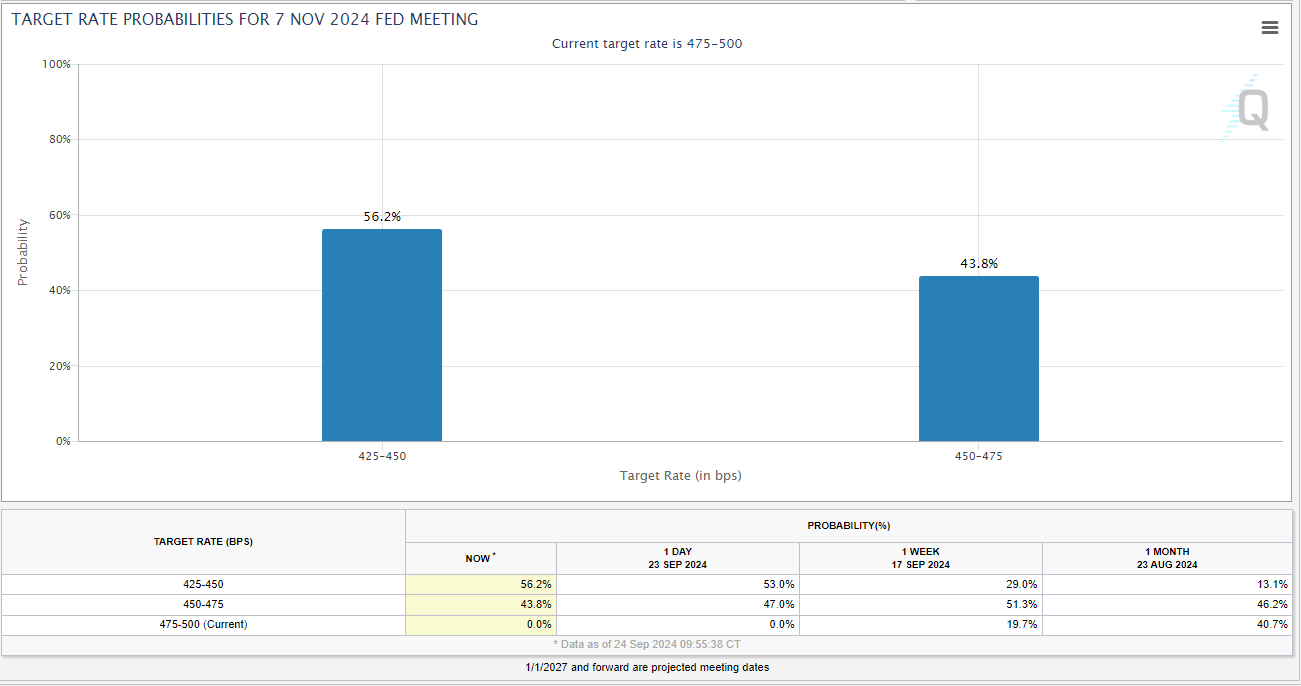
Source: CME FedWatch Tool
Gold ETF Flows Hint at Further Support
ETF flows remain positive following a huge spike in July to 47.7 tonnes. August came in more modest at around 28.5 tonnes the equivalent to $2.1 USD. North America led the way with the Western markets more active at present.
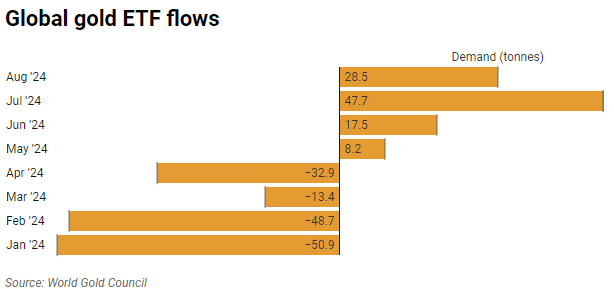
Source: LSEG, World Gold Council
Despite the excellent inflows over the last four months the year-to-date losses remain around 44 metric tonnes. The idea is that if these inflows continue however, this could keep the gold rally moving in the upward direction. Economists and analysts continue to upgrade their yearly forecasts.
JP Morgan for its part stressed that the retail-focused ETF builds will be key for a sustainable gold rally, raising its price target for the precious metal to $2850/oz in 2025.
Economic Data
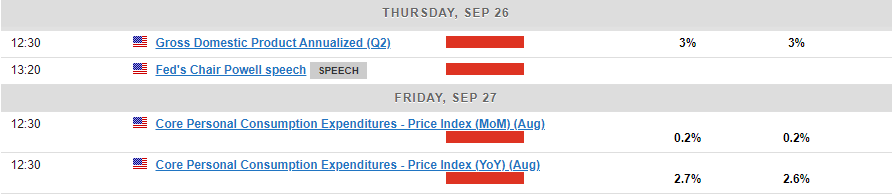
On the economic data front, we do have some high impact US data which could impact the US Dollar and thus gold prices. However, it would require the Core PCE data print to be extremely hot on Friday to see any lasting impact on the rate cut expectations from the Fed.
Despite comments from Fed policymaker Bowman today intimating that inflation risks remain this is a long shot and any uptick in inflation may just be a temporary reprieve for Gold prices on its march higher.
Technical Analysis Gold (XAU/USD)
From a technical analysis standpoint, Gold is tough to read at the minute particularly where areas of resistance is concerned. As we continue to print fresh all time highs it makes it difficult due to the lack of historical price data to analyze.
To put things into perspective, the RSI on the daily, weekly and monthly timeframe are all in overbought territory. However, as we know an instrument can languish weeks and sometimes months in overbought territory on the larger timeframes so this seems to be irrelevant at present.
The psychological 2650 mark is the most immediate area i would keep an eye on as we may see a reaction or profit taking at this area. Market participants love whole numbers and when it comes to gold the ’50 and 75′ levels are always key.
Looking at support and the 2625 area has been key over the last two days serving as a base fro gold on the smaller timeframes as the precious metal advance toward the 2650 handle. This may be a level worth monitoring moving forward.
GOLD One-Hour (H1) Chart, September 24, 2024
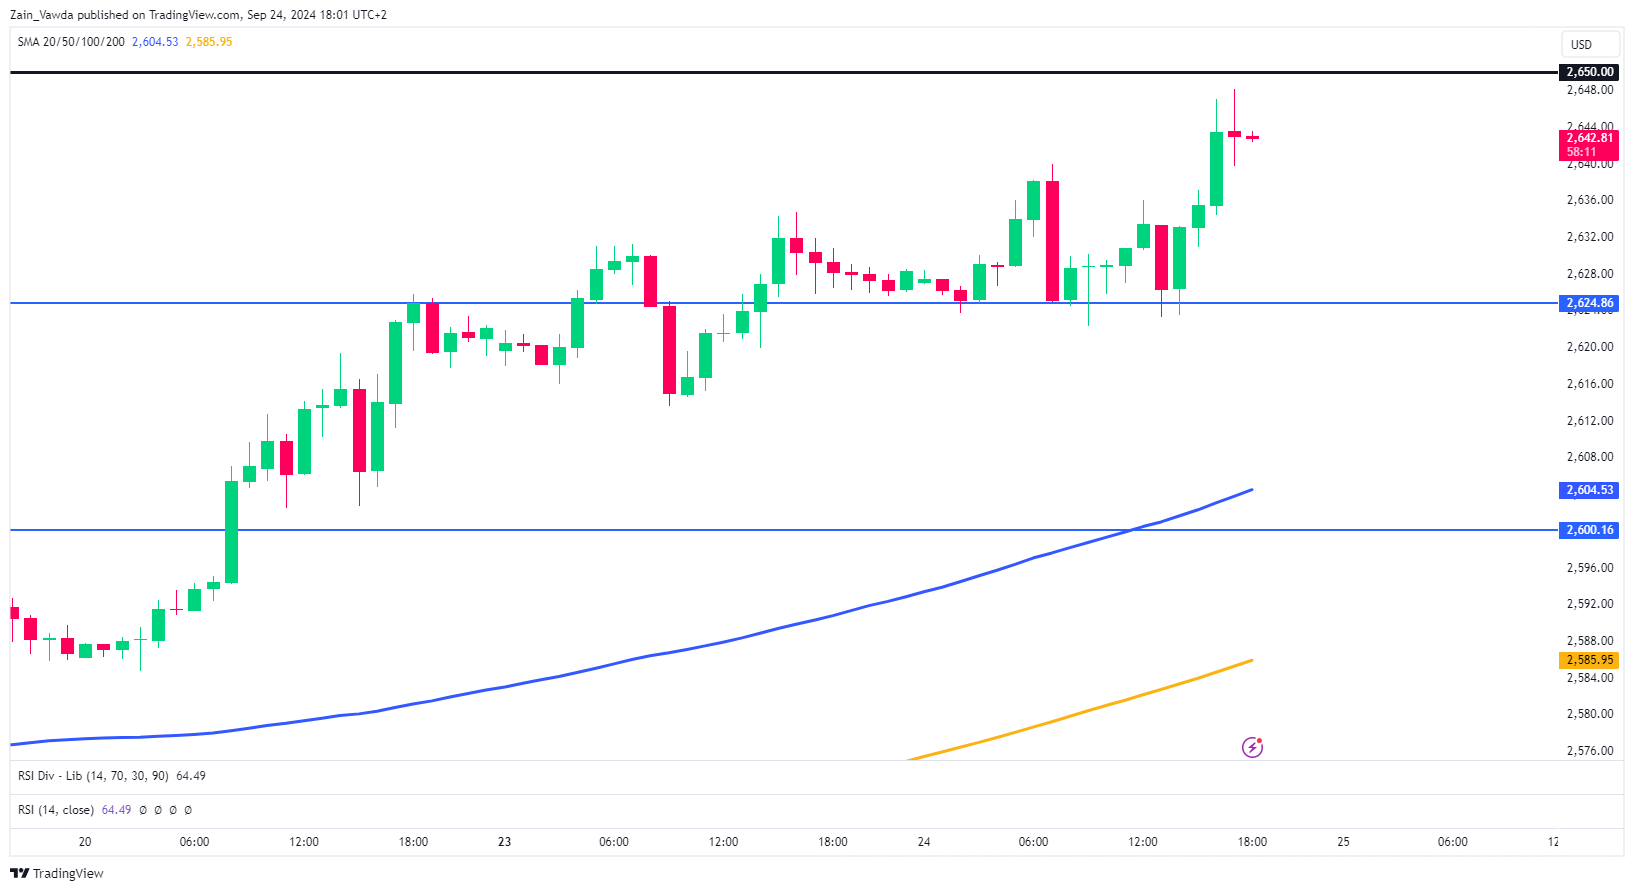
Source: TradingView (click to enlarge)
Support
- 2625
- 2600
- 2587
Resistance
- 2650
- 2675
- 2700
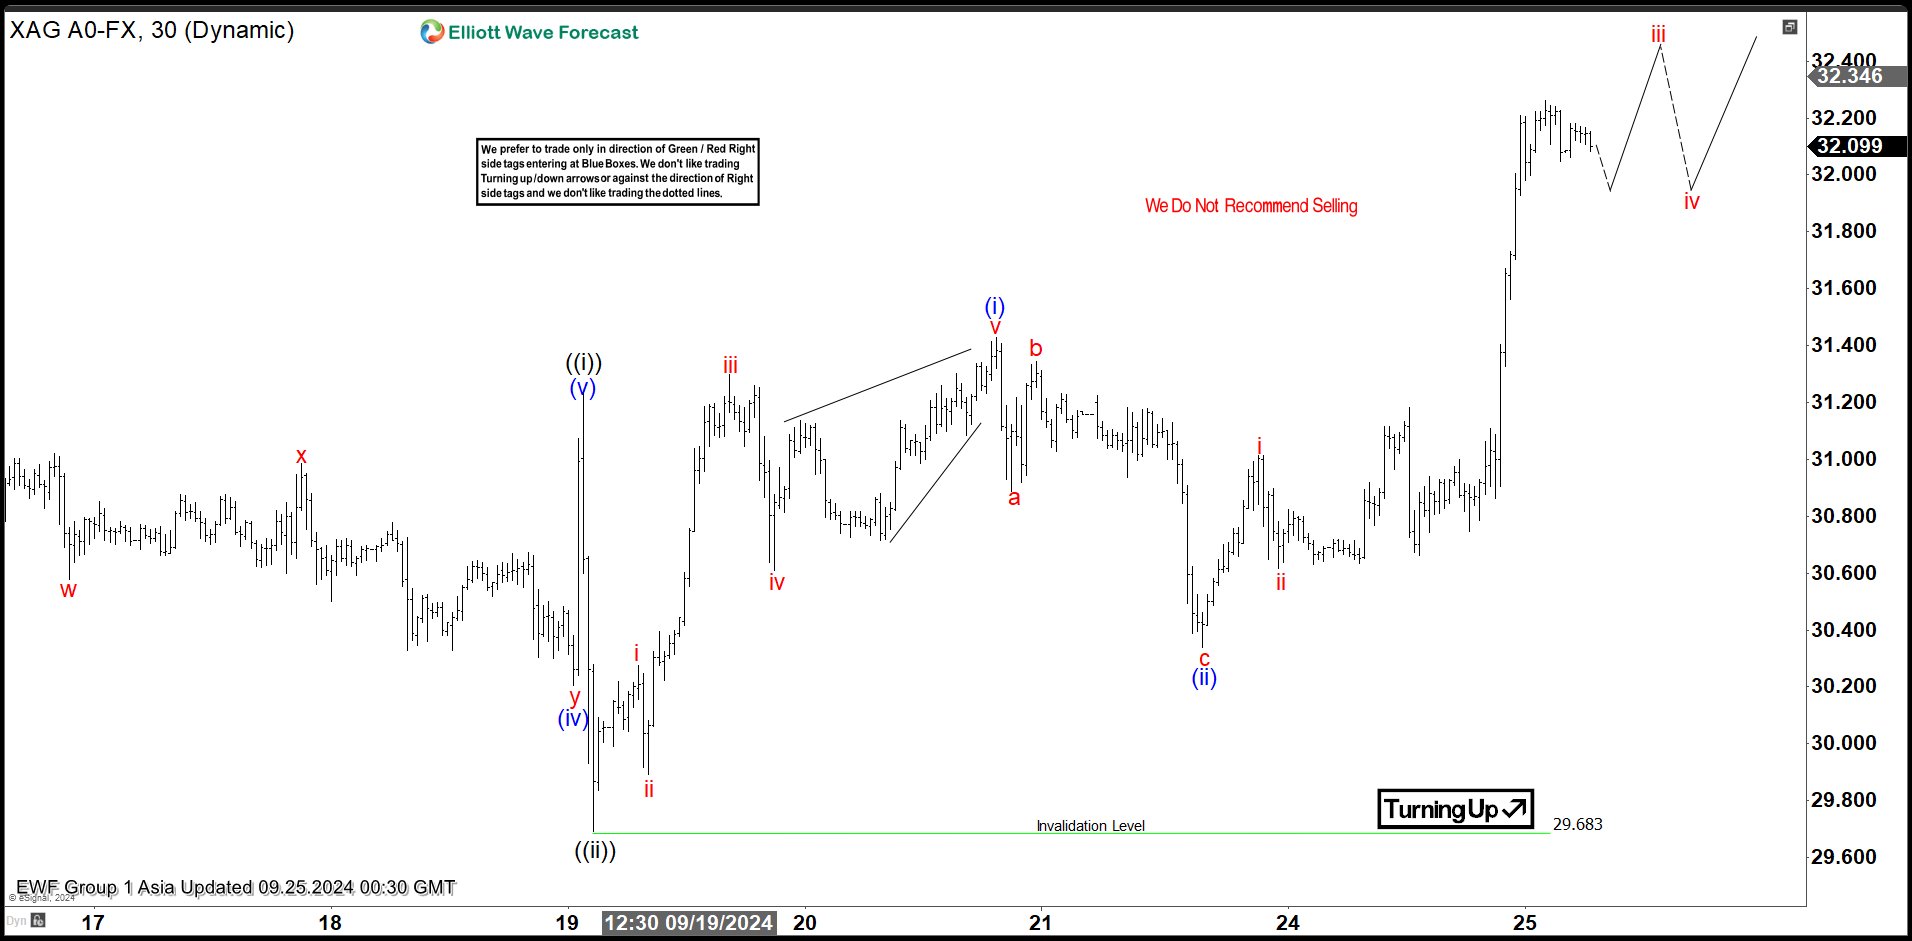
Elliott Wave Expects Silver (XAGUSD) to Continue Bullish move
Silver (XAGUSD) is close to breaking above previous peak on 5.20.2024 high at 32.51. A break above the level confirms the next leg higher has resumed. Short term, rally from 9.9.2024 low is in progress as a 5 waves impulse Elliott Wave structure. Up from 9.9.2024 low, wave ((i)) ended at 31.23 and pullback in wave ((ii)) ended at 29.68. The metal has resumed higher in wave ((iii)). Up from wave ((ii)), wave i ended at 30.27 and pullback in wave ii ended at 29.89. The metal extended higher in wave iii towards 31.29 and wave iv pullback ended at 30.60. Final wave v higher ended at 31.43 which completed wave (i) in higher degree.
Pullback in wave (ii) ended at 30.34 with internal subdivision as a zigzag structure. Down from wave (i), wave a ended at 30.88 and wave b rally ended at 31.34. The metal then extended lower in wave c towards 30.34 which completed wave (ii) in higher degree. The metal has turned higher again in wave (iii). Up from wave (ii), wave i ended at 31.01 and wave ii pullback ended at 30.61. Expect wave iii to end soon, then it should pullback in wave iv to correct cycle from 9.23.2024 low in 3, 7, 11 swing before it resumes higher again. Near term, as far as pivot at 29.68 low stays intact, expect dips to find support in 3, 7, 11 swing for further upside.
Silver 30 Minutes Elliott Wave Chart
Silver (XAGUSD) Elliott Wave Video
https://www.youtube.com/watch?v=JKFR6066o_Y