
Sample Category Title
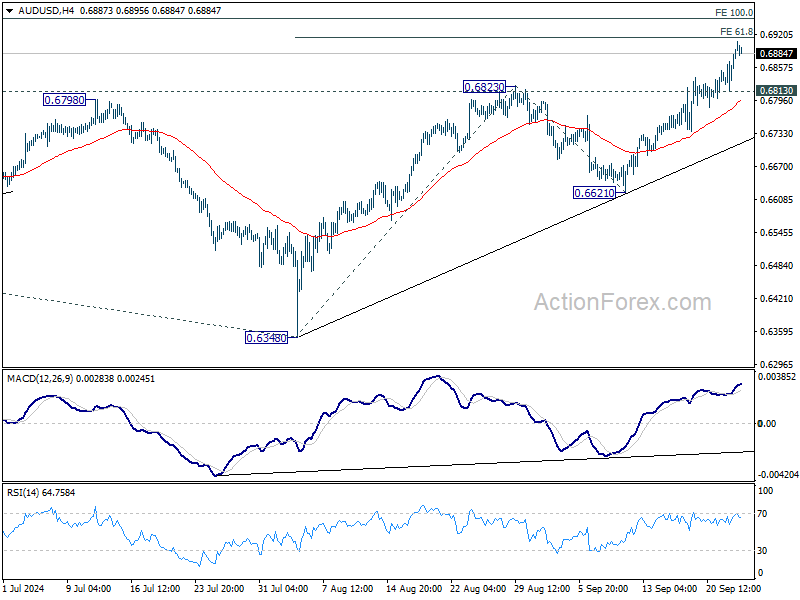
AUD/USD Daily Report
Daily Pivots: (S1) 0.6840; (P) 0.6866; (R1) 0.6919; More...
Intraday bias in AUD/USD remains on upside at this point. Firm break of 61.8% projection of 0.6348 to 0.6823 from 0.6621 at 0.6915 will pave the way to 100% projection at 0.7096 next. On the downside, below 0.6813 minor support will turn bias neutral and bring consolidations first. But outlook will remain cautiously bullish as long as 0.6621 support holds, in case of retreat.
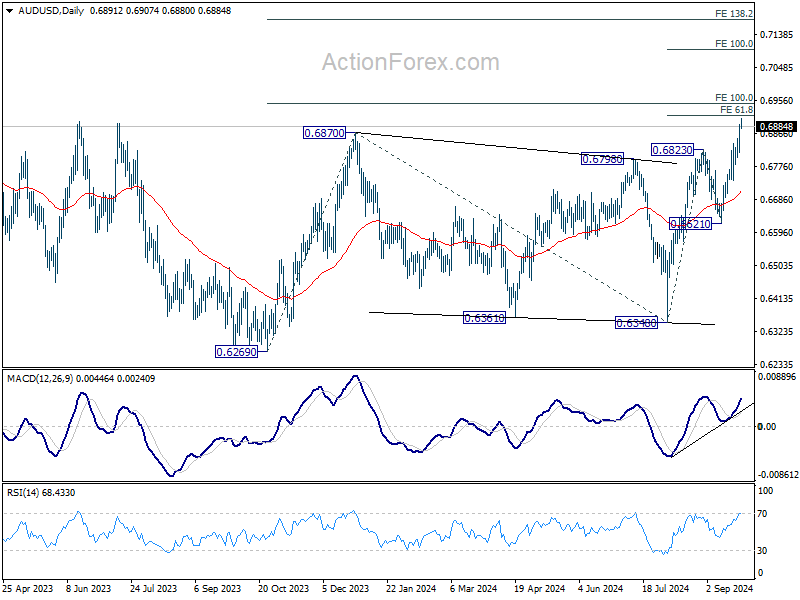
In the bigger picture, overall, price actions from 0.6169 (2022 low) are seen as a medium term corrective pattern, with rise from 0.6269 as the third leg. Firm break of 0.6870 resistance will target 100% projection of 0.6269 to 0.6870 from 0.6340 at 0.6941, and then 138.2% projection at 0.7179. This will now remain the favored case as long as 0.6621 support holds.
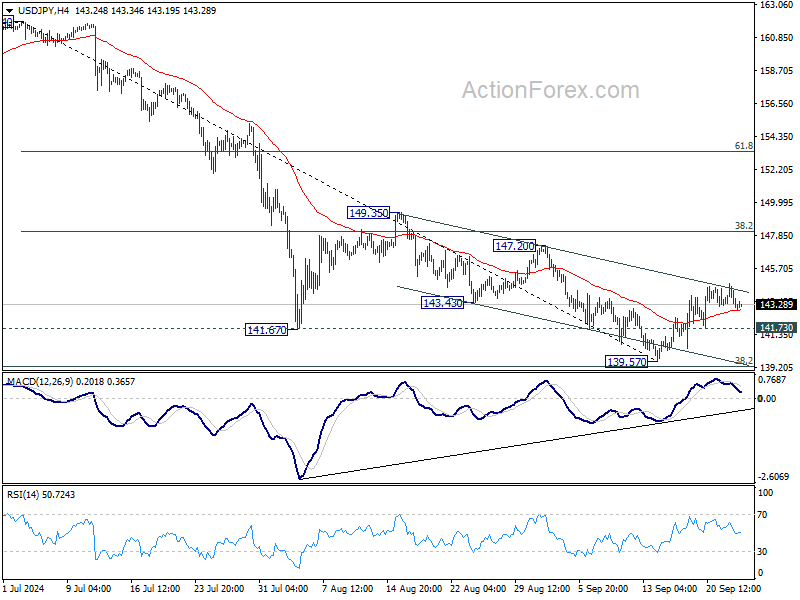
USD/JPY Daily Outlook
Daily Pivots: (S1) 142.67; (P) 143.67; (R1) 144.23; More...
Further rally remains in favor in USD/JPY with 141.73 minor support intact, despite loss of upside momentum as seen in 4H MACD. Rebound from 139.57 short term bottom should extend to 38.2% retracement of 161.94 to 139.57 at 148.11. On the downside, below 141.73 will turn bias to the downside for retesting 139.57 instead.
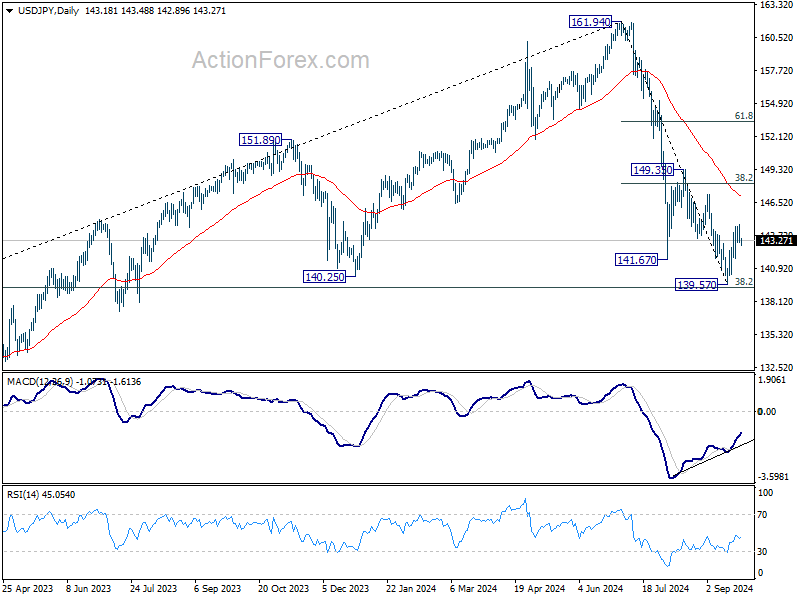
In the bigger picture, fall from 161.94 medium term top is seen as correcting whole up trend from 102.58 (2021 low). Strong support could be seen from 38.2% retracement of 102.58 to 161.94 at 139.26 to contain downside, at least on first attempt. But in any case, risk will stay on the downside as long as 149.35 resistance holds. Sustained break of 139.26 would open up deeper medium term decline to 61.8% retracement at 125.25.
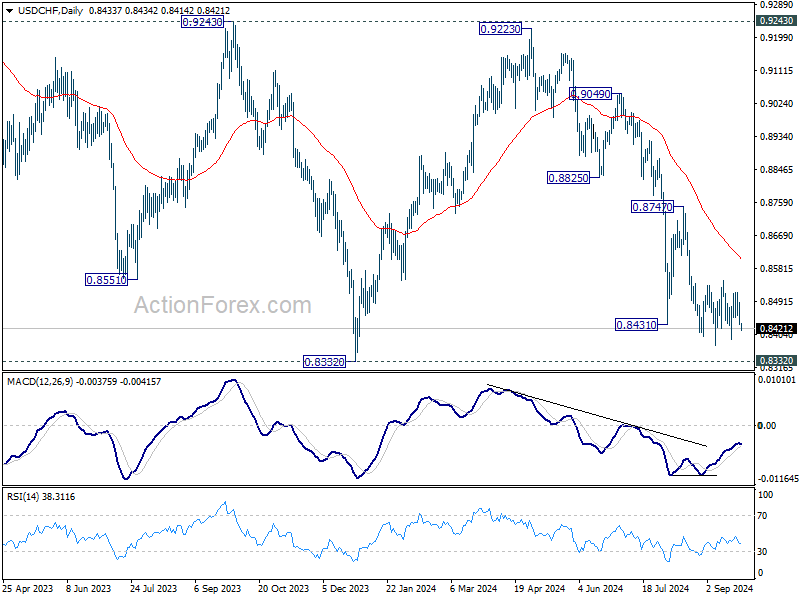
USD/CHF Daily Outlook
Daily Pivots: (S1) 0.8413; (P) 0.8452; (R1) 0.8472; More…
No change in USD/CHF's outlook as range trading continues. Intraday bias stays neutral for the moment. On the downside, break of 0.8374 will resume the fall from 0.9223 to retest 0.8332 low. Decisive break there will indicate larger down trend resumption. However, break of 0.8548 resistance will confirm short term bottoming, and turn bias back to the upside for 0.8747 resistance.
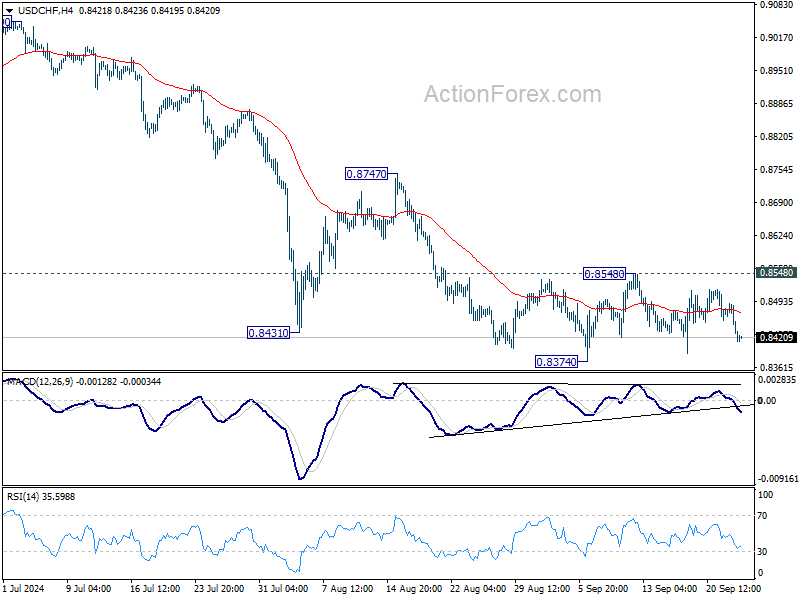
In the bigger picture, price actions from 0.8332 (2023 low) are currently seen as a medium term corrective pattern, with fall from 0.9223 as the second leg. Strong support could be seen from 0.8332 to bring rebound. Yet, overall outlook will continue to stay bearish as long as 0.9243 resistance holds. Firm break of 0.8332, however, will resume larger down trend from 1.0146 (2022 high).
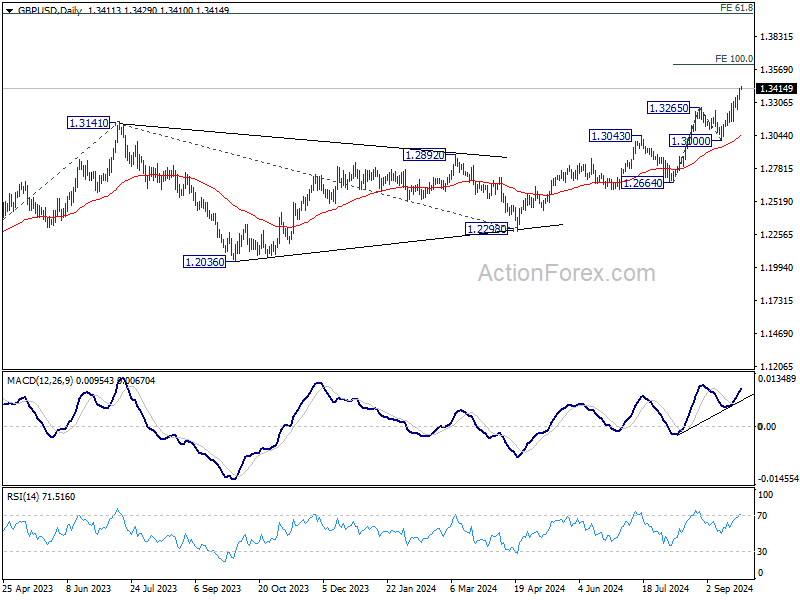
GBP/USD Daily Outlook
Daily Pivots: (S1) 1.3358; (P) 1.3387; (R1) 1.3442; More...
GBP/USD's rally continues today and hit as high as 1.3429 so far. Intraday bias stays on the upside for 100% projection of 1.2664 to 1.3265 from 1.3000 at 1.3601 next. On the downside, below 1.3331 minor support will turn intraday bias neutral and bring consolidations first, before staging another rally.
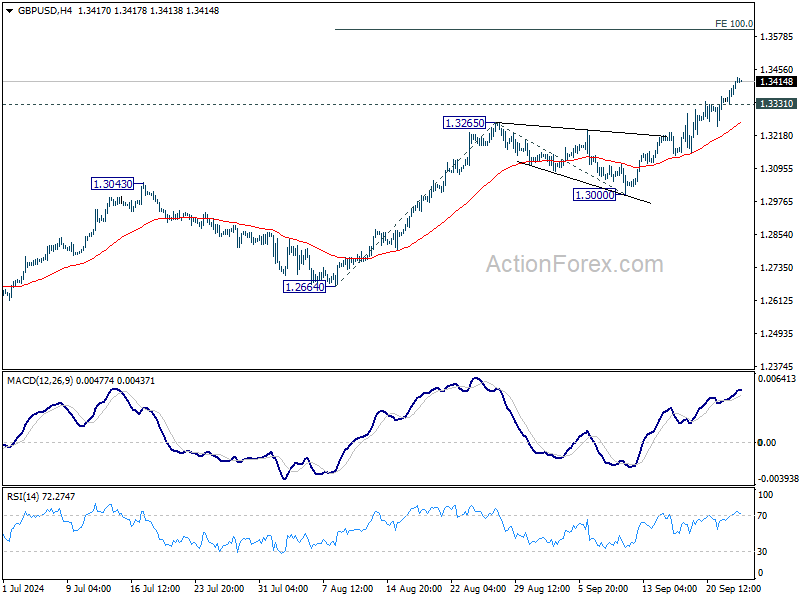
In the bigger picture, up trend from 1.0351 (2022 low) is in progress. Next target is 61.8% projection of 1.0351 to 1.3141 from 1.2298 at 1.4022. For now, outlook will stay bullish as long as 1.3000 support holds, even in case of deep pullback.
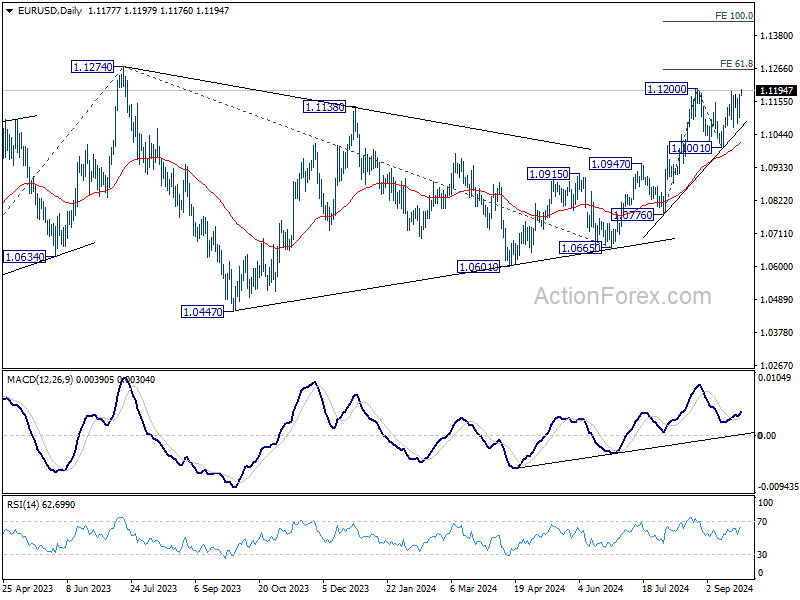
EUR/USD Daily Outlook
Daily Pivots: (S1) 1.1128; (P) 1.1155; (R1) 1.1206; More....
Immediate focus is now on 1.1200 resistance as EUR/USD's rebound from 1.1001 extends today. Break there will resume the rally from 1.0665 to retest 1.1274 high. Firm break there will resume larger up trend. Next near term target will be 100% projection of 1.0776 to 1.1200 from 1.1001 at 1.1425. Rejection by 1.1200 will bring another retreat. But outlook will continue to stay bullish as long as 1.1001 support holds.
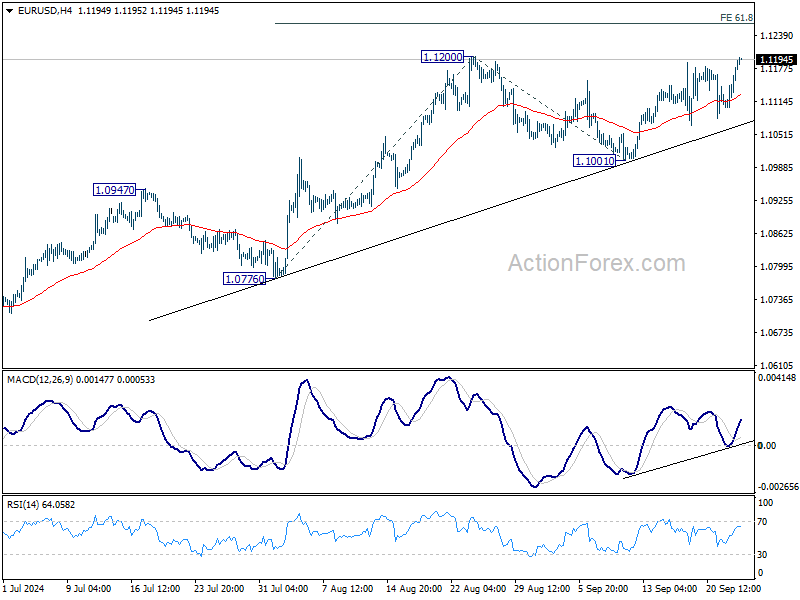
In the bigger picture, prior break of 1.1138 resistance indicates that corrective pattern from 1.1274 might have completed at 1.0665 already. Decisive break of 1.1274 (2023 high) will confirm resumption of whole up trend from 0.9534 (2022 low). Next target will be 61.8% projection of 0.9534 to 1.1274 from 1.0665 at 1.1740. This will now be the favored case as long as 1.0947 resistance turned support holds.
Dollar Slumps as Euro Eyes August High, Hong Kong Markets Approach Crucial Resistance
Dollar continued its broad-based weakness in Asian session, with selling pressure shifting towards European majors. EUR/USD is approaching its August high as the near-term rebound gathers momentum. This decline in the Dollar is partly attributed to weaker-than-expected US consumer confidence data released overnight, which has intensified market expectations of consecutive 50bps rate cuts by Fed in November.
On the European front, speculation about another 25bps rate cut by ECB in October has been tempered by recent comments from policymakers. It appears that ECB officials are still viewing December as a more suitable time for further monetary adjustments, given that more comprehensive economic data will be available by then.
So far this week, Dollar is the worst-performing major currency, followed by Euro and Japanese Yen. Kiwi leads gains, buoyed by positive risk sentiment, followed by Aussie and Loonie. Sterling and Swiss Franc are trading in the middle range, with attention on Swiss Franc ahead of tomorrow's SNB rate decision.
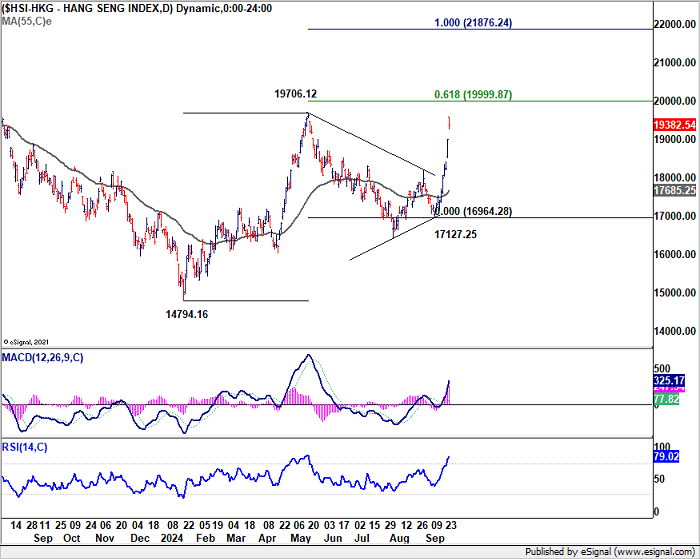
Meanwhile, risk-on sentiment continues to dominate Hong Kong and China markets, as supported by yesterday's stimulus announcement by PBoC. Hong Kong HSI is now eyeing an important medium term resistance level at around 20000 psychological level, with 61.8% projection of 14794.16 to 19706.12 from 17127.25 at 19999.87. Decisive break of this level would confirm that it's already in a medium term up trend and target 100% projection at 21876.24. That, if realized, would be supportive to Aussie and Kiwi.
In Asia, at the time of writing, Nikkei is up 0.13%. Hong Kong HSI is up 2.01%. China Shanghai SSE is up 1.73%. Singapore Strait Times is down -0.64%. Japan 10-year JGB yield is up 0.005 at 0.816. Overnight, DOW rose 0.20%. S&P 500 rose 0.25%. NASDAQ rose 0.56%. 10-year yield fell -0.003 to 3.736.
Australia's monthly CPI falls to 2.7%, lowest since 2021
Australia's monthly CPI slowed from 3.5% yoy to 2.7% yoy in August, marking the lowest reading since August 2021. Core inflation measures also eased, with CPI excluding volatile items and holiday travel declining to 3.0% yoy from 3.7% yoy, and the annual trimmed mean falling to 3.4% yoy from 3.8% yoy. Both underlying inflation indicators are now at their lowest levels in two and a half years.
Significant price increases were observed in Housing (+2.6%), Food and non-alcoholic beverages (+3.4%), and Alcohol and tobacco (+6.6%). These gains were "partly offset" by a -1.1% decrease in Transport costs.
Notably, electricity prices plummeted by -17.9% over the 12 months to August—the largest annual fall since the early 1980s—driven by Commonwealth and State Government rebates that led to a -14.6% drop in August following a -6.4% decline in July. Excluding these rebates, electricity prices would have risen 0.1% in August and 0.9% in July.
BoC's Macklem signals more rate cuts as inflation progress continue
BoC Governor Tiff Macklem, in a speech overnight, suggested that more interest rate cuts are likely, contingent on incoming economic data. He acknowledged, "With the continued progress we've seen on inflation, it is reasonable to expect further cuts in our policy rate."
However, he emphasized that the timing and pace of such cuts would be determined by the assessment of future inflation and broader economic conditions.
Macklem noted that economic growth had picked up in H1, but some recent indicators suggest it may not be as robust as previously anticipated. "We will be closely watching consumer spending, as well as business hiring and investment," he said.
He also expressed the need to see core inflation ease further. Shelter cost inflation remains elevated but is beginning to decline, and BoC is looking for this trend to continue. "Continued progress on inflation will be crucial to ensure our policy remains effective," Macklem added.
ECB's Knot: Likely to continue rate cuts into H1 2025
In an interview on Dutch television overnight, ECB Governing Council member Klaas Knot emphasized that interest rates across Europe are poised for continued gradual reductions. Knot affirmed that as ECB gains confidence in achieving its 2% inflation target, "interest rates will simply keep falling."
Looking ahead, "I would expect us to continue to gradually reduce interest rates in the coming time, also in the first half of 2025," Knot added.
However, he cautioned against expectations of a return to the ultra-low rates seen before the pandemic. Instead, he suggested that rates are likely to settle at a "more natural level" within a range starting with a 2.
EUR/USD Daily Outlook
Daily Pivots: (S1) 1.1128; (P) 1.1155; (R1) 1.1206; More....
Immediate focus is now on 1.1200 resistance as EUR/USD's rebound from 1.1001 extends today. Break there will resume the rally from 1.0665 to retest 1.1274 high. Firm break there will resume larger up trend. Next near term target will be 100% projection of 1.0776 to 1.1200 from 1.1001 at 1.1425. Rejection by 1.1200 will bring another retreat. But outlook will continue to stay bullish as long as 1.1001 support holds.
In the bigger picture, prior break of 1.1138 resistance indicates that corrective pattern from 1.1274 might have completed at 1.0665 already. Decisive break of 1.1274 (2023 high) will confirm resumption of whole up trend from 0.9534 (2022 low). Next target will be 61.8% projection of 0.9534 to 1.1274 from 1.0665 at 1.1740. This will now be the favored case as long as 1.0947 resistance turned support holds.
Economic Indicators Update
| GMT | CCY | EVENTS | ACT | F/C | PP | REV |
|---|---|---|---|---|---|---|
| 23:50 | JPY | Corporate Service Price Index Y/Y Aug | 2.70% | 2.70% | 2.80% | 2.70% |
| 01:30 | AUD | Monthly CPI Y/Y Aug | 2.70% | 2.70% | 3.50% | |
| 08:00 | CHF | UBS Economic Expectations Sep | -3.4 | |||
| 14:00 | USD | New Home Sales Aug | 693K | 739K | ||
| 14:30 | USD | Crude Oil Inventories | -1.3M | -1.6M |
Gold Surges to New Peak: Is $2,750 The Next Milestone?
Key Highlights
- Gold rallied to a new all-time high above the $2,660 level.
- A major bullish trend line is forming with support at $2,590 on the 4-hour chart.
- Oil prices might struggle to settle above the $73.50 resistance zone.
- EUR/USD is consolidating gains above the 1.1080 support level.
Gold Price Technical Analysis
Gold prices started a fresh increase above the $2,580 level against the US Dollar. The price cleared many hurdles near $2,600 to extend its rally.
The 4-hour chart of XAU/USD indicates that the price settled well above the 100 Simple Moving Average (red, 4 hours) and the 200 Simple Moving Average (green, 4 hours). It gained steadily after the Fed rate cut and traded to a new all-time high above $2,660.
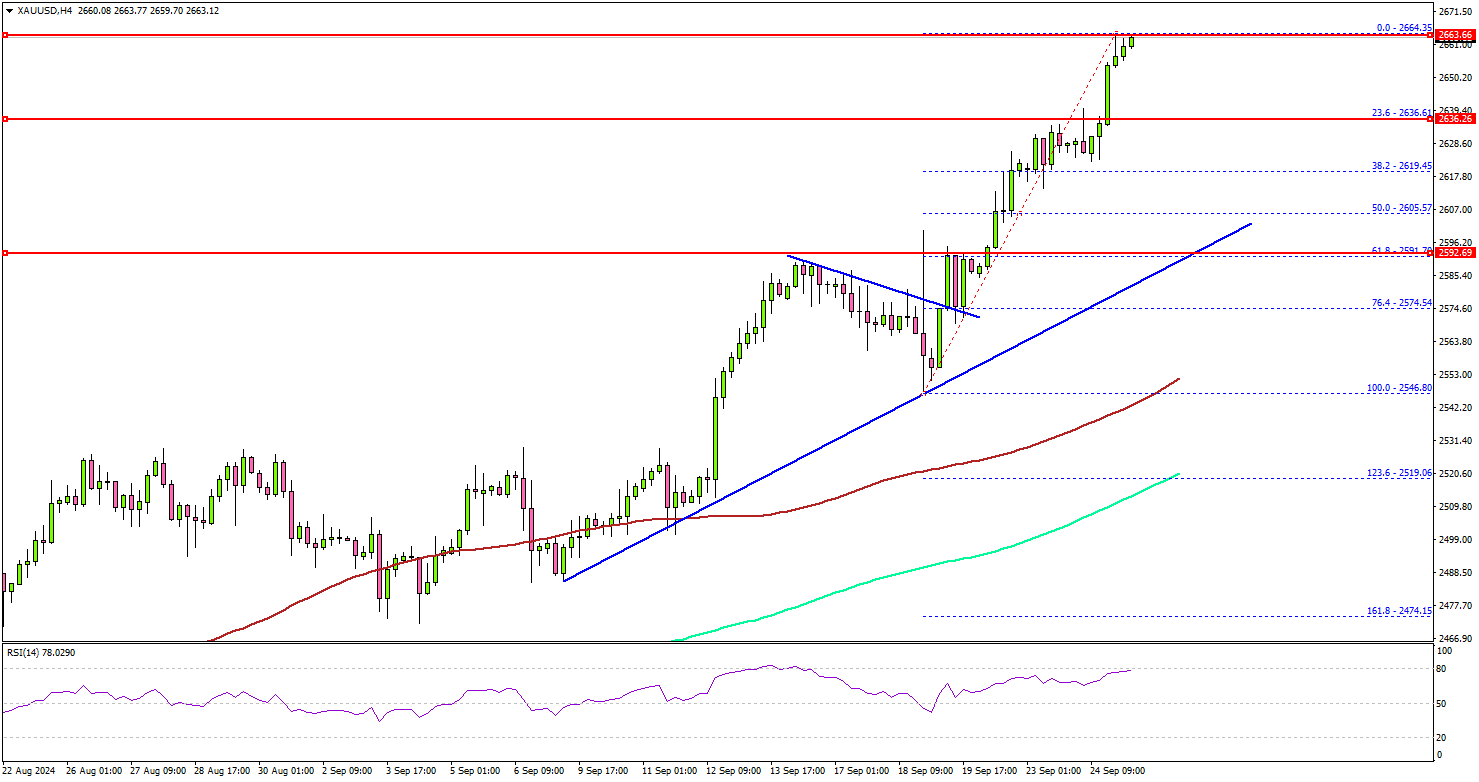
On the upside, immediate resistance is near the $2,665 level. The first major resistance sits near the $2,680 level. A clear move above the $2,680 resistance could open the doors for more upsides. The next major resistance could be near $2,700, above which the price could rally toward the $2,750 level.
On the downside, initial support is near the $2,635 level. The first major support is near the $2,605 level. The main support is now near $2,590. There is also a major bullish trend line forming with support at $2,590 on the same chart.
A downside break below the $2,590 support might call for more downsides. The next major support is near the $2,550 level and the 100 Simple Moving Average (red, 4 hours).
Looking at Oil, the price started a recovery wave above the $70.00 level, but it might struggle to settle above the $73.50 resistance.
Economic Releases to Watch Today
- US New Home Sales for August 2024 (MoM) – Forecast +5.8% versus +10.6% previous.
Australia’s monthly CPI falls to 2.7%, lowest since 2021
Australia's monthly CPI slowed from 3.5% yoy to 2.7% yoy in August, marking the lowest reading since August 2021. Core inflation measures also eased, with CPI excluding volatile items and holiday travel declining to 3.0% yoy from 3.7% yoy, and the annual trimmed mean falling to 3.4% yoy from 3.8% yoy. Both underlying inflation indicators are now at their lowest levels in two and a half years.
Significant price increases were observed in Housing (+2.6%), Food and non-alcoholic beverages (+3.4%), and Alcohol and tobacco (+6.6%). These gains were "partly offset" by a -1.1% decrease in Transport costs.
Notably, electricity prices plummeted by -17.9% over the 12 months to August—the largest annual fall since the early 1980s—driven by Commonwealth and State Government rebates that led to a -14.6% drop in August following a -6.4% decline in July. Excluding these rebates, electricity prices would have risen 0.1% in August and 0.9% in July.

BoC’s Macklem signals more rate cuts as inflation progress continue
BoC Governor Tiff Macklem, in a speech overnight, suggested that more interest rate cuts are likely, contingent on incoming economic data. He acknowledged, "With the continued progress we've seen on inflation, it is reasonable to expect further cuts in our policy rate."
However, he emphasized that the timing and pace of such cuts would be determined by the assessment of future inflation and broader economic conditions.
Macklem noted that economic growth had picked up in H1, but some recent indicators suggest it may not be as robust as previously anticipated. "We will be closely watching consumer spending, as well as business hiring and investment," he said.
He also expressed the need to see core inflation ease further. Shelter cost inflation remains elevated but is beginning to decline, and BoC is looking for this trend to continue. "Continued progress on inflation will be crucial to ensure our policy remains effective," Macklem added.
ECB’s Knot: Likely to continue rate cuts into H1 2025
In an interview on Dutch television overnight, ECB Governing Council member Klaas Knot emphasized that interest rates across Europe are poised for continued gradual reductions. Knot affirmed that as ECB gains confidence in achieving its 2% inflation target, "interest rates will simply keep falling."
Looking ahead, "I would expect us to continue to gradually reduce interest rates in the coming time, also in the first half of 2025," Knot added.
However, he cautioned against expectations of a return to the ultra-low rates seen before the pandemic. Instead, he suggested that rates are likely to settle at a "more natural level" within a range starting with a 2.