Sample Category Title
Gold (XAU/USD) Prices Underpinned by Geopolitics, China Stimulus and ETF Flows, $2650 Up Next
- Gold prices advance, underpinned by ETF Flows, China stimulus and safe haven flows,
- Gold ETF flows have been positive, and if this trend continues, it could further support the upward momentum of gold prices.
- From a technical analysis perspective, gold is in overbought territory, but this may not be a significant obstacle. The psychological $2,650 and $2675 handles are the next key resistance levels to watch.
Gold prices continue to hold the high ground, underpinned by heightened tension in the Middle East and stimulus from China. The precious metal is enjoying its best year in 14 as a host of challenges and concerns plague market participants.
Gold continues to print fresh highs as geopolitical headwinds continue to sway back and forth. Earlier today we had a stimulus package announcement by the People’s Bank of China (PBoC) which has further aided the precious metal. As big as the stimulus package from China is, I do not believe it will hold a major sway on Gold prices but rather other metals in the sector.
Ongoing dovish comments from Federal Reserve officials only serve to add fuel to a fire which is already raging. Some policymakers have hinted at more aggressive cuts ahead which have underpinned gold prices to a degree overnight. The question regarding a lot of these events is how much of the premium is yet to be priced in given the current nature of the market.
As things stand, markets are pricing in another 50 bps cut from the Federal reserve at the November meeting.
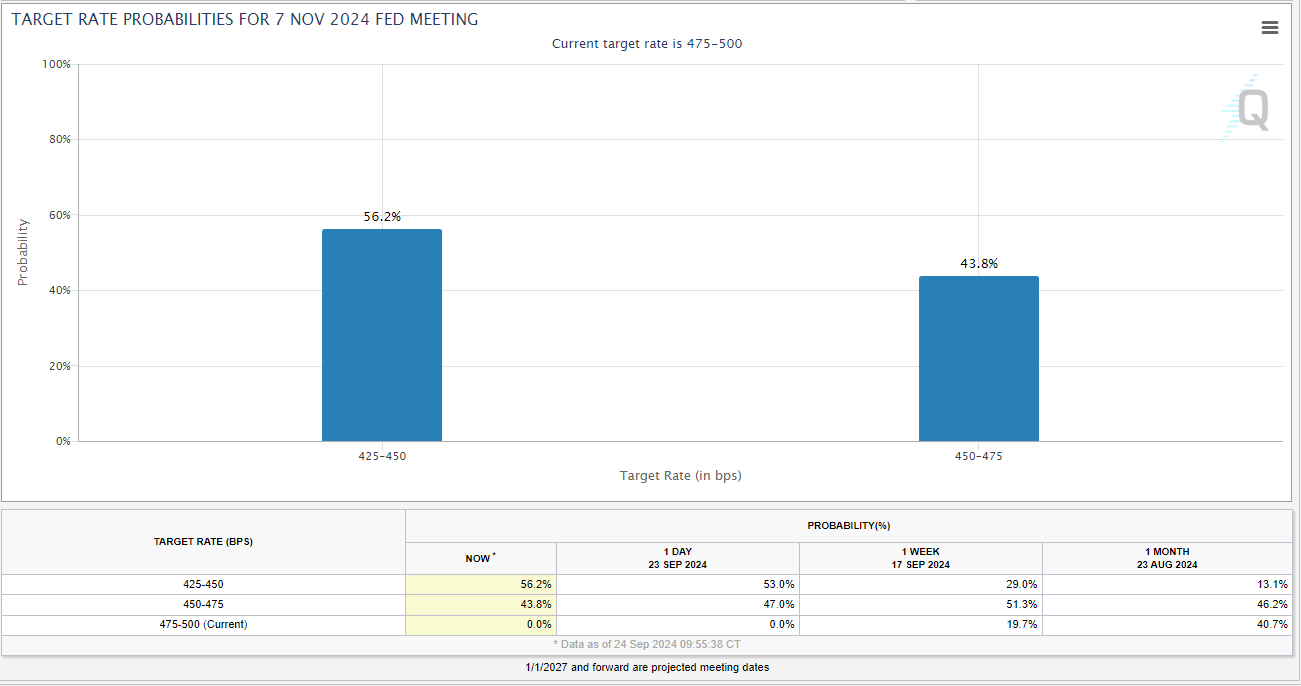
Source: CME FedWatch Tool
Gold ETF Flows Hint at Further Support
ETF flows remain positive following a huge spike in July to 47.7 tonnes. August came in more modest at around 28.5 tonnes the equivalent to $2.1 USD. North America led the way with the Western markets more active at present.
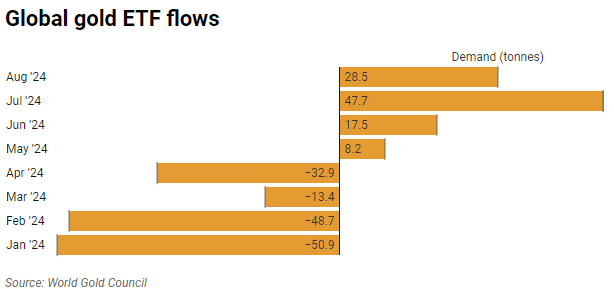
Source: LSEG, World Gold Council
Despite the excellent inflows over the last four months the year-to-date losses remain around 44 metric tonnes. The idea is that if these inflows continue however, this could keep the gold rally moving in the upward direction. Economists and analysts continue to upgrade their yearly forecasts.
JP Morgan for its part stressed that the retail-focused ETF builds will be key for a sustainable gold rally, raising its price target for the precious metal to $2850/oz in 2025.
Economic Data
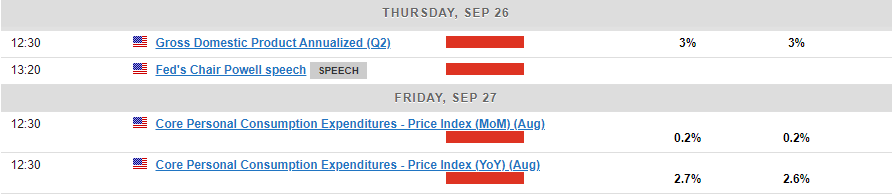
On the economic data front, we do have some high impact US data which could impact the US Dollar and thus gold prices. However, it would require the Core PCE data print to be extremely hot on Friday to see any lasting impact on the rate cut expectations from the Fed.
Despite comments from Fed policymaker Bowman today intimating that inflation risks remain this is a long shot and any uptick in inflation may just be a temporary reprieve for Gold prices on its march higher.
Technical Analysis Gold (XAU/USD)
From a technical analysis standpoint, Gold is tough to read at the minute particularly where areas of resistance is concerned. As we continue to print fresh all time highs it makes it difficult due to the lack of historical price data to analyze.
To put things into perspective, the RSI on the daily, weekly and monthly timeframe are all in overbought territory. However, as we know an instrument can languish weeks and sometimes months in overbought territory on the larger timeframes so this seems to be irrelevant at present.
The psychological 2650 mark is the most immediate area i would keep an eye on as we may see a reaction or profit taking at this area. Market participants love whole numbers and when it comes to gold the ’50 and 75′ levels are always key.
Looking at support and the 2625 area has been key over the last two days serving as a base fro gold on the smaller timeframes as the precious metal advance toward the 2650 handle. This may be a level worth monitoring moving forward.
GOLD One-Hour (H1) Chart, September 24, 2024
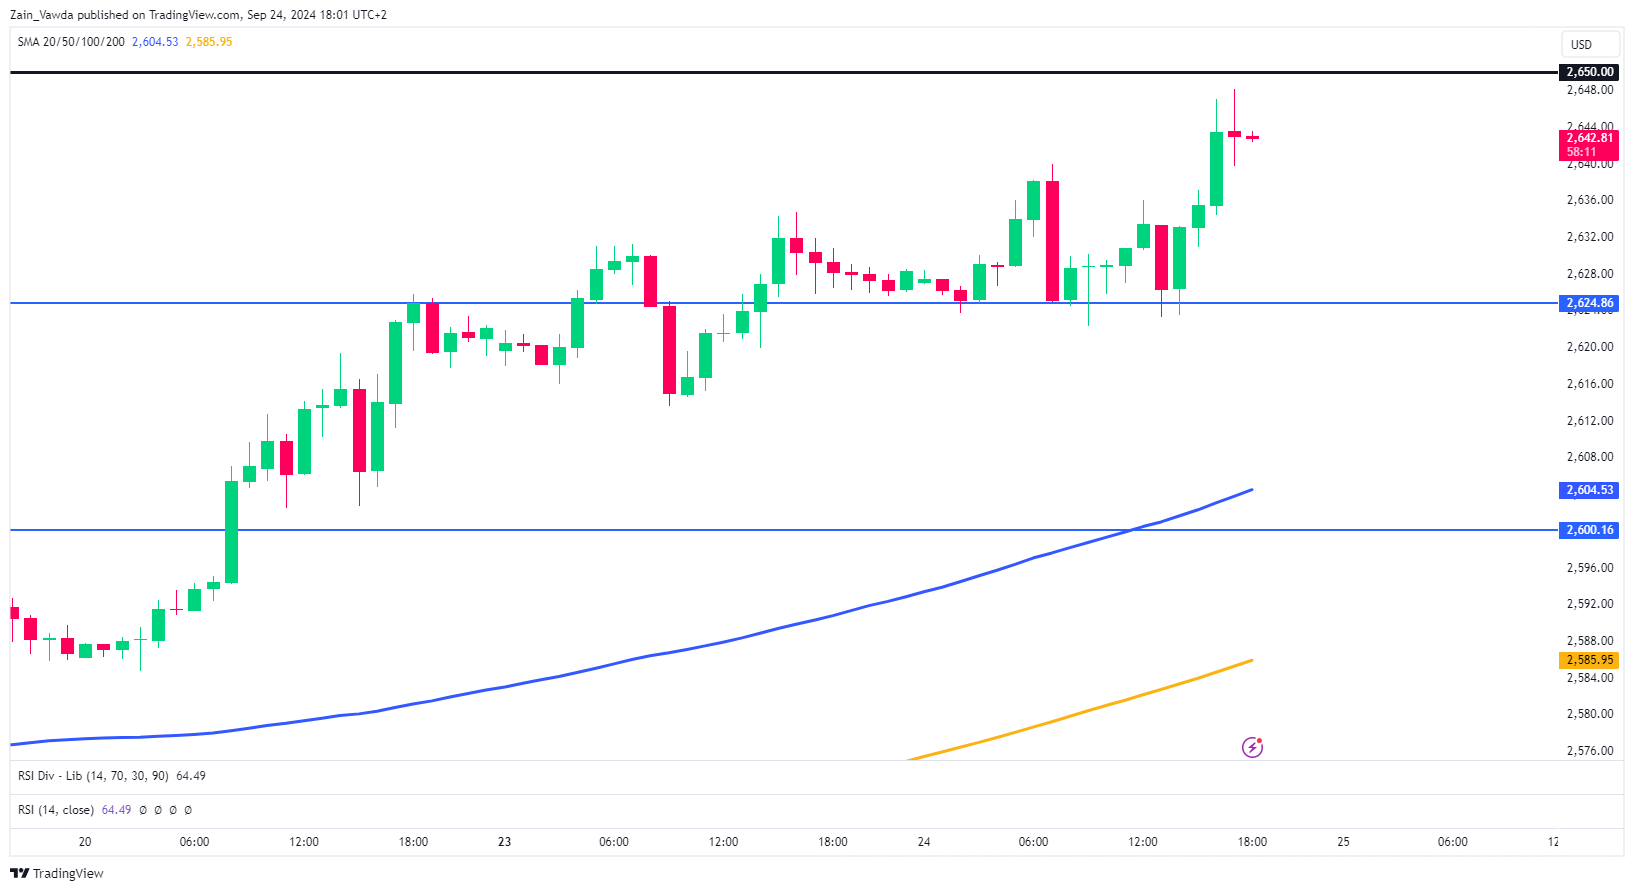
Source: TradingView (click to enlarge)
Support
- 2625
- 2600
- 2587
Resistance
- 2650
- 2675
- 2700
Elliott Wave Expects Silver (XAGUSD) to Continue Bullish move
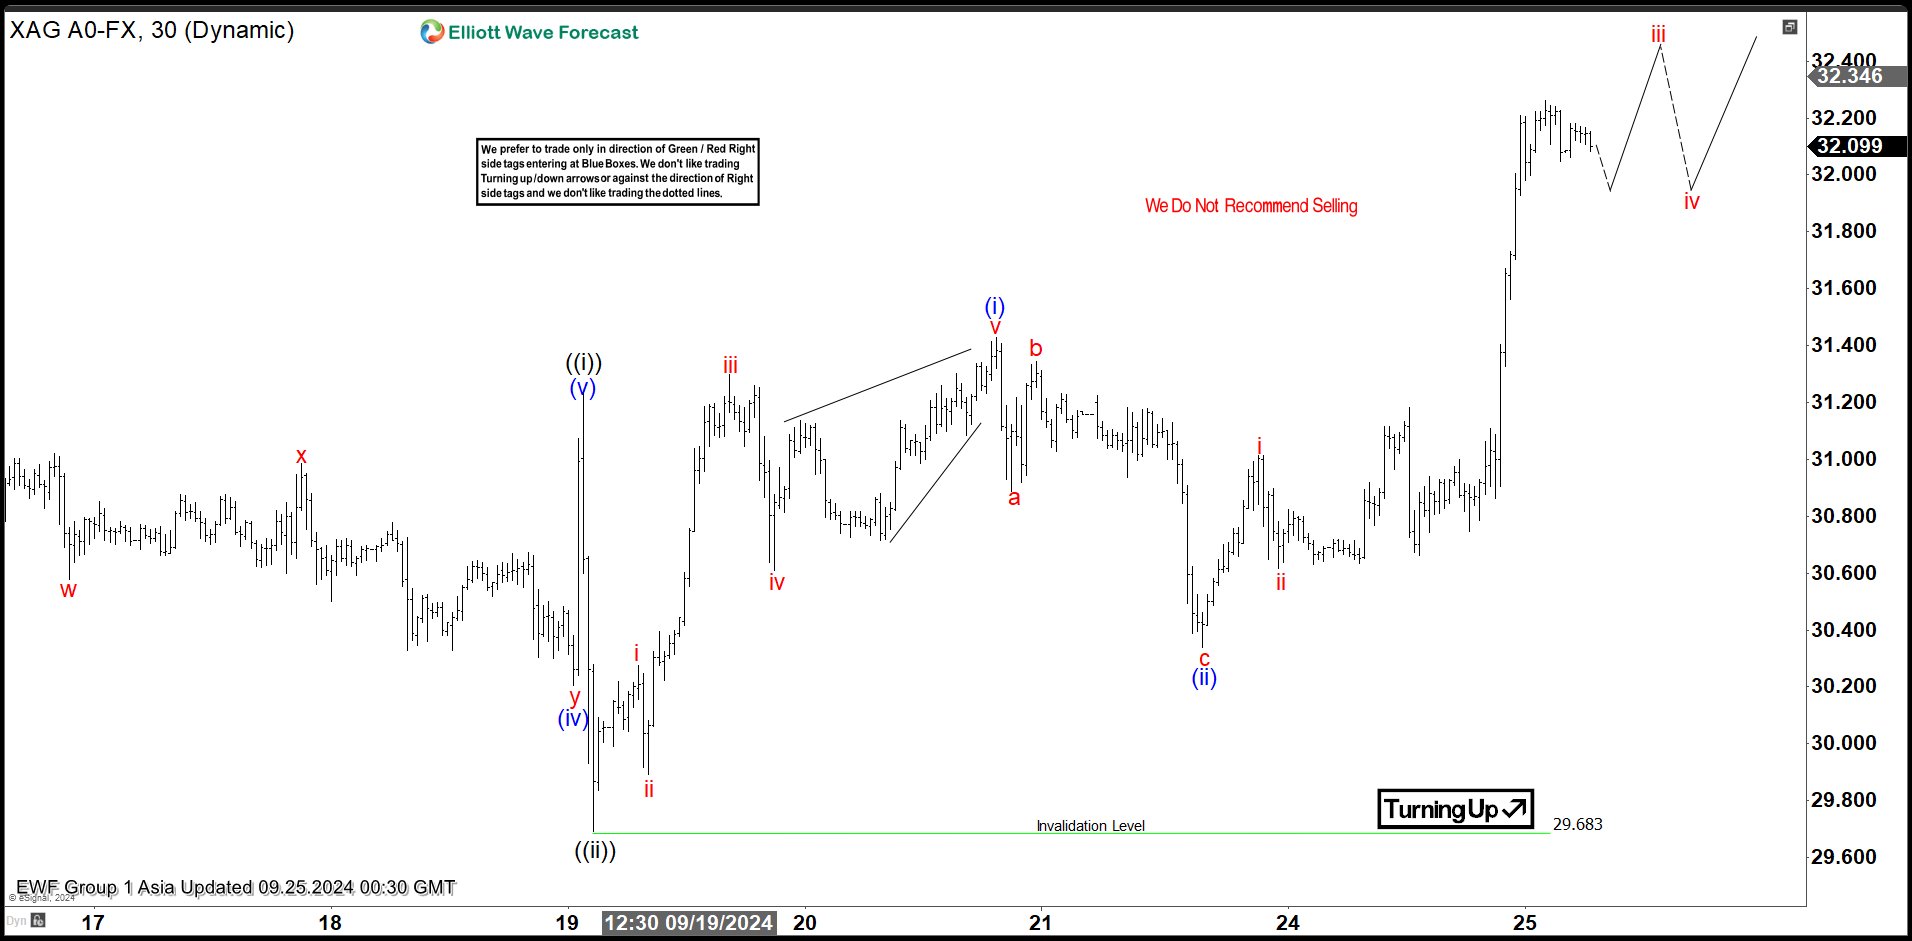
Silver (XAGUSD) is close to breaking above previous peak on 5.20.2024 high at 32.51. A break above the level confirms the next leg higher has resumed. Short term, rally from 9.9.2024 low is in progress as a 5 waves impulse Elliott Wave structure. Up from 9.9.2024 low, wave ((i)) ended at 31.23 and pullback in wave ((ii)) ended at 29.68. The metal has resumed higher in wave ((iii)). Up from wave ((ii)), wave i ended at 30.27 and pullback in wave ii ended at 29.89. The metal extended higher in wave iii towards 31.29 and wave iv pullback ended at 30.60. Final wave v higher ended at 31.43 which completed wave (i) in higher degree.
Pullback in wave (ii) ended at 30.34 with internal subdivision as a zigzag structure. Down from wave (i), wave a ended at 30.88 and wave b rally ended at 31.34. The metal then extended lower in wave c towards 30.34 which completed wave (ii) in higher degree. The metal has turned higher again in wave (iii). Up from wave (ii), wave i ended at 31.01 and wave ii pullback ended at 30.61. Expect wave iii to end soon, then it should pullback in wave iv to correct cycle from 9.23.2024 low in 3, 7, 11 swing before it resumes higher again. Near term, as far as pivot at 29.68 low stays intact, expect dips to find support in 3, 7, 11 swing for further upside.
Silver 30 Minutes Elliott Wave Chart
Silver (XAGUSD) Elliott Wave Video
https://www.youtube.com/watch?v=JKFR6066o_Y
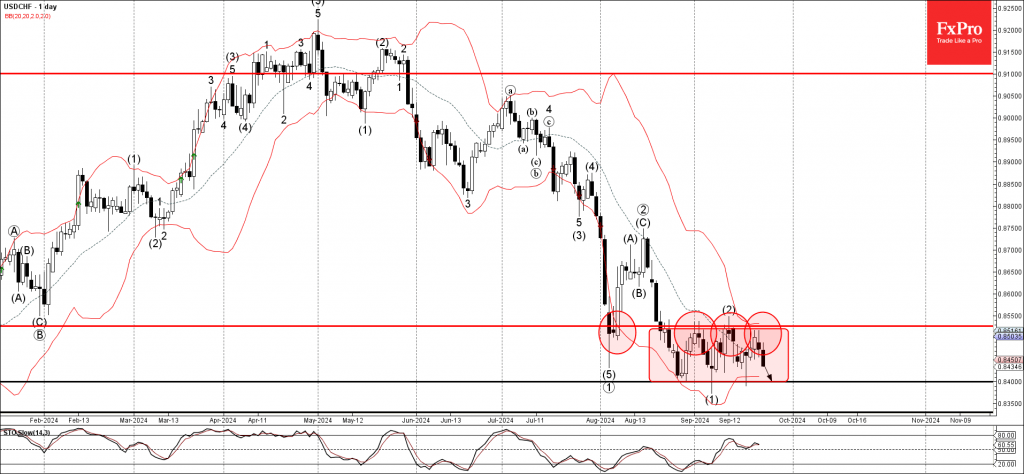
USDCHF Wave Analysis
- USDCHF reversed from resistance area
- Likely to fall to support level 0.8400
USDCHF currency pair recently reversed down from the resistance area located at the intersection of the key resistance level 0.8525 (upper border of the narrow sideways price range inside which the pair is moving from August) and the upper daily Bollinger Band.
The downward reversal from this resistance area is likely to form the daily Evening Star – if the pair closes today near the current levels.
Given the clear daily downtrend, USCHF can be expected to fall further to the next support level 0.8400 (lower boundary of the active sideways price range).
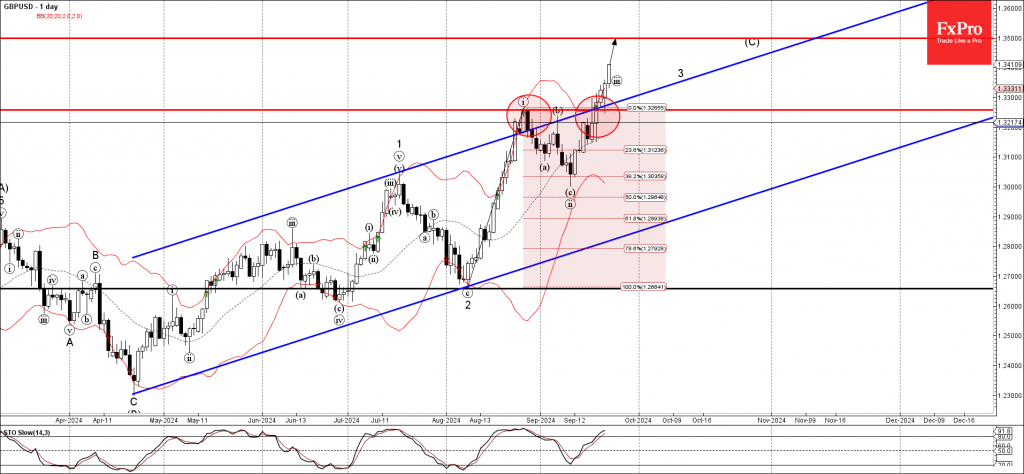
GBPUSD Wave Analysis
- GBPUSD broke resistance area
- Likely to rise to resistance level 1.3500
GBPUSD recently broke the resistance area located at the intersection of the key resistance level 1.3255 (former monthly high from August) and the resistance trendline of the daily up channel from April.
The breakout of this resistance area accelerated the active impulse waves iii and 3 – which belong to the multi-month upward impulse sequence (C) from April.
Given the clear daily uptrend and the strongly bearish US dollar sentiment, GBPUSD can be expected to rise further to the next resistance level 1.3500, target for the completion of wave (C).
China’s Stimulus Boosts Yuan and Shares
China has unveiled stimulus measures to boost the economy. The scale is not impressive – it is not an all-out crisis salvo but rather an attempt to stop a slide here and there. The People’s Bank of China announced a 0.2 percentage point cut in benchmark interest rates and a 0.25-0.50 percentage point cut in the reserve requirement ratio, freeing up 1 trillion yuan ($142 billion) and easing the burden of mortgage payments.
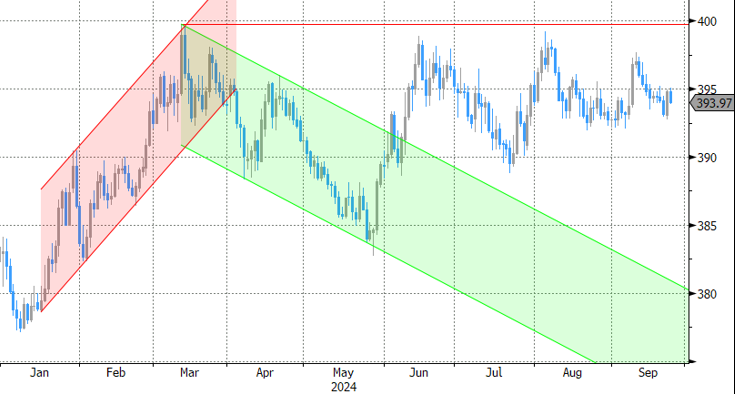
Financial markets welcomed the move, which was larger than expected. The Hang Seng Index rose 4% on Tuesday, taking the rally from September lows to 13%. However, unlike the S&P500, which has stormed to all-time highs, this is only a four-month high and about 42% below the 2018 peak. China’s blue-chip index is about the same distance from its highs, highlighting the impact of trade wars on the country’s financial market.
The opposite is true for bonds, where low interest rates and chronically low inflation have led to historically low government bond yields, meaning their prices have risen.
The yuan has gained 3.7% against the dollar over the past three months, not much by forex standards but impressive for the USDCNH. The pair has pulled back to 7.03, the low since May 2023, and has reversed from the area of long-term highs at 7.30.
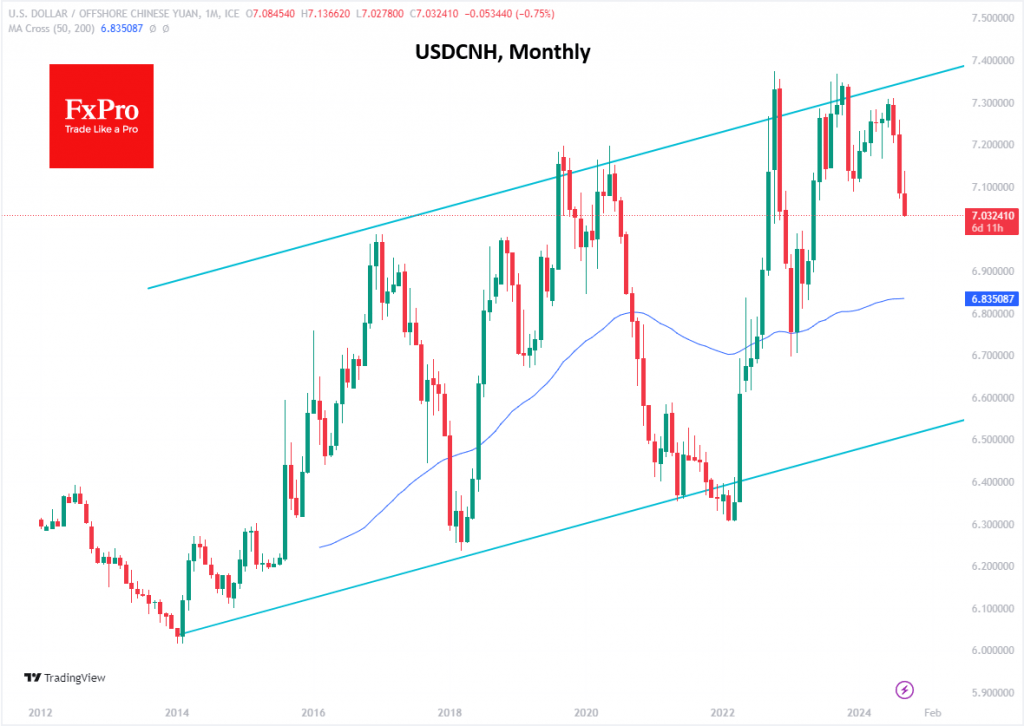
The strengthening of the yuan is an interesting market reaction, suggesting capital inflows from external markets. It won’t help competitiveness, but it could boost economic activity through investment.
In our view, despite the rate cut, the yuan could strengthen further, possibly towards the cyclical support level around 6.50.
The announced stimulus could bring some capital back into Chinese markets, especially if the Politburo sees an opportunity to support the economy and the struggling construction industry.
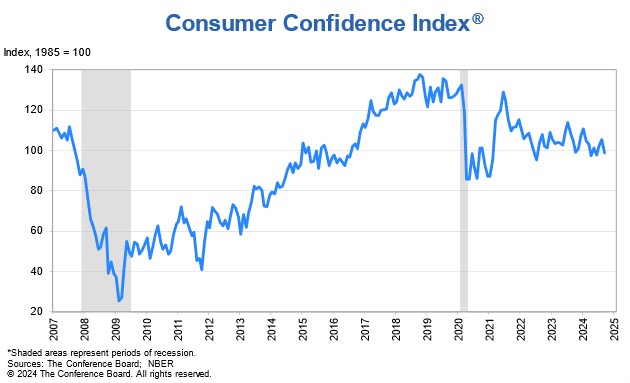
US consumer confidence falls to 98.7, largest slump since 2021
US Conference Board Consumer Confidence Index experienced a sharp drop in September, falling from 103.3 to 98.7, significantly below market expectations of 103.5. This marks the largest decline in consumer confidence since August 2021. Present Situation Index, which assesses current economic conditions, plunged by -10.3 points to 124.3, while Expectations Index, which gauges consumers’ outlook on future conditions, also dropped by -4.6 points to 81.7.
Dana M. Peterson, Chief Economist at The Conference Board, commented, “Consumer confidence dropped in September to near the bottom of the narrow range that has prevailed over the past two years.” She further highlighted that the decline affected all five components of the Index, with consumers’ outlook on current business conditions turning negative. Furthermore, views on the labor market continued to soften, with growing pessimism about both future employment prospects and income expectations.
Sunset Market Commentary
Markets
A barrage of Chinese monetary stimulus measures lifted the likes of the CSI 300 with more than 4% and jumpstarted European dealings too. The EuroStoxx50 rose as much as 1.4%, lead by consumer discretionary/luxury sector, before paring gains to around 1% currently. WS opened slightly higher. The risk-on environment leaves some traces on bond markets as well with core bonds losing marginal ground. US Treasuries underperform Bunds, with net daily changes ranging between +1.2 (2-yr) to +4.5 bps (30-yr). The US 10-yr yield (+4.2 bps) tries to recoup first minor resistance of 3.78% (December 2023 low) with the bottoming out at the long end of the curve now firmly taking shape. German rate changes vary from -1.9 bps (2-yr) to 3 bps (30-yr). The German Ifo sentiment indicator undershot analyst estimates but that shouldn’t surprise much after yesterday’s disastrous PMIs. The combined reading fell from 86.6 to 85.4, matching the post-pandemic lows of 85.3. The indicator was lower only during the GFC and pandemic year 2020. Especially the current assessment (84.4, down from 86.4, new post-pandemic low) is in distress territory. The expectations gauge fell to 86.3, from 86.8. The darkening European economic outlook reopened the debate on an October rate cut. Lagarde and many of her colleagues dismissed it shortly after the September meeting but Estonian governing council member Muller is the first since the PMIs to not “totally” rule it out. He did add it would be easier to decide in December. European money markets give it a probability just short of 60%. Sticking to central bank speech, Fed’s Bowman explained her dissenting 25 bps rate cut vote last week. She said she still sees greater risks to price stability, “especially when the labour market continues to be near estimates of full employment.” A 25 bps move “would have better reinforced the strength in economic conditions, while also confidently recognizing progress toward our goals,” Bowman said, adding that she preferred a “measured” approach going forward. It’s classic risk-on in other markets as well, including commodities. Oil prices rise 2.2% (Brent $75.5/b), buoyed by elevated tensions in the Middle East as well after another major Israeli strike on Hezbollah targets in Lebanon. Iron adds about 2%. The FX space is a similar story with safe havens including the Japanese yen suffering. USD/JPY – though off intraday highs – fills bids around 144.1. Cyclical sensitive currencies such as the Aussie (also helped by the RBA’s status quo this morning) and kiwi dollar are among the best performers, together with the NOK and SEK. The euro has a slight edge over the dollar, allowing EUR/USD to recoup a good chunk of yesterday’s damage. The pair is changing hands around 1.114. Sterling holds on to yesterday’s impressive gains against the euro. EUR/GBP hovers around Monday’s closing levels of 0.832. Cable (GBP/USD) is readying an attack of the 1.34 big figure.
News & Views
Belgium business confidence continued to deteriorate in September, sliding from -12.6 to -13.3 (vs -12.4 expected). The fourth consecutive decline bring business confidence to the lowest level since January. Details showed weakness in manufacturing (-17.7 from -16.5) and building (-11.7 from -7.5) more than offsetting improvements in trade (-6.9 from -16.6) and business services (1.9 from 0.4). Manufacturing businesses assessed stock levels less favorably and also expressed much more demand expectations. Building business leaders indicated that they expect a slight decline in demand but were mainly more negative in their assessment of recent developments in both equipment use and orders books. Last week, Belgian consumer confidence fell from -3 to -7, matching the 2024 low set in May.
Czech economic sentiment improved from 93.7 to 97 in September, while consensus only expected a stabilization. It is the best outcome since June and carried by a broad-based improvement in business confidence (96.8 from 93). Confidence increased by 5.1 points in selected services, 3 in construction, 2.9 in industry and 1.3 in trade. Consumer confidence more or less stabilized (97.9 from 97.3) with subcomponents measuring overall economic & personal financial expectations over the next 12 months showing no meaningful direction neither. The share of consumers who believe that the current period is not conducive to making large purchases fell for the second consecutive month. The Czech koruna didn’t respond to the release with EUR/CZK testing this month’s high at 25.17 going into tomorrow’s central bank meeting where the CNB is expected to deliver a 25 bps rate cut to 4.25%.
Graphs
EUR/HUF: forint ekes out slight gain after MNB cut as expected (-25 bps to 6.5%) but sticks a cautious and data-driven approach
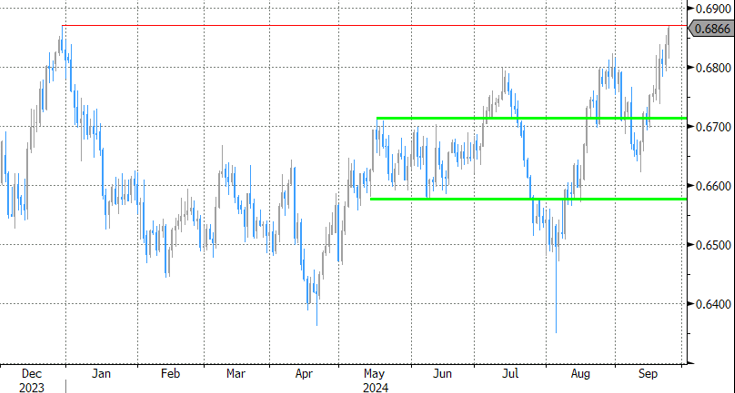
AUD/USD: Aussie dollar tests January top after RBA keeps rates steady as inflation is not expected to return to 2% before 2026
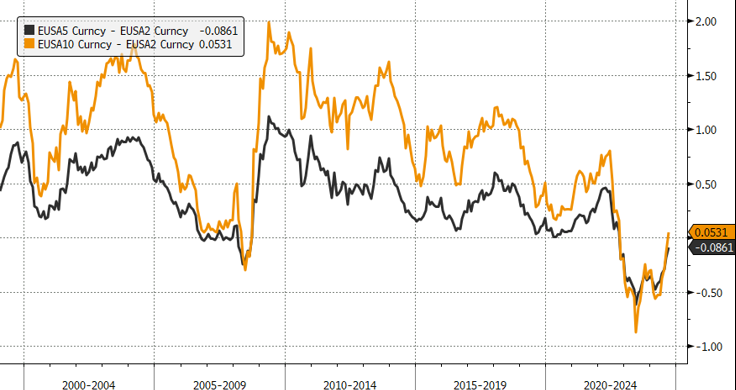
Spread between 10-yr and 2-yr EMU swap recently turned positive for first time since 2022 as ECB easing bets rise on darkening outlook
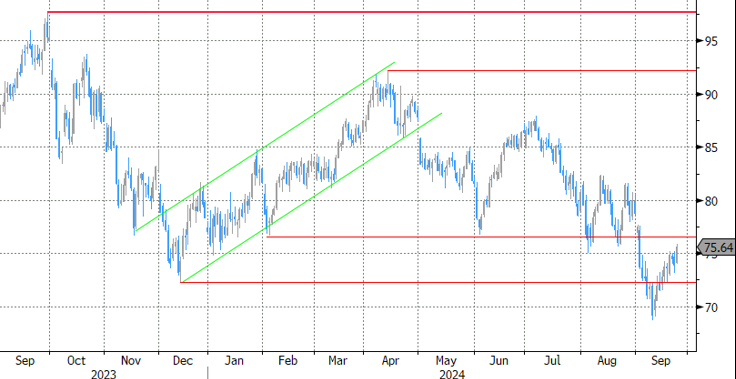
Oil (Brent, $/b) rises on hopes of a Chinese revival after the recent string of monetary measures
EUR/USD Mid-Day Outlook
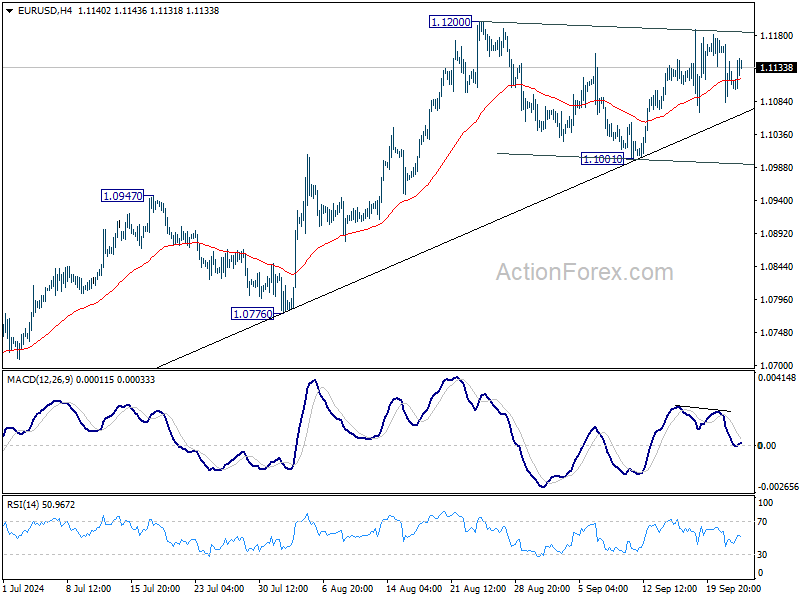
Daily Pivots: (S1) 1.1073; (P) 1.1121; (R1) 1.1158; More....
No change in EUR/USD's outlook as range trading continues. Intraday bias remains neutral. Further rally is expected as long as 1.1001 support holds. On the upside, above 1.1200 will target 1.1274 high. Firm break there will resume larger up trend. However, firm break of 1.1001 will indicate near term bearish reversal.
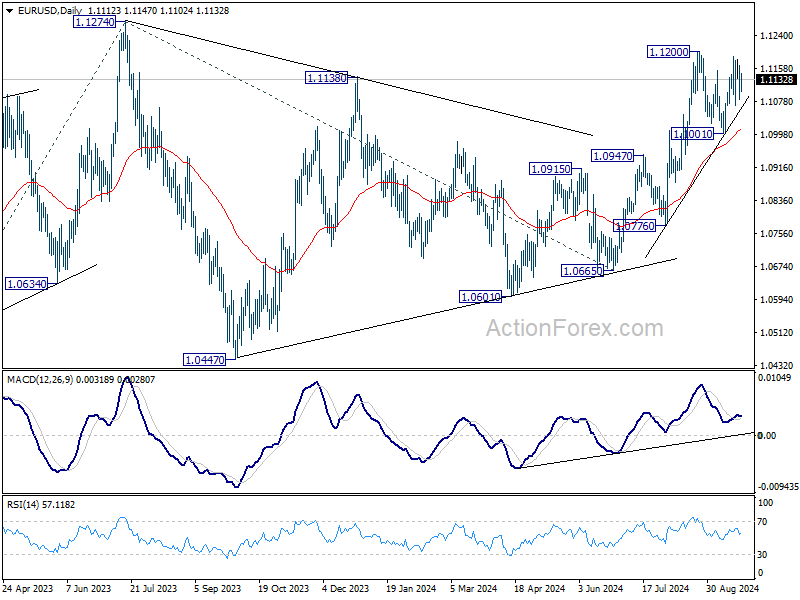
In the bigger picture, prior break of 1.1138 resistance indicates that corrective pattern from 1.1274 might have completed at 1.0665 already. Decisive break of 1.1274 (2023 high) will confirm resumption of whole up trend from 0.9534 (2022 low). Next target will be 61.8% projection of 0.9534 to 1.1274 from 1.0665 at 1.1740. This will now be the favored case as long as 1.0947 resistance turned support holds.
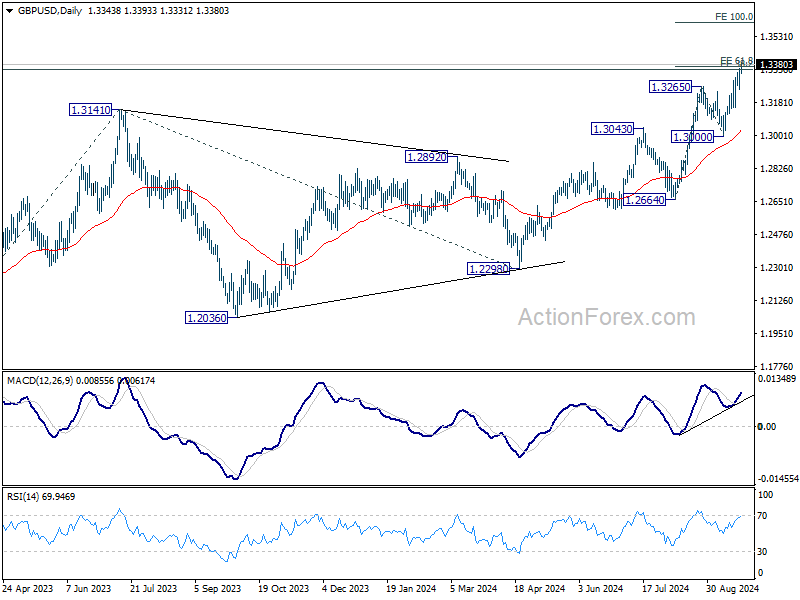
GBP/USD Mid-Day Outlook
Daily Pivots: (S1) 1.3278; (P) 1.3318; (R1) 1.3389; More...
Intraday bias in GBP/USD stays on the upside. Decisive break of 61.8% projection of 1.2664 to 1.3265 from 1.3000 at 1.3371 will pave the way to 100% projection at 1.3601 next. On the downside, below 1.3247 minor support will turn intraday bias neutral and bring consolidations first. But outlook will stay bullish as long as 1.3000 support holds.
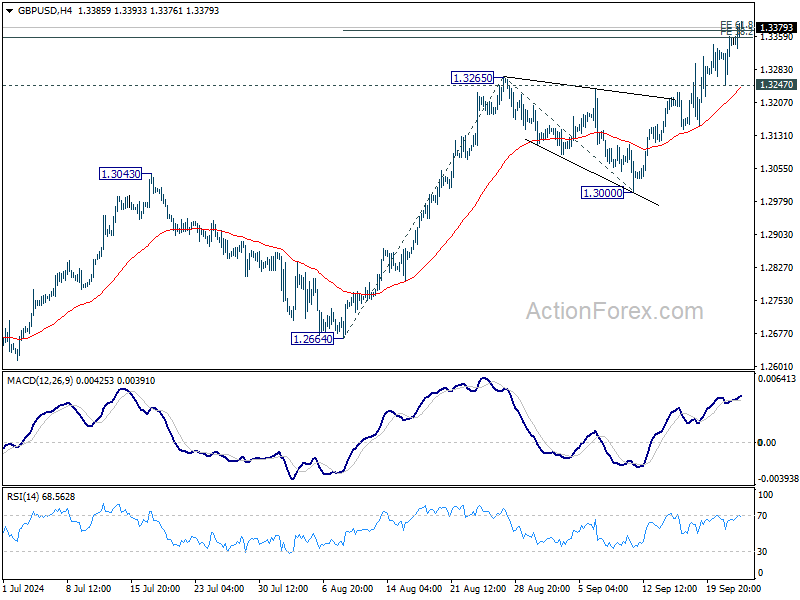
In the bigger picture, up trend from 1.0351 (2022 low) is in progress. Next target is 38.2% projection of 1.0351 to 1.3141 from 1.2298 at 1.3364. Decisive break there will target 61.8% projection at 1.4022. For now, outlook will stay bullish as long as 1.2892 resistance turned support holds, even in case of deep pullback.