
Sample Category Title
GBP/USD Daily Outlook
Daily Pivots: (S1) 1.3278; (P) 1.3318; (R1) 1.3389; More...
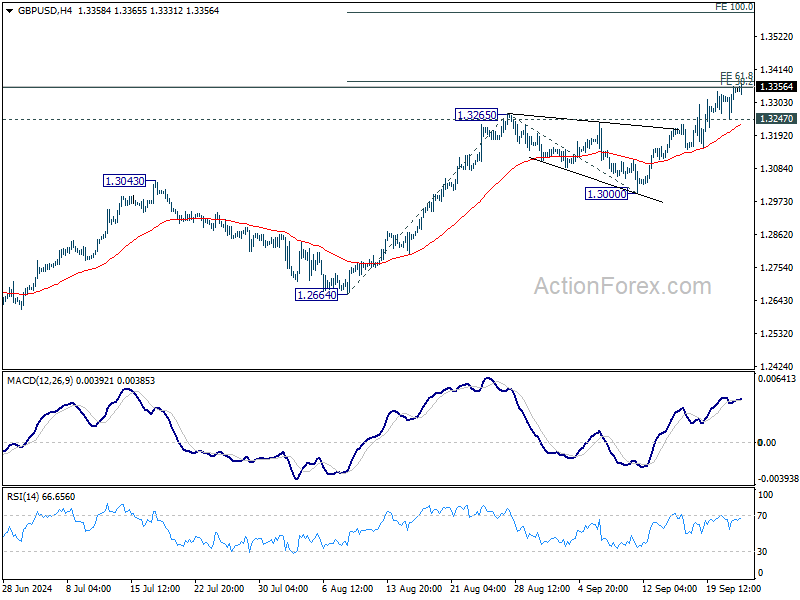
GBP/USD's rally is still in progress and intraday bias stays on the upside. Decisive break of 61.8% projection of 1.2664 to 1.3265 from 1.3000 at 1.3371 will pave the way to 100% projection at 1.3601 next. On the downside, below 1.3247 minor support will turn intraday bias neutral and bring consolidations first. But outlook will stay bullish as long as 1.3000 support holds.
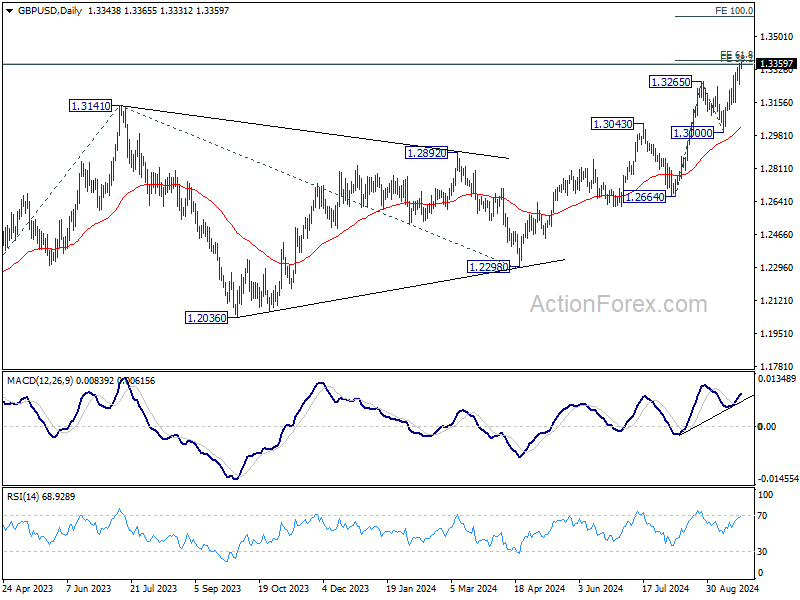
In the bigger picture, up trend from 1.0351 (2022 low) is in progress. Next target is 38.2% projection of 1.0351 to 1.3141 from 1.2298 at 1.3364. Decisive break there will target 61.8% projection at 1.4022. For now, outlook will stay bullish as long as 1.2892 resistance turned support holds, even in case of deep pullback.
USD/CHF Daily Outlook
Daily Pivots: (S1) 0.8449; (P) 0.8484; (R1) 0.8510; More…
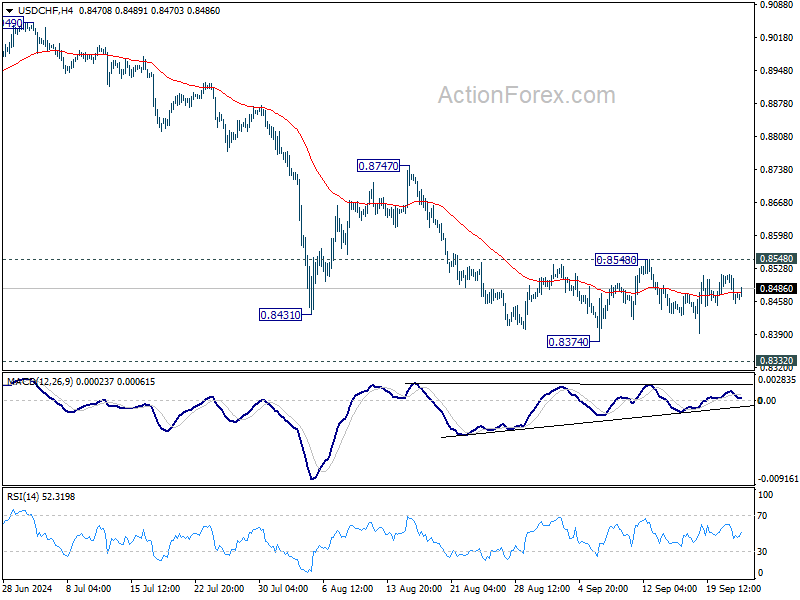
No change in USD/CHF's outlook as range trading continues. Intraday bias stays neutral at this point. On the downside, break of 0.8374 will resume the fall from 0.9223 to retest 0.8332 low. Decisive break there will indicate larger down trend resumption. However, considering bullish convergence condition in 4H MACD, break of 0.8548 resistance will confirm short term bottoming, and turn bias back to the upside for 0.8747 resistance.
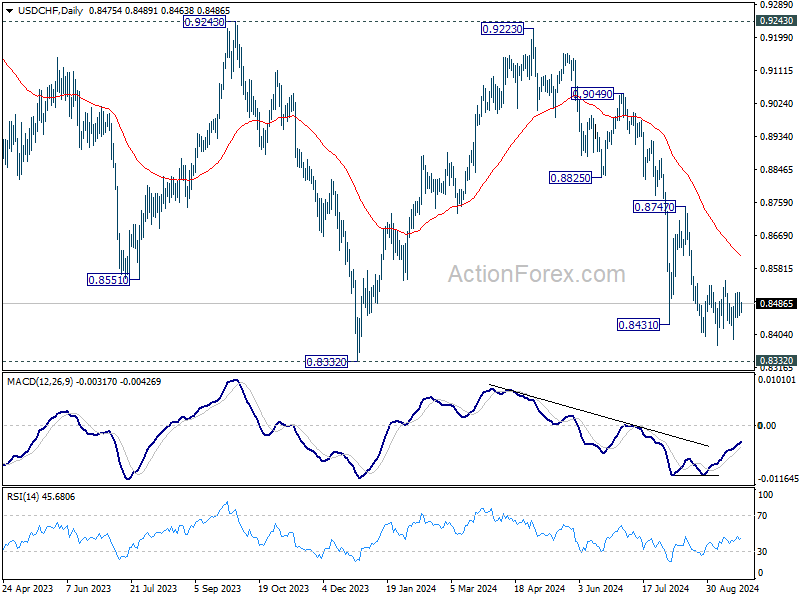
In the bigger picture, price actions from 0.8332 (2023 low) are currently seen as a medium term corrective pattern, with fall from 0.9223 as the second leg. Strong support could be seen from 0.8332 to bring rebound. Yet, overall outlook will continue to stay bearish as long as 0.9243 resistance holds. Firm break of 0.8332, however, will resume larger down trend from 1.0146 (2022 high).
On Lookout Whether Yesterday’s Sharp European Yield Drop May Ease
Markets
Horrible European PMI business confidence (September) triggered a textbook bull steepening. German rates dropped between -2.8 (30-yr) and -8.1 (2-yr) bps. The spread between the 10-yr and 2-yr hit a milestone by turning positive for the first time since November 2022. Swaps did so already last Friday. Front-end outperformance rooted from increased ECB easing bets. An October cut – which president Lagarde and other policymakers all but ruled out – is about 40% discounted. US rates eked out less than 1 bp across the curve. They were on track for larger gains (up to 6 bps intraday) but another escalation in the Middle East conflict caused some safe haven flows in late European afternoon trading. The topic increasingly grabs (media) attention and bears following up. Several Fed governors including Atlanta’s Bostic, Minneapolis’ Kashkari and Chicago’s Goolsbee signaled openness (though did not commit) to back-to-back 50 bps moves if warranted by the data. Their comments perhaps readied US Treasuries for lift-off, all they needed was a trigger. The euro greatly underperformed G10 currency peers. EUR/USD temporarily dropped sub 1.11 before closing at 1.1111, down from 1.1159. The common currency’s slid all day long against sterling. EUR/GBP tanked from 0.838 to 0.832, dropping below the previous YtD low and interim support at 0.834 (August 2022 interim low). UK PMI’s (52.9 composite), even though easing from the August readings, contrasted starkly with the European ones as they suggested still-decent growth. Today’s advanced economy calendar is pretty meagre with only US consumer confidence (Conference Board) scheduled for release. Fed Bowman’s speech on the monetary and economic outlook is worth watching since she dissented last week by voting for a 25 bps cut. Turning to markets, we are on the lookout whether yesterday’s sharp European yield drop may ease. The German 2-yr yield is near an important support zone just north of 2% (March 2023 low). Longer maturities trade a bit more comfortable above the first support levels. US short-term yields continue to consolidate while the long-end forces out a bottoming out. EUR/USD’s decline yesterday had no technical implications but the move in EUR/GBP, if confirmed in coming days, paves the way for a return to the 2022 low (0.8203).
News & Views
The Central bank of China this morning announced a broad set of measures to support economic growth and help to address the crisis in the property market. The package comes after a series of disappointing eco data indicating that this year’s growth target of about 5% is at risk. The measures also aim to boost consumer confidence. The PBOC will reduce the reserve requirement ratio (RRR) by 0.5%pts, freeing 1 trillion yuan of liquidity. Depending on the liquidity situation, the RRR might be further reduced by 0.25-0.50 ppts later its year. It will lower the 7-day reverse repo rate by 0.2%pts to 1.5%. The interest rate on the medium term lending facility will be reduced by about 30 bps. Measures to support the property market include an on average 50 bps reduction on the interest rate of existing mortgages and a reduction of the minimum downpayment requirement to 15%. The PBOC announced tools to support capital markets by providing easier access to funds, brokers, insurers and commercial banks to directly or indirectly support buying of equities. The CSI 300 index adds 3.4%. China’s 10-yr yield initially declined a few bps but currently trades near 2.06% again. The yuan gains from opening levels near USD/CNY 7.06 to 7.035.
The Reserve bank of Australia today as expected kept its policy rate unchanged at 4.35%. The RBA maintains a rather hawkish stance. Inflation as fallen substantially from the 2022 peak, but with underlying inflation still at 3.9% in June, it is still some way above the 2-3% target. Even as headline inflation may fall further temporarily, it is not expected to sustainably return to target until 2026. Growth was weak in Q2, but labour market conditions remain tight, despite some signs of gradual easing. Sustainably returning inflation to target within a reasonable timeframe remains the Board’s highest priority. Recent data have reinforced the need to remain vigilant to upside risks to inflation and the Board is not ruling anything in or out. Policy will need to be sufficiently restrictive until the Board is confident that inflation is moving sustainably towards the target range. Despite the hawkish stance the 3-y Australian government bond yields eases slightly to 3.5%. Markets still see about 50% change of a first rate cut in December. The AUD/USD cross rate is nearing the December 2023 top (0.687).
Graphs
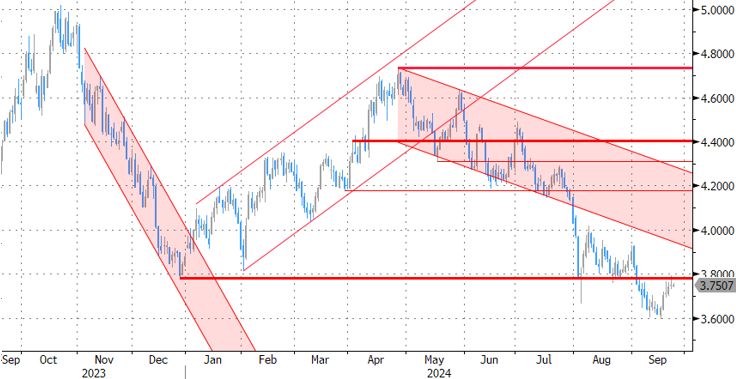
GE 10y yield
The ECB cut policy rates by 25 bps in June and in September. Stubborn inflation (core, services) make follow-up moves less evident. We expect the central bank to stick with the quarterly reduction pace. Disappointing US and unconvincing-to-outright-weak EMU activity data dragged the long end of the curve down. The move accelerated during the early August market meltdown.
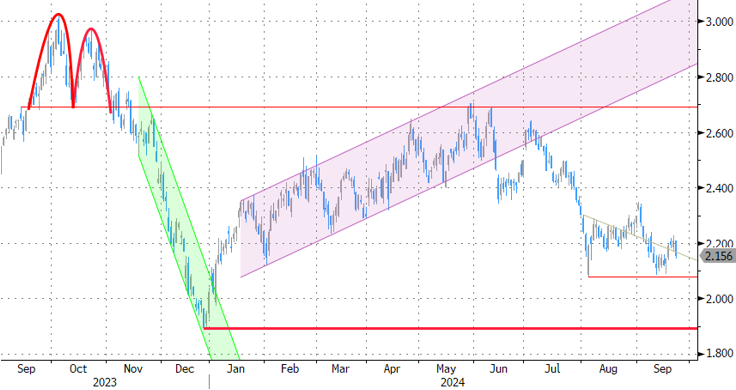
US 10y yield
The Fed kicked off its easing cycle with a 50 bps move. It is headed towards a neutral stance now that inflation and employment risks are in balance. Conservative SEP unemployment forecasts risk being caught up by reality and with it the dot plot (50 bps more cuts in 2024). We hold our call for two more 50 bps cuts this year. Pressure on the front of the curve and weakening eco data keeps the long end in the defensive for now as well.
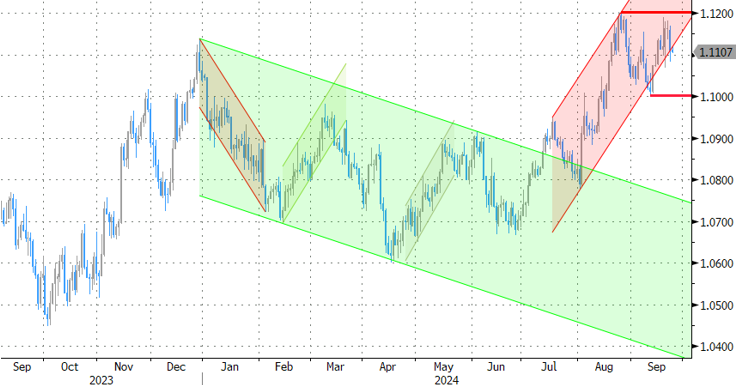
EUR/USD
EUR/USD moved above the 1.09 resistance area as the dollar lost interest rate support at stealth pace. US recession risks and bets on fast and large rate cuts trumped traditional safe haven flows into USD. EUR/USD’s recent dollar-driven ascent stumbled into resistance around 1.12. The ailing euro(pean economy) is offsetting some of the general dollar weakness.
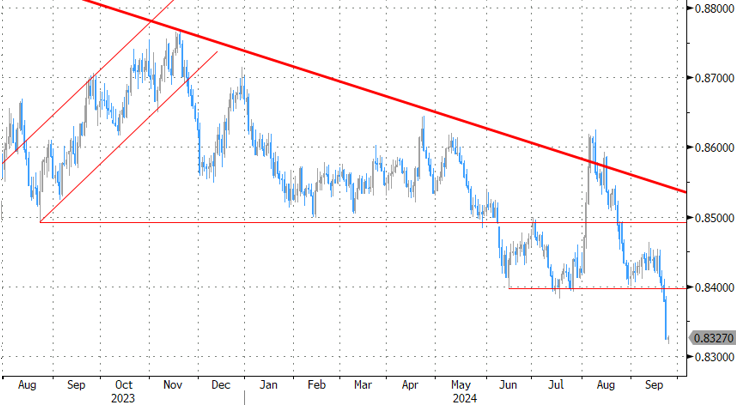
EUR/GBP
The BoE delivered a hawkish cut in August. Policy restrictiveness will be further unwound gradually on a pace determined by a broad range of data. The strategy similar to the ECB’s balances out EUR/GBP in a monetary perspective. But the economic picture is increasingly diverging to the benefit of sterling. EUR/GBP succumbed to horrible European September PMI’s. Support at 0.84 broke and brings the 2022 low (0.8203) on the radar.
AUD/USD Daily Report
Daily Pivots: (S1) 0.6806; (P) 0.6830; (R1) 0.6862; More...
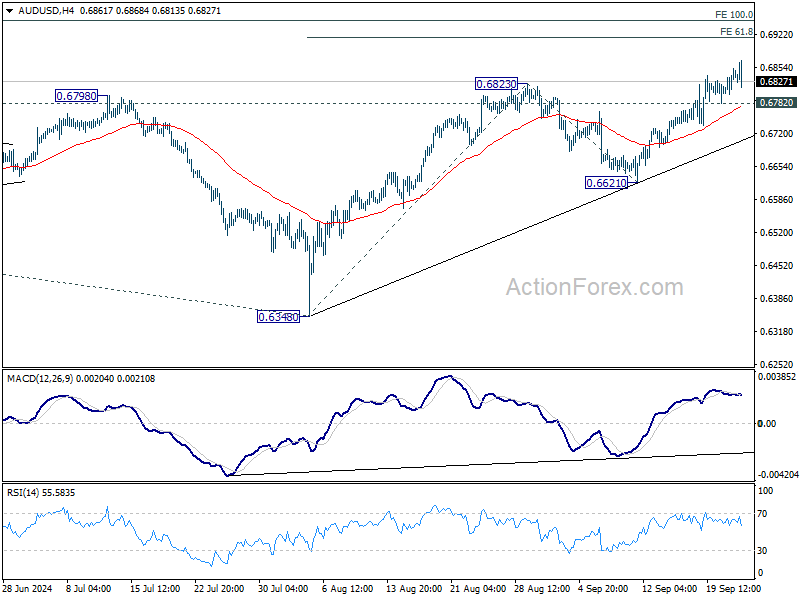
Intraday bias in AUD/USD remains on the upside as rise from 0.6348 is in progress. Next target is 61.8% projection of 0.6348 to 0.6823 from 0.6621 at 0.6915. On the downside, below 0.6736 minor support will turn intraday bias neutral first. But outlook will remain cautiously bullish as long as 0.6621 support holds, in case of retreat.
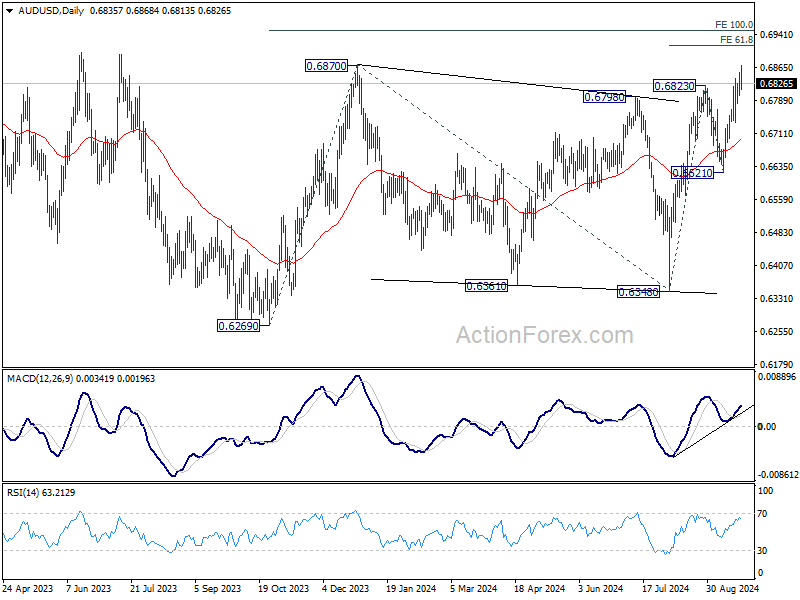
In the bigger picture, overall, price actions from 0.6169 (2022 low) are seen as a medium term corrective pattern, with rise from 0.6269 as the third leg. Firm break of 6870 resistance will target 100% projection of 0.6269 to 0.6870 from 0.6340 at 0.6941. In case of another fall, strong support should be seen from 0.6169/6348 to bring rebound.
USD/CAD Daily Outlook
Daily Pivots: (S1) 1.3493; (P) 1.3538; (R1) 1.3588; More...
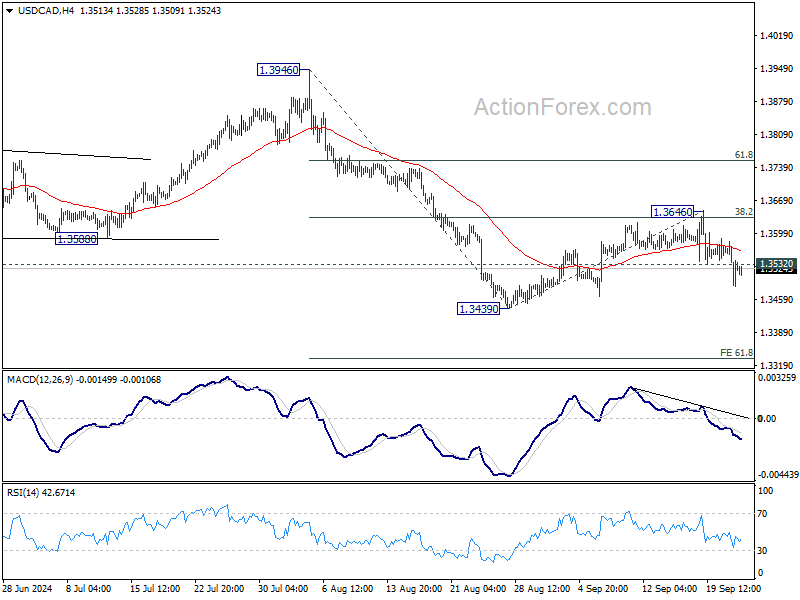
USD/CAD's break of 1.3532 support suggests that corrective recovery from 1.3439 has completed at 1.3646 already, after rejection by falling 55 D EMA. Intraday bias is back on the downside for retesting 1.3439 low first. Firm break there will resume the decline from 1.3946, and target 61.8% projection of 1.3946 to 1.3439 from 1.3646 at 1.3333. For now, risk will stay on the downside as long as 1.3646 resistance holds, in case of recovery.
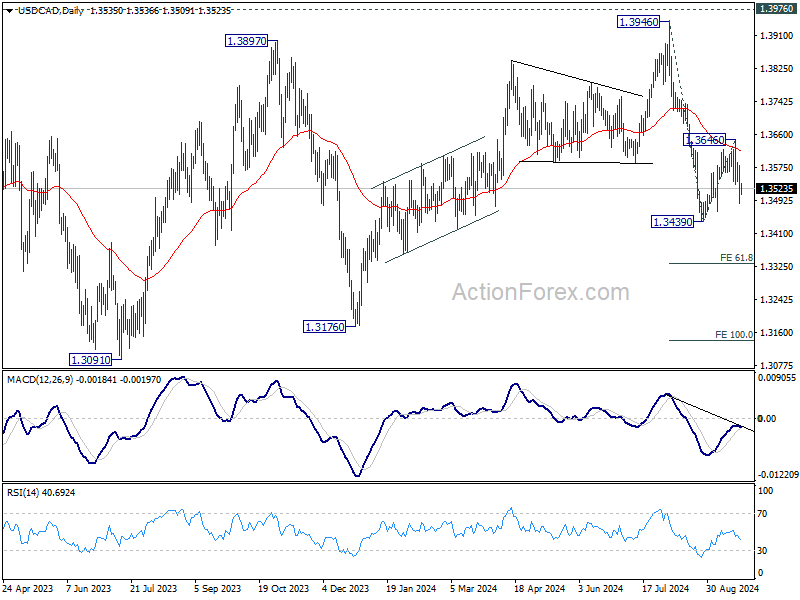
In the bigger picture, corrective pattern from 1.3976 (2022 high) is extending with another falling leg. While deeper decline could be seen, strong support should emerge above 1.2947 resistance turned support to bring rebound. Rise from 1.2005 (2021 low) is still in favor to resume at a later stage.
EUR/CHF Daily Outlook
Daily Pivots: (S1) 0.9385; (P) 0.9443; (R1) 0.0.9476; More....
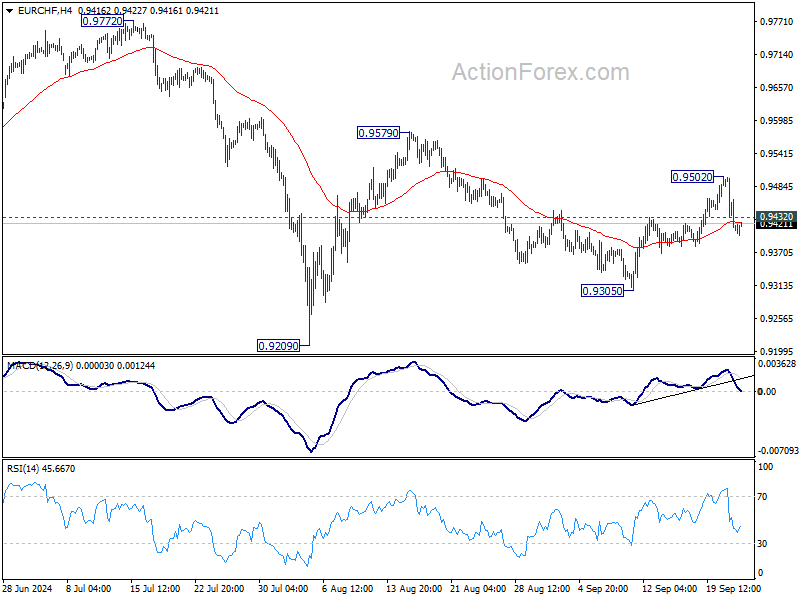
A temporary top is formed at 0.9502 with current retreat and intraday bias in EUR/CHF is turned neutral first. On the upside, above 0.9502 will resume the rally from 0.9305, as the third leg of the pattern from 0.9209, to 0.9579 resistance. However, break of 0.9305 will resume the decline from 0.9579 towards 0.9209 low.
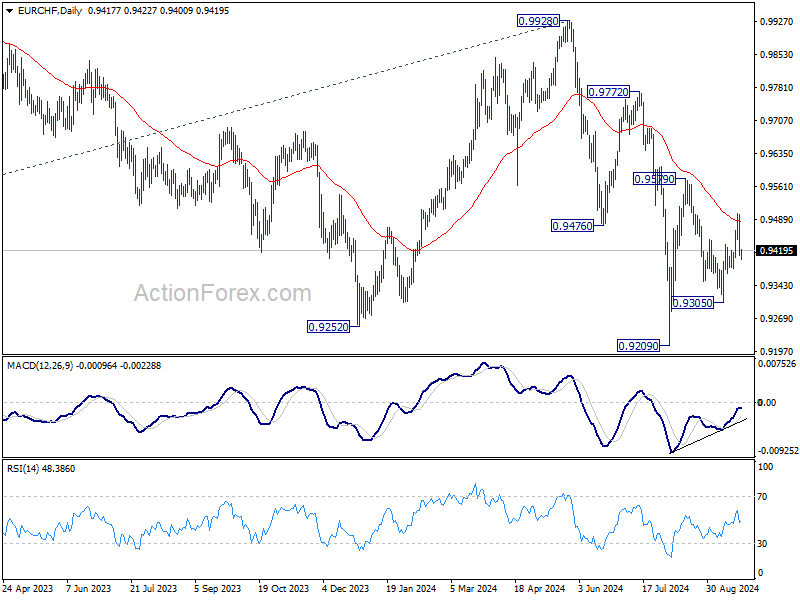
In the bigger picture, medium term corrective pattern from 0.9407 (2022 low) might have completed with three waves to 0.9928. Decisive break of 0.9252 (2023 low) will confirm long term down trend resumption. Next target will be 61.8% projection of 1.1149 to 0.9407 from 0.9928 at 0.8851. For now, outlook will stay bearish as long as 0.9928 resistance holds, even in case of strong rebound.
GBP/JPY Daily Outlook
Daily Pivots: (S1) 190.41; (P) 191.42; (R1) 192.71; More...
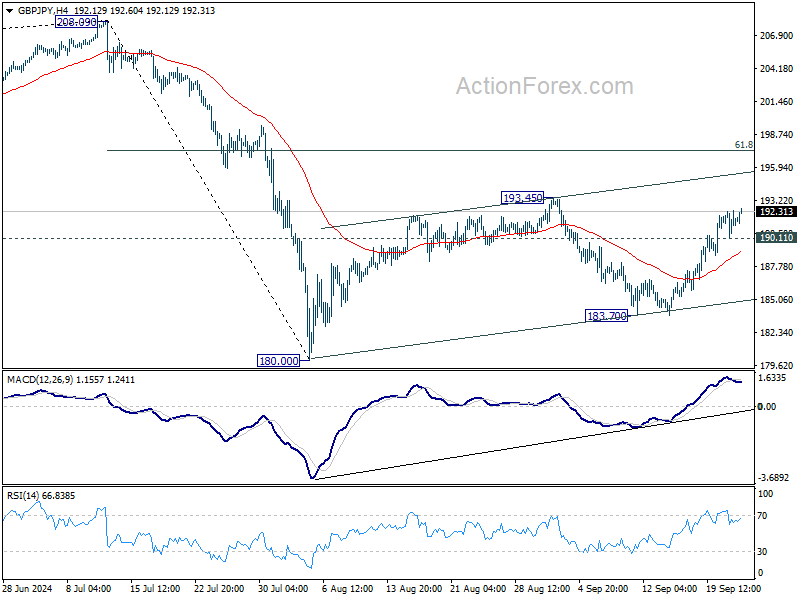
No change in GBP/JPY's outlook and intraday bias stays on the upside. Rise from 183.70, as the third leg of the corrective pattern from 180.00, is in progress for 193.45 resistance. Firm break there will target 61.8% retracement of 208.09 to 180.00 at 197.35. On the downside, though, below 190.11 minor support will turn intraday bias neutral first.
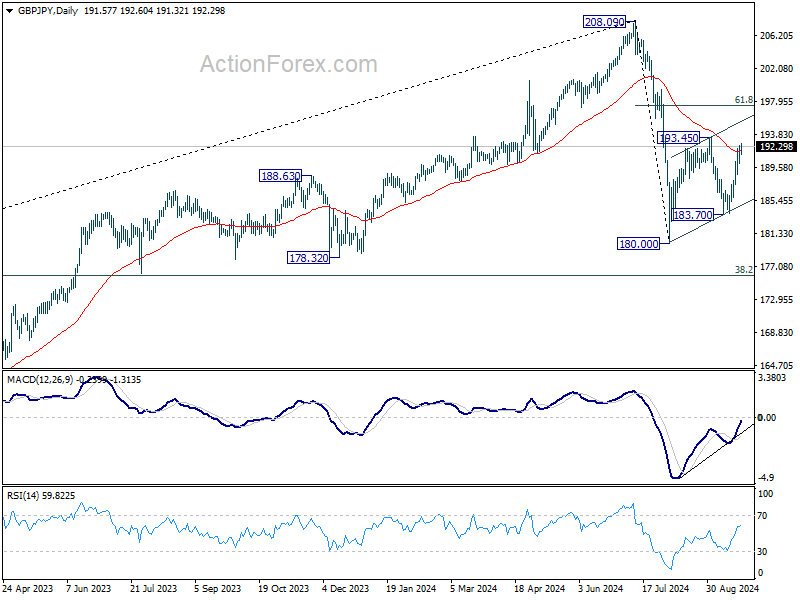
In the bigger picture, price actions from 208.09 are seen as a correction to whole rally from 123.94 (2020 low). The range of consolidation should be set between 38.2% retracement of 123.94 to 208.09 at 175.94 and 208.09. However, decisive break of 175.94 will argue that deeper correction is underway.
EUR/JPY Daily Outlook
Daily Pivots: (S1) 158.68; (P) 159.93; (R1) 160.82; More....
A temporary top is formed at 161.17with current retreat and intraday bias is turned neutral first. Some consolidations could be seen first but another rally is expected as long as 155.14 support holds. Above 161.17 will resume the rise from 155.14, as the third leg of the corrective pattern from 154.40, to 163.86 resistance. Break there will target 61.8% retracement of 175.41 to 154.40 at 167.38.
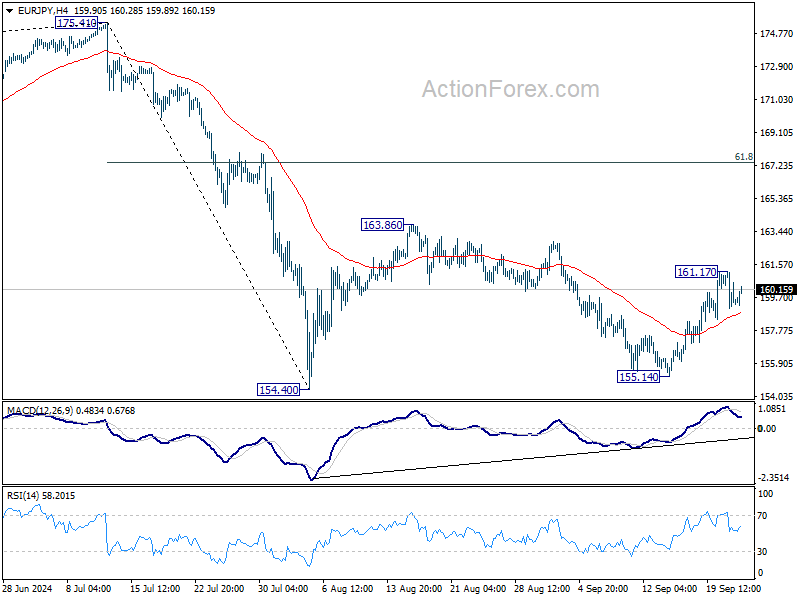
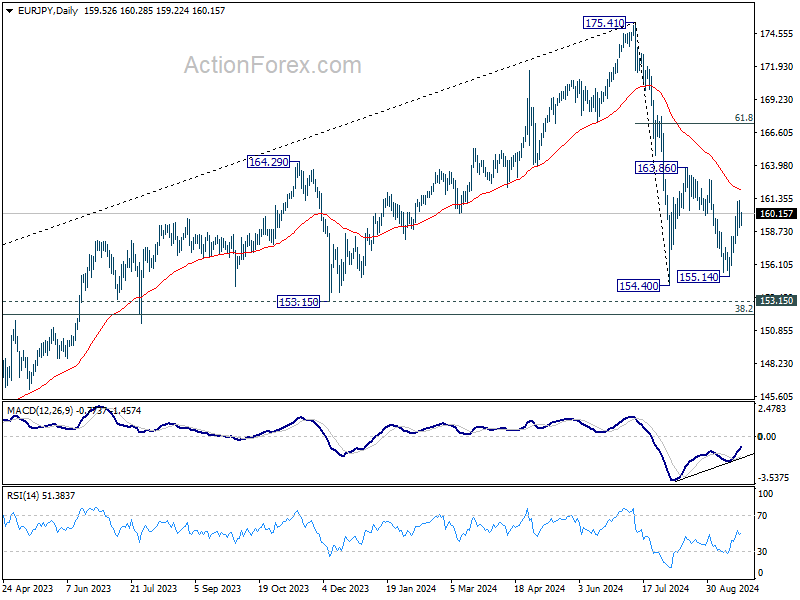
In the bigger picture, price actions from 175.41 are seen as correction to rally from 114.42 (2020 low). The range of consolidation should have been set between 38.2% retracement of 114.42 to 175.41 at 152.11 and 175.41 high. However, decisive break of 152.11 would argue that deeper correction is underway.
EUR/GBP Daily Outlook
Daily Pivots: (S1) 0.8302; (P) 0.8345; (R1) 0.8366; More...
Intraday bias in EUR/GBP remains on the downside as recent down trend continues. Decisive break of 61.8% projection of 0.8624 to 0.8399 from 0.8463 at 0.8324 will 100% projection at 0.8237 next. On the upside, above 0.8354 minor resistance will turn intraday bias neutral and bring consolidations. But outlook will stay bearish as long as 0.8463 resistance holds, in case of recovery.
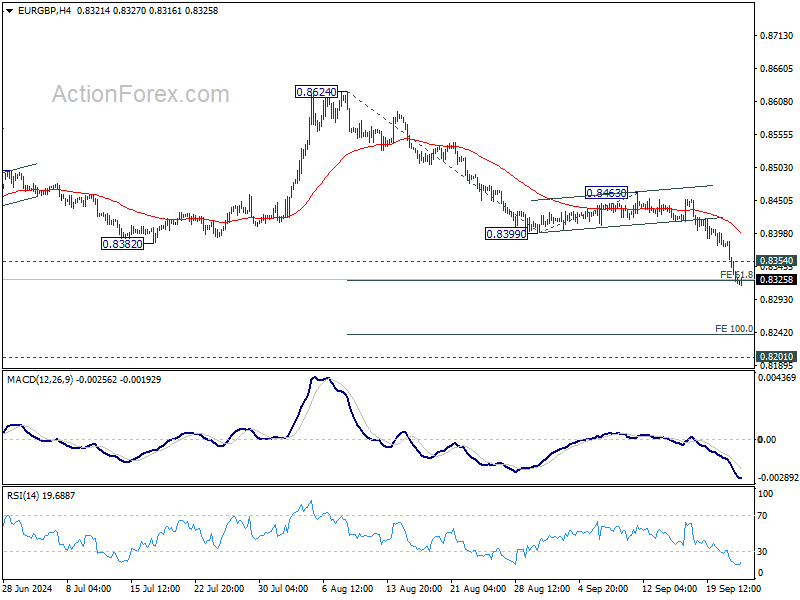
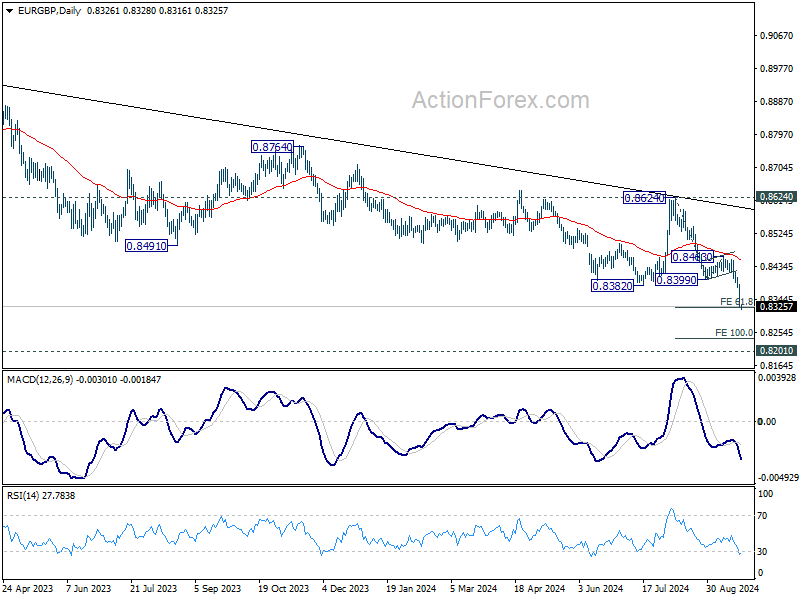
In the bigger picture, down trend from 0.9267 (2022 high) is resuming. Next target is 0.8201 (2022 low), but strong support should be seen there to bring rebound. Outlook will remain bearish as long as 0.8624 resistance holds even in case of strong rebound.
China Announces Broad Monetary Stimulus
In focus today
In Germany, we receive the Ifo growth indicator for September. In August, the assessment of the business situation declined to the lowest level since Covid. We expect another benign print as the German economy continues to struggle with weak activity in the manufacturing sector.
In the afternoon, we expect the Central Bank of Hungary to cut the policy rate by 25bp to 6.50%.
Economic and market news
In China, PBOC and financial regulators this morning unveiled a batch of new stimulus to lift the economy keeping aim at the 5% growth target for this year. At a rare economic briefing today, they announced reductions in both the policy rates as well as the Reserve Requirement Ratios, the first time these have been lowered on the same day. They also took new steps to support the housing market by lowering the requirement for down payment for second time buyers from 25% to 15%. And they announced that funds and brokers can tap PBOC to buy stocks. The measures were bigger than expected and gave a big lift to Chinese stocks, which are up close to 4% in the offshore market. Metal prices also saw a decent lift. This is, in our view, still not the big bazooka needed to finally turn things around. But it may be supplemented with fiscal policy measures and should at least give a short-term lift to Chinese growth. It is probably coming too late, though, for the government to reach its' 5% target. We expect 4.8% growth this year.
Euro area PMIs disappointed markets as both manufacturing and services declined more than expected, resulting in a composite figure that now suggests a contraction at 48.9 (cons: 50.5). The data suggested a softening labour market, likely driven by layoffs in a (very weak) German manufacturing, but also declining price pressure across all subcomponents. Note that French services had a large negative contribution which we attribute to a one-time post-Olympics' effect. Market reaction was for a weaker EUR while markets raised the probability of an October cut from the ECB to about 40%.
US PMIs were more in line with consensus as the composite PMI continued to signal solid growth, especially in services, though there were solid upticks in input prices. Manufacturing appeared much gloomier with firms reporting shrinking order books and growing inventories. On balance, the market reaction was to push up yields slightly with the 10Y treasury up some 5bps during the day.
Equities: Global equities were higher yesterday despite what could be described as less impressive macroeconomic numbers. This was accompanied by a slight cyclical outperformance and another day of higher yields at the long end. Please note the US 10-year yield has increased every single day since the Federal Reserve meeting last week. Yesterday, we observed a modest value outperformance, but more notably, small caps underperformed as yields continued to rise. In the US yesterday, the Dow was up +0.2%, the S&P 500 increased by +0.3%, the Nasdaq rose by +0.1%, and the Russell 2000 decreased by -0.3%. This morning, China unveiled significant fiscal and monetary loosening measures, somewhat akin to launching a little bazooka. These measures are primarily aimed at the property market but are also directly boosting equity markets. It is no surprise to see Chinese stocks reacting positively to the coordinated stimulus, with most neighbouring stock markets also showing gains this morning. European futures are up, while US futures are lower this morning.
FI: European yields tumbled yesterday on weaker than expected PMIs from France and Germany. While the French services PMI was below 50 (as expected, due to the construction of PMIs), a general weakness was observed in the PMIs, not least the employment section. Curves steepened from the front end, with 2s10s German yield spread dis-inverted now standing at 2bp. It is the first positive slope since 2022.
FX: This morning, Chinese authorities announced stimulus measures to try to prop up the economy. Asian stock markets reacted positively, notably Hang Seng rose more than 3%. The announcement sent USD/CNY toward 7.03. The EUR came under pressure vs its G10 peers after soft euro area PMI data. EUR/USD is just above 1.11 and EUR/GBP prints multi-year lows as it approaches 0.83. EUR/SEK moves toward the lower end of the 11.30-11.40 range while the recent positive NOK trend has brought EUR/NOK closer to 11.60. Muted reaction in the AUD immediately after RBA leaves rates unchanged at 4.35%.