Sample Category Title
China Announces Broad Monetary Stimulus
In focus today
In Germany, we receive the Ifo growth indicator for September. In August, the assessment of the business situation declined to the lowest level since Covid. We expect another benign print as the German economy continues to struggle with weak activity in the manufacturing sector.
In the afternoon, we expect the Central Bank of Hungary to cut the policy rate by 25bp to 6.50%.
Economic and market news
In China, PBOC and financial regulators this morning unveiled a batch of new stimulus to lift the economy keeping aim at the 5% growth target for this year. At a rare economic briefing today, they announced reductions in both the policy rates as well as the Reserve Requirement Ratios, the first time these have been lowered on the same day. They also took new steps to support the housing market by lowering the requirement for down payment for second time buyers from 25% to 15%. And they announced that funds and brokers can tap PBOC to buy stocks. The measures were bigger than expected and gave a big lift to Chinese stocks, which are up close to 4% in the offshore market. Metal prices also saw a decent lift. This is, in our view, still not the big bazooka needed to finally turn things around. But it may be supplemented with fiscal policy measures and should at least give a short-term lift to Chinese growth. It is probably coming too late, though, for the government to reach its' 5% target. We expect 4.8% growth this year.
Euro area PMIs disappointed markets as both manufacturing and services declined more than expected, resulting in a composite figure that now suggests a contraction at 48.9 (cons: 50.5). The data suggested a softening labour market, likely driven by layoffs in a (very weak) German manufacturing, but also declining price pressure across all subcomponents. Note that French services had a large negative contribution which we attribute to a one-time post-Olympics' effect. Market reaction was for a weaker EUR while markets raised the probability of an October cut from the ECB to about 40%.
US PMIs were more in line with consensus as the composite PMI continued to signal solid growth, especially in services, though there were solid upticks in input prices. Manufacturing appeared much gloomier with firms reporting shrinking order books and growing inventories. On balance, the market reaction was to push up yields slightly with the 10Y treasury up some 5bps during the day.
Equities: Global equities were higher yesterday despite what could be described as less impressive macroeconomic numbers. This was accompanied by a slight cyclical outperformance and another day of higher yields at the long end. Please note the US 10-year yield has increased every single day since the Federal Reserve meeting last week. Yesterday, we observed a modest value outperformance, but more notably, small caps underperformed as yields continued to rise. In the US yesterday, the Dow was up +0.2%, the S&P 500 increased by +0.3%, the Nasdaq rose by +0.1%, and the Russell 2000 decreased by -0.3%. This morning, China unveiled significant fiscal and monetary loosening measures, somewhat akin to launching a little bazooka. These measures are primarily aimed at the property market but are also directly boosting equity markets. It is no surprise to see Chinese stocks reacting positively to the coordinated stimulus, with most neighbouring stock markets also showing gains this morning. European futures are up, while US futures are lower this morning.
FI: European yields tumbled yesterday on weaker than expected PMIs from France and Germany. While the French services PMI was below 50 (as expected, due to the construction of PMIs), a general weakness was observed in the PMIs, not least the employment section. Curves steepened from the front end, with 2s10s German yield spread dis-inverted now standing at 2bp. It is the first positive slope since 2022.
FX: This morning, Chinese authorities announced stimulus measures to try to prop up the economy. Asian stock markets reacted positively, notably Hang Seng rose more than 3%. The announcement sent USD/CNY toward 7.03. The EUR came under pressure vs its G10 peers after soft euro area PMI data. EUR/USD is just above 1.11 and EUR/GBP prints multi-year lows as it approaches 0.83. EUR/SEK moves toward the lower end of the 11.30-11.40 range while the recent positive NOK trend has brought EUR/NOK closer to 11.60. Muted reaction in the AUD immediately after RBA leaves rates unchanged at 4.35%.
China Gets Serious About Boosting Growth
Support from the world’s major central banks, and the dovish expectations continue to rise this week. After lowering its 14-day reverse repo rate yesterday, the People’s Bank of China (PBoC) announced today that it will lower its 7-day reverse repo rate from 1.7% to 1.5% and its reserve rate – the amount of money that the banks should keep aside - by 50bp to unlock 1 trillion yuan in hope to boost growth. They also announced a package to support the housing market. That’s a lot measures announced all at the same time. Good news is that investors reacted positively to the stimulus measures, sending the CSI 300 and the Hang Seng index nearly 4% higher at the time of writing. Bad news is that the rebound in Chinese assets will likely remain fragile until the stimulus measures lead to concrete amelioration of the economic data.
More cuts
A few Federal Reserve (Fed) members spoke to back the idea that further rate cuts – and maybe big ones – are on the horizon in the US. Neel Kashkari expects two more 25bp cuts this year, while the Chicago Fed head Austan Goolsbee thinks that the Fed’s current policy rates are ‘hundreds’ of basis points above the neutral rate and that the Fed has a ‘long way to come down to get the interest rate to something like neutral to hold the conditions where they are’.
Released yesterday, the S&P’s PMI data showed that the economic activity grew in September but grew at a slower-than-expected pace; services did okay, but the slowdown in manufacturing accelerated. The mixed data demoralized less than the dovish Fed expectations boosted appetite. The US 2-year yield remained below the 3.60% level, the S&P500 consolidated near an ATH level, Nasdaq 100 and Dow Jones industrial index were bid. Only the Russell 2000 and oil didn’t see enough demand to carry their prices higher.
Oil was better bid in Asia
The barrel of US crude lost more than 1% yesterday despite the announcement of first stimulus measures from China and the rising geopolitical tensions between Israel and Lebanon. US crude sees support this morning above the $71pb level on the back of additional stimulus measures from China. But black gold’s timid rebound on rising central bank support from around the world and seriously mounting geopolitical tensions raises the questions regarding its upside potential. Strong resistance is still in play near the $72.85 level – the major 38.2% Fibonacci retracement, which should distinguish between the continuation of the actual bearish trend and a medium term bullish reversal for a return to $75/77pb range.
The yellow gold, on the other hand, was catapulted to a fresh ATH yesterday on the back of soft US yields and rising demand for the safety of gold due to the rising geopolitical worries in the Middle East. The RSI indicator flashes the overbought conditions, suggesting that gold has been bought to rapidly in a too short period of time and that a downside correction would be healthy at the current levels. Yet, confusion regarding whether the stock markets deserve to advance to fresh records while the Fed is rushing toward exiting its tightening policy and the tense geopolitical setup could help gold bulls overlook the overbought conditions for a little while.
ECB could cut more
A soft set of PMI data from the Eurozone revived the European Central Bank (ECB) doves on Monday. The latest data showed that euro area’s private sector shrank for the first time since March, the deterioration in German manufacturing accelerated and French services slipped into contraction in September, as the positive vibes from the Summer Olympics continued to fade. The soft data revived the idea that the ECB could, and should cut more thoroughly to give support to the sputtering European economies. The EURUSD sold off, tipped a toe below the 1.11 but rebounded above this level since than as the dollar bears came back in charge again. The French and Spanish CPI updates are due Friday. Sufficiently soft figures will likely keep the euro sold, even against a weakened US dollar.
RBA says nay
There is one central bank that stands out in the middle of a jungle of doves and that’s the Reserve Bank of Australia (RBA). The RBA kept its policy rate unchanged for the 7th consecutive meeting today and its Governor said that they don’t care about what the other central banks do, that they are focused on their domestic economy, that the board wants to see inflation come firmly back to 2-3% range and that they were not expecting to cut rates in the near future. Voila, that’s pretty clear.
The Aussie hit the highest level this year against the greenback on the back of the clear divergence between the RBA which refuses to cut rates, and the Fed where the bankers rush – maybe prematurely – toward rate cuts. Note that the Chinese stimulus news also carry the potential to give a boost to iron ore futures and the Aussie. All in all, supportive factors are gathering to pave the way for a further Aussie strength against both the greenback, the euro and the Japanese yen.
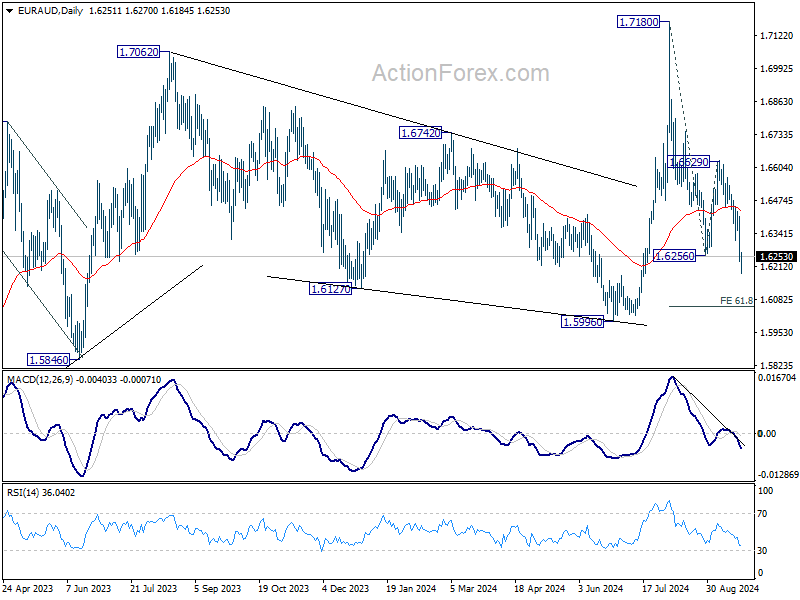
EUR/AUD Daily Outlook
Daily Pivots: (S1) 1.6182; (P) 1.6302; (R1) 1.6370; More...
EUR/AUD's fall from 1.7180 resumed by breaking through 1.6256 support. Intraday bias stays on the downside for 61.8% projection of 1.7180 to 1.6256 from 1.6629 at 1.6058, which is close to 1.5996 key support level. On the upside, above 1.6315 minor resistance will turn intraday bias neutral first. But outlook will remains bearish as long as 1.6629 resistance holds.
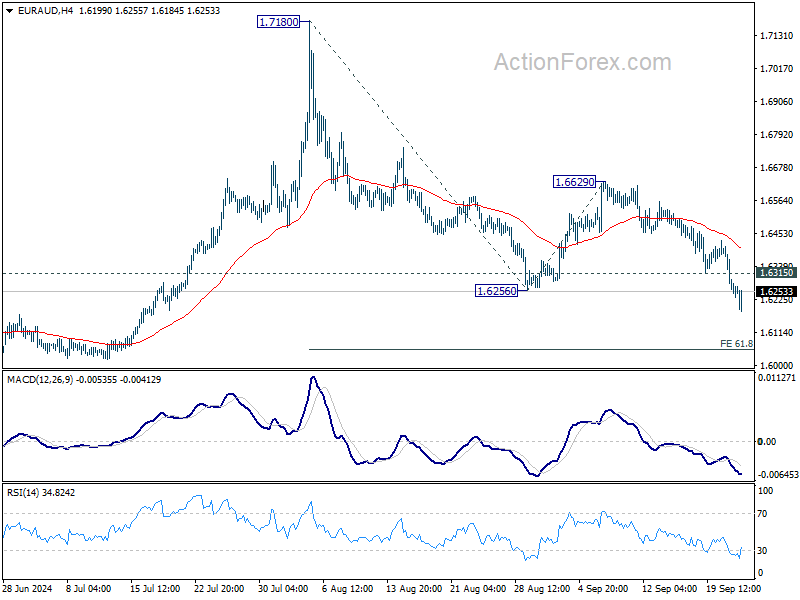
In the bigger picture, outlook is mixed up by the deeper than expected fall from 1.7180. Yet as long as 1.5996 support holds, up trend from 1.4281 (2022 low) is still in favor to resume at a later stage. Firm break of 1.7180 will pave the way to 61.8% projection of 1.4281 to 1.7062 from 1.5996 at 1.7715.
Aussie Jumps as RBA Holds Steady, Markets Lifted by China’s Stimulus Push
Australian Dollar surged broadly today following RBA's decision to leave interest rates unchanged at 4.35%, as widely expected. What caught the market's attention was RBA's continued focus on inflation risks, making it clear that the central bank is not considering a rate cut anytime soon. During the post-meeting press conference, Governor Michele Bullock downplayed the significance of tomorrow's monthly CPI data, describing them as volatile and less reflective of the underlying inflation trend. Nevertheless, she clarified that the board did not explicitly consider a rate hike at this meeting, signaling a steady approach for now
The broader market mood was lifted by China's announcement of an unexpectedly large stimulus package. The package includes a forthcoming 50 bps reduction in the reserve requirement ratio for banks, along with a cut in the seven-day reverse repurchase rate from 1.7% to 1.5%. Furthermore, PBoC indicated an intention to cut loan prime rates by 20 to 25 basis points, although the timeline for these moves remains unclear, and the details remain sparse. Additional measures were announced, such as reduced down payments for second homes, aimed at stimulating the property market. This is seen as China's most significant stimulus move since the pandemic's onset, but skepticism remains over whether the new measures will be sufficient to fully revitalize the struggling economy.
Overall in the currency markets, Australian Dollar continues to lead the pack, buoyed by both RBA's stance and positive risk sentiment from China's stimulus actions. New Zealand Dollar and Canadian Dollar also posted gains, reflecting broader risk-on sentiment. Meanwhile, Euro has fallen to the bottom of the performance chart after disappointing PMI data fueled speculation of a ECB rate cut as early as October. Japanese Yen and Dollar are also struggling, weighed down by a lack of safe-haven demand. Sterling and Swiss Franc sit in the middle of the currency performance spectrum.
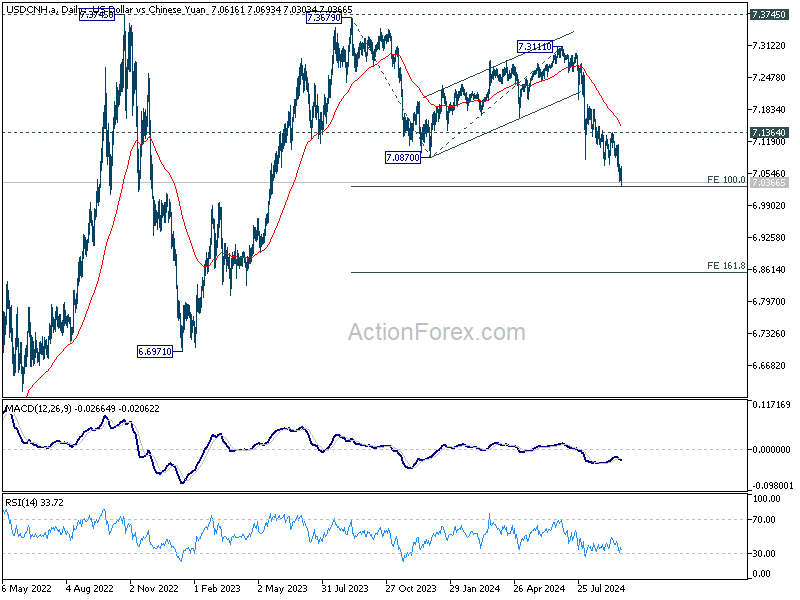
Technically, USD/CNH is now eyeing an important fibonacci level as down trend from 7.3745 (2023 high) extended. Some support could be seen from 100% projection of 7.3679 to 7.0870 from 7.3111 at 7.0302 to bring rebound. But firm break of 7.1364 resistance is needed to confirm short term bottoming. Otherwise, rise will stay on the downside. Decisive break of 7.0302 could prompt downside acceleration to 161.8% projection at 6.8566, even if fall from 7.3679 is just the third leg of the long term pattern from 7.3745.
In Asia, at the time of writing, Nikkei is up 0.83%. Hong Kong HSI is up 3.58%. China Shanghai SSE is up 3.55%. Singapore Strait Times is up 0.31%. Japan 10-year JGB yield is down -0.0421 at 0.822. Overnight, DOW rose 0.15%. S&P 500 rose 0.28%. NASDAQ rose 0.14%. 10-year yeild rose 0.011 to 3.739.
RBA holds rates at 4.35%, remains vigilant on inflation risks
RBA kept the cash rate target unchanged at 4.35% today, as widely anticipated by markets. The central bank stated that data since the August Statement on Monetary Policy have "reinforced the need to remain vigilant to upside risks to inflation." Maintaining its stance of "not ruling anything in or out," RBA emphasized its determination to return inflation to target levels and affirmed it will "do what is necessary."
Regarding the inflation outlook, RBA noted that headline inflation is expected to "fall further temporarily" due to federal and state cost-of-living relief measures. However, it does not foresee inflation returning sustainably to the 2–3% target range until 2026. This suggests that while short-term relief is expected, underlying inflationary pressures remain a concern over the medium term.
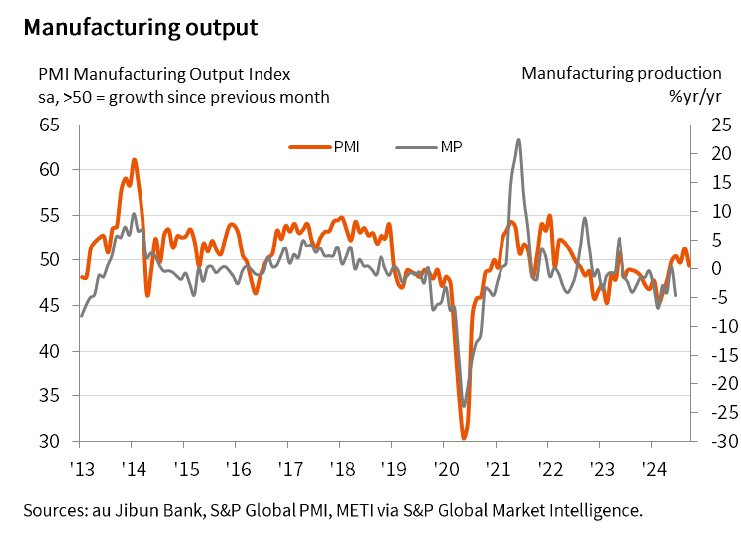
Japan's PMI manufacturing dips to 49.6, services rises to 53.9
Japan's PMI manufacturing index ticked down from 49.8 to 49.6, marking its third consecutive month in negative territory. On the other hand, services sector offered some relief as its PMI edged higher, rising from 53.7 to 53.9. Composite PMI slipped from 52.9 to 52.5, indicating a slight softening in growth momentum.
Usamah Bhatti, Economist at S&P Global Market Intelligence, noted that Japan's private sector expansion carried on through Q3, though at a slower pace. The expansion remained services-led, with the sector showing its strongest growth in five months, while manufacturing output fell back into contraction for the second time in three months.
Bhatti also highlighted that input cost inflation has eased to a six-month low, with both manufacturing and services firms reporting softer cost pressures. However, service providers are increasingly passing higher costs onto customers, as output price inflation ticked up slightly in September. Confidence in the future remains positive, but the overall sentiment has weakened to its lowest level since April 2022.
Fed's Goolsbee signals multiple rate cuts ahead as focus shifts to employment
Chicago Fed President Austan Goolsbee suggested at an event overnight that Fed will likely implement "many more rate cuts over the next year" as it shifts its focus from inflation to employment concerns.
Goolsbee further noted that a proactive approach is necessary to avoid potential disruptions in the labor market. "It's just not realistic to wait until problems show up," he said, highlighting the need for Fed to avoid being "behind the curve" in managing economic risks.
While the timing of the initial rate cut may be less critical, Goolsbee stressed the importance of a "longer-arc view" to ensure favorable conditions for both inflation and employment. He pointed out that "rates need to come down significantly going forward" to maintain economic stability.
Looking ahead
Germany Ifo business climate is the main feature in European session. Later in the day, US will release house price index and consumer confidence.
EUR/AUD Daily Outlook
Daily Pivots: (S1) 1.6182; (P) 1.6302; (R1) 1.6370; More...
EUR/AUD's fall from 1.7180 resumed by breaking through 1.6256 support. Intraday bias stays on the downside for 61.8% projection of 1.7180 to 1.6256 from 1.6629 at 1.6058, which is close to 1.5996 key support level. On the upside, above 1.6315 minor resistance will turn intraday bias neutral first. But outlook will remains bearish as long as 1.6629 resistance holds.
In the bigger picture, outlook is mixed up by the deeper than expected fall from 1.7180. Yet as long as 1.5996 support holds, up trend from 1.4281 (2022 low) is still in favor to resume at a later stage. Firm break of 1.7180 will pave the way to 61.8% projection of 1.4281 to 1.7062 from 1.5996 at 1.7715.
Economic Indicators Update
| GMT | CCY | EVENTS | ACT | F/C | PP | REV |
|---|---|---|---|---|---|---|
| 00:30 | JPY | Manufacturing PMI Sep P | 49.6 | 49.9 | 49.8 | |
| 00:30 | JPY | Services PMI Sep P | 53.9 | 53.7 | ||
| 04:30 | AUD | RBA Interest Rate Decision | 4.35% | 4.35% | 4.35% | |
| 05:30 | AUD | RBA Press Conference | ||||
| 08:00 | EUR | Germany IFO Business Climate Sep | 86.1 | 86.6 | ||
| 08:00 | EUR | Germany IFO Current Assessment Sep | 86 | 86.5 | ||
| 08:00 | EUR | Germany IFO Expectations Sep | 86.3 | 86.8 | ||
| 13:00 | USD | S&P/CS Composite-20 HPI Y/Y Jul | 5.90% | 6.50% | ||
| 13:00 | USD | Housing Price Index M/M Jul | 0.20% | -0.10% | ||
| 14:00 | USD | Consumer Confidence Sep | 103.5 | 103.3 |
RBA holds rates at 4.35%, remains vigilant on inflation risks
RBA kept the cash rate target unchanged at 4.35% today, as widely anticipated by markets. The central bank stated that data since the August Statement on Monetary Policy have "reinforced the need to remain vigilant to upside risks to inflation." Maintaining its stance of "not ruling anything in or out," RBA emphasized its determination to return inflation to target levels and affirmed it will "do what is necessary."
Regarding the inflation outlook, RBA noted that headline inflation is expected to "fall further temporarily" due to federal and state cost-of-living relief measures. However, it does not foresee inflation returning sustainably to the 2–3% target range until 2026. This suggests that while short-term relief is expected, underlying inflationary pressures remain a concern over the medium term.
(RBA) Statement by the Reserve Bank Board: Monetary Policy Decisions
At its meeting today, the Board decided to leave the cash rate target unchanged at 4.35 per cent and the interest rate paid on Exchange Settlement balances unchanged at 4.25 per cent.
Inflation remains above target and is proving persistent.
Inflation has fallen substantially since the peak in 2022, as higher interest rates have been working to bring aggregate demand and supply closer towards balance. But inflation is still some way above the midpoint of the 2–3 per cent target range. In underlying terms, as represented by the trimmed mean, inflation was 3.9 per cent over the year to the June quarter, broadly as forecast in the May Statement on Monetary Policy (SMP). Headline inflation declined in July, as measured by the monthly CPI indicator. Headline inflation is expected to fall further temporarily, as a result of federal and state cost of living relief. However, our current forecasts do not see inflation returning sustainably to target until 2026. In year-ended terms, underlying inflation has been above the midpoint of the target for 11 consecutive quarters and has fallen very little over the past year.
The outlook remains highly uncertain.
The central forecasts published in August were for underlying inflation to return to the target range of 2–3 per cent late in 2025 and approach the midpoint in 2026. This reflected a judgement that the economy’s capacity to meet demand was somewhat weaker than previously thought, evidenced by the persistence of inflation and ongoing strength in the labour market.
Since then, GDP data for the June quarter have confirmed that growth has been weak. Earlier declines in real disposable incomes and the ongoing effect of restrictive financial conditions continue to weigh on consumption, particularly discretionary consumption. However, growth in aggregate consumer demand, which includes spending by temporary residents such as students and tourists, remained more resilient.
Wage pressures have eased somewhat but labour productivity is still only at 2016 levels, despite the pickup over the past year.
Broader indicators suggest that labour market conditions remain tight, despite some signs of gradual easing. Over the three months to August, employment grew on average by 0.3 per cent per month. The unemployment rate remained at 4.2 per cent in August, up from the trough of 3.5 per cent in mid-2023. But the participation rate remains at record highs, vacancies remain elevated and average hours worked have stabilised.
Taken together, the latest data do not change the Board’s assessment at the August meeting that policy is currently restrictive and working broadly as anticipated. But there are uncertainties. The central projection is for household consumption growth to pick up in the second half of the year as the headwinds to income growth recede – but there is a risk that this pickup is slower than expected, resulting in continued subdued output growth and a sharper deterioration in the labour market. More broadly, there are uncertainties regarding the lags in the effects of monetary policy and how firms’ pricing decisions and wages will respond to the slower growth in the economy at a time of excess demand, and while conditions in the labour market remain tight.
There also remains a high level of uncertainty about the outlook abroad. Some central banks have eased policy, although they note that they are removing only some restrictiveness and remain alert to risks on both sides, namely weaker labour markets and stronger inflation. The outlook for the Chinese economy has softened and this has been reflected in commodity prices. Geopolitical uncertainties remain pronounced.
Returning inflation to target is the priority.
Sustainably returning inflation to target within a reasonable timeframe remains the Board’s highest priority. This is consistent with the RBA’s mandate for price stability and full employment. To date, longer term inflation expectations have been consistent with the inflation target and it is important that this remain the case.
While headline inflation will decline for a time, underlying inflation is more indicative of inflation momentum, and it remains too high. The most recent projections in the August SMP show that it will be some time yet before inflation is sustainably in the target range. Data since then have reinforced the need to remain vigilant to upside risks to inflation and the Board is not ruling anything in or out. Policy will need to be sufficiently restrictive until the Board is confident that inflation is moving sustainably towards the target range.
The Board will continue to rely upon the data and the evolving assessment of risks to guide its decisions. In doing so, it will pay close attention to developments in the global economy and financial markets, trends in domestic demand, and the outlook for inflation and the labour market. The Board remains resolute in its determination to return inflation to target and will do what is necessary to achieve that outcome.
Bitcoin Price Could Be Ready for Bigger Gains, Gold Sets New ATH
Key Highlights
- Bitcoin price gained over 15% in the past few days.
- BTC is trading above a connecting bullish trend line with support at $61,500 on the 4-hour chart.
- Oil prices corrected losses and climbed above the $71.20 resistance.
- Gold surged to a new all-time high above $2,630.
Bitcoin Price Technical Analysis
Bitcoin price started a decent upward move above the $60,000 pivot zone. BTC/USD climbed above the $62,500 resistance to move into a positive zone.
Looking at the 4-hour chart, the price settled above the 200 simple moving average (green, 4 hours) and the 100 simple moving average (red, 4 hours). It even spiked above $64,000 before it faced resistance.
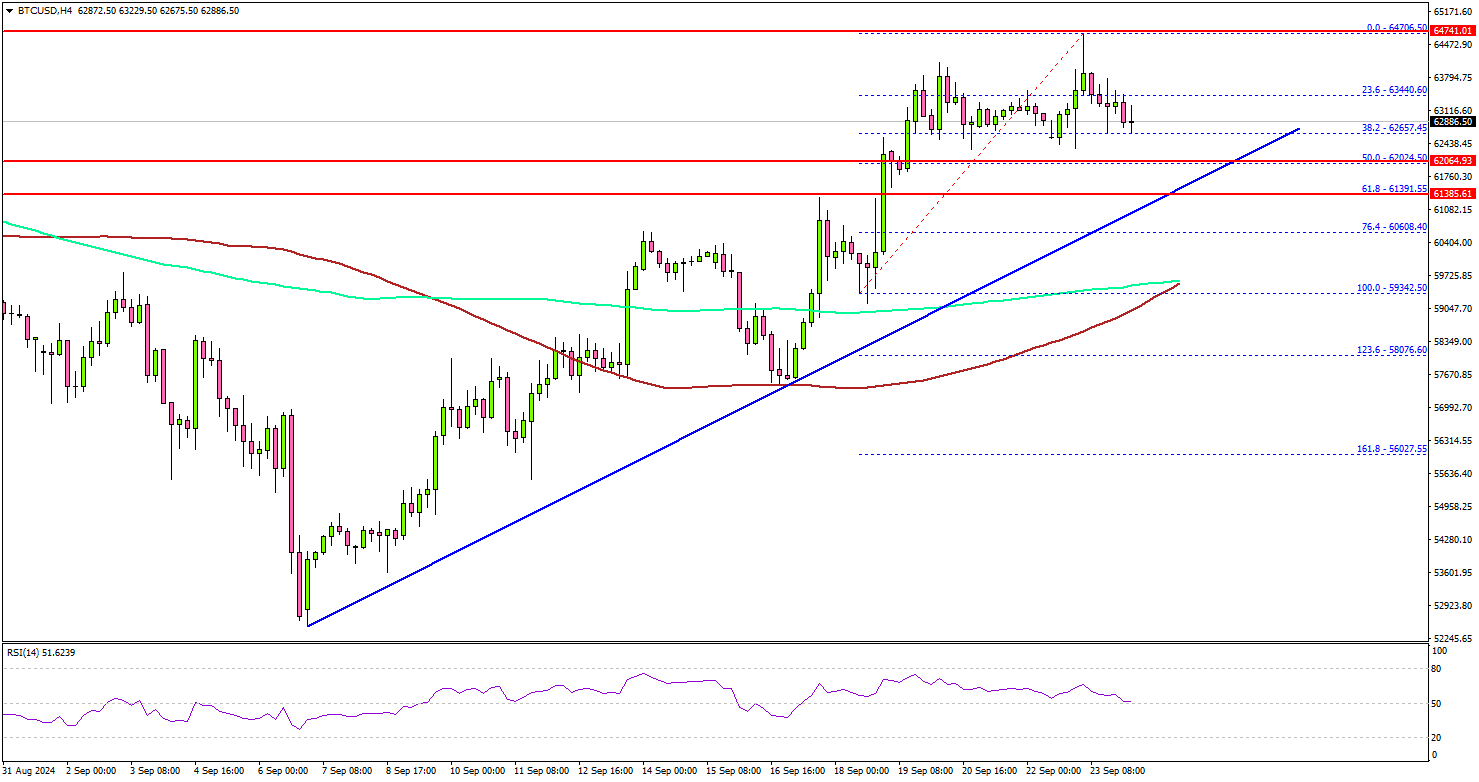
The price is now consolidating gains below $64,200. Immediate support is near the $62,500 level. The next key support sits at $62,000. There is also a connecting bullish trend line with support at $61,500 on the same chart.
The trend line is close to the 50% Fib retracement level of the upward move from the $59,330 swing low to the $64,200 swing high. A downside break below $61,500 might send Bitcoin toward the $60,000 support. Any more losses might send the price toward the $58,500 support zone.
On the upside, the price could face resistance near the $64,200 level. The next key resistance is at $65,000. A successful close above $65,000 might start another steady increase. In the stated case, the price may perhaps rise toward the $66,500 level.
Looking at gold, the price extended gains above the $2,600 level and traded to a new all-time high above the $2,630 level.
Today’s Economic Releases
- US House Price Index for July 2024 (MoM) - Forecast +0.2%, versus +0.8% previous.
- S&P/Case-Shiller Home Price Indices for July 2024 (YoY) - Forecast +5.8%, versus +6.5% previous.
Japan’s PMI manufacturing dips to 49.6, services rises to 53.9
Japan’s PMI manufacturing index ticked down from 49.8 to 49.6, marking its third consecutive month in negative territory. On the other hand, services sector offered some relief as its PMI edged higher, rising from 53.7 to 53.9. Composite PMI slipped from 52.9 to 52.5, indicating a slight softening in growth momentum.
Usamah Bhatti, Economist at S&P Global Market Intelligence, noted that Japan’s private sector expansion carried on through Q3, though at a slower pace. The expansion remained services-led, with the sector showing its strongest growth in five months, while manufacturing output fell back into contraction for the second time in three months.
Bhatti also highlighted that input cost inflation has eased to a six-month low, with both manufacturing and services firms reporting softer cost pressures. However, service providers are increasingly passing higher costs onto customers, as output price inflation ticked up slightly in September. Confidence in the future remains positive, but the overall sentiment has weakened to its lowest level since April 2022.
Fed’s Goolsbee signals multiple rate cuts ahead as focus shifts to employment
Chicago Fed President Austan Goolsbee suggested at an event overnight that Fed will likely implement "many more rate cuts over the next year" as it shifts its focus from inflation to employment concerns.
Goolsbee further noted that a proactive approach is necessary to avoid potential disruptions in the labor market. "It’s just not realistic to wait until problems show up," he said, highlighting the need for Fed to avoid being "behind the curve" in managing economic risks.
While the timing of the initial rate cut may be less critical, Goolsbee stressed the importance of a "longer-arc view" to ensure favorable conditions for both inflation and employment. He pointed out that "rates need to come down significantly going forward" to maintain economic stability.
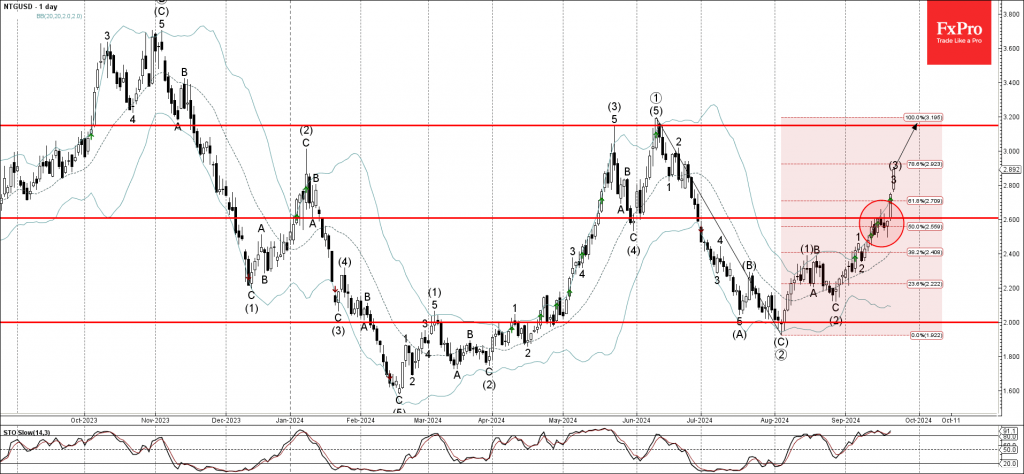
Natural Gas Wave Analysis
- Natural Gas rising inside impulse waves 3 and (3)
- Likely to reach resistance level 3.150
Natural Gas continues to rise inside the impulse waves 3 and (3), which recently broke the resistance area located between the key resistance level 2.600 and the 50% Fibonacci correction of the downward impulse from June.
The breakout of this resistance area accelerated the active impulse waves 3 and (3) – which belong to the primary impulse sequence 3 from the start of August.
Given the clear daily uptrend, Natural Gas can be expected to rise further to the next resistance level 3.150, former monthly high from May and June.