
Sample Category Title
USD/CHF Mid-Day Outlook
Daily Pivots: (S1) 0.8449; (P) 0.8484; (R1) 0.8510; More…
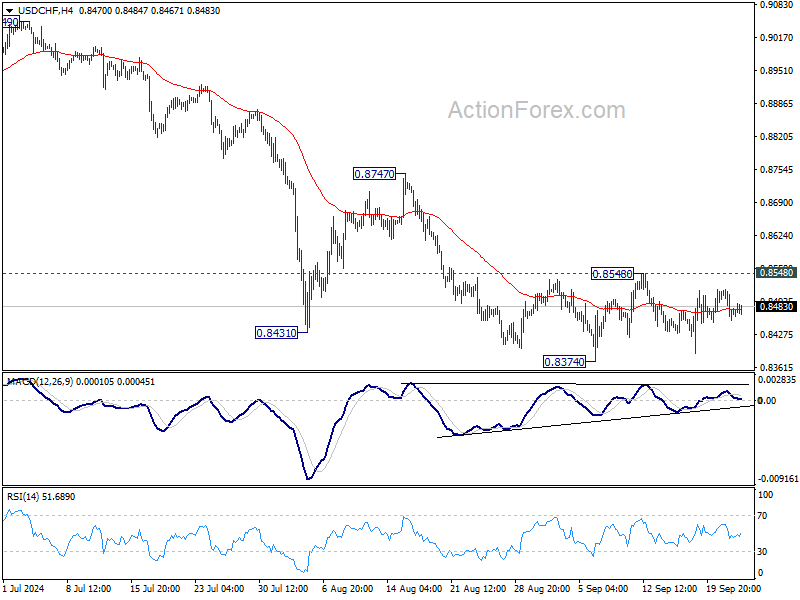
USD/CHF is still extending range trading from 0.8374 and intraday bias remains neutral. On the downside, break of 0.8374 will resume the fall from 0.9223 to retest 0.8332 low. Decisive break there will indicate larger down trend resumption. However, considering bullish convergence condition in 4H MACD, break of 0.8548 resistance will confirm short term bottoming, and turn bias back to the upside for 0.8747 resistance.
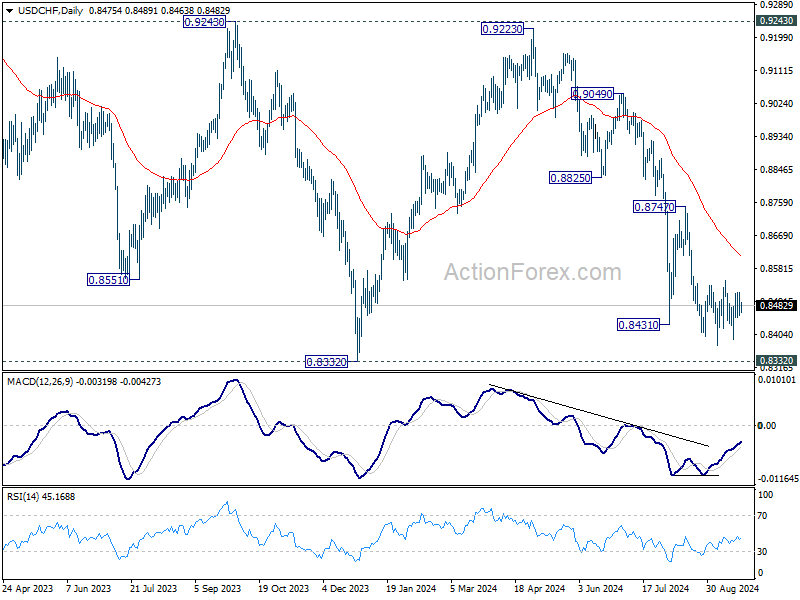
In the bigger picture, price actions from 0.8332 (2023 low) are currently seen as a medium term corrective pattern, with fall from 0.9223 as the second leg. Strong support could be seen from 0.8332 to bring rebound. Yet, overall outlook will continue to stay bearish as long as 0.9243 resistance holds. Firm break of 0.8332, however, will resume larger down trend from 1.0146 (2022 high).
USD/JPY Mid-Day Outlook
Daily Pivots: (S1) 143.02; (P) 143.74; (R1) 144.32; More...
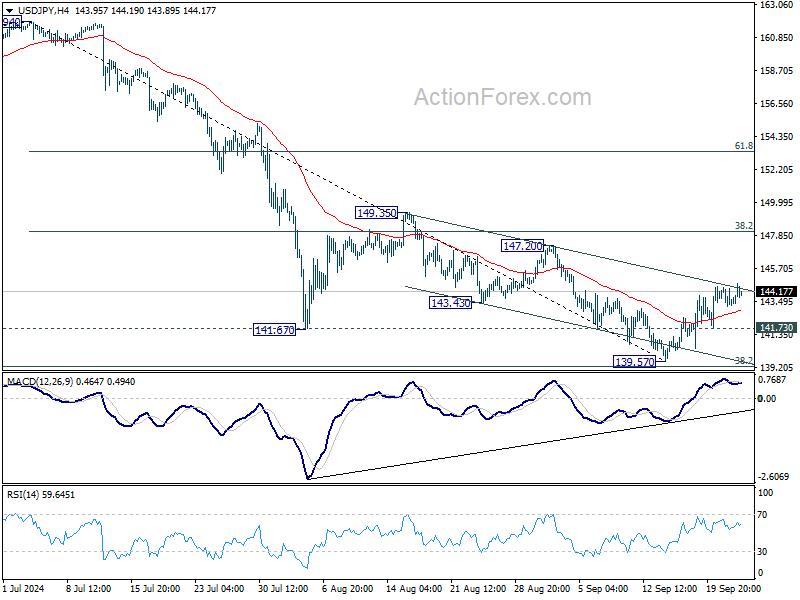
Despite loss of upside momentum as seen in 4H MACD, further rise is still in favor in USD/JPY with 141.73 minor support intact. Rebound from 139.57 short term bottom should extend to 38.2% retracement of 161.94 to 139.57 at 148.11. On the downside, below 141.73 will turn bias to the downside for retesting 139.57 instead.
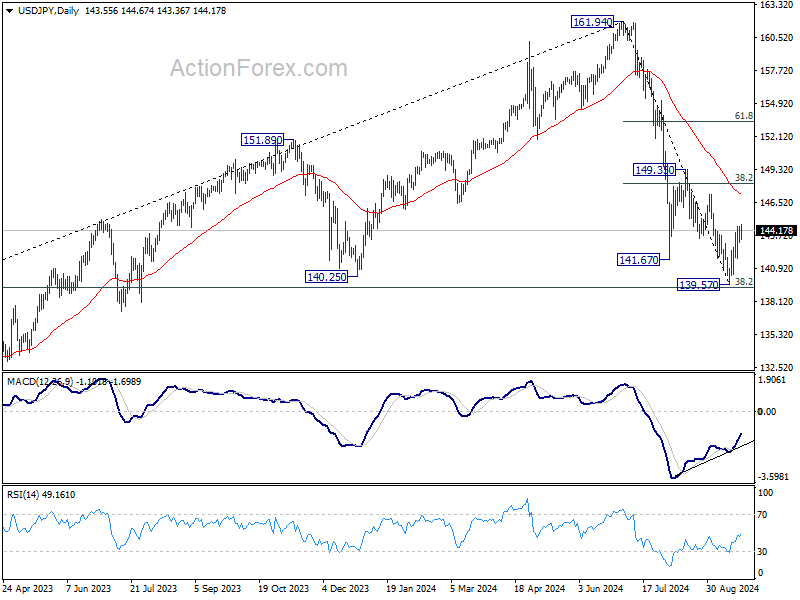
In the bigger picture, fall from 161.94 medium term top is seen as correcting whole up trend from 102.58 (2021 low). Strong support could be seen from 38.2% retracement of 102.58 to 161.94 at 139.26 to contain downside, at least on first attempt. But in any case, risk will stay on the downside as long as 149.35 resistance holds. Sustained break of 139.26 would open up deeper medium term decline to 61.8% retracement at 125.25.
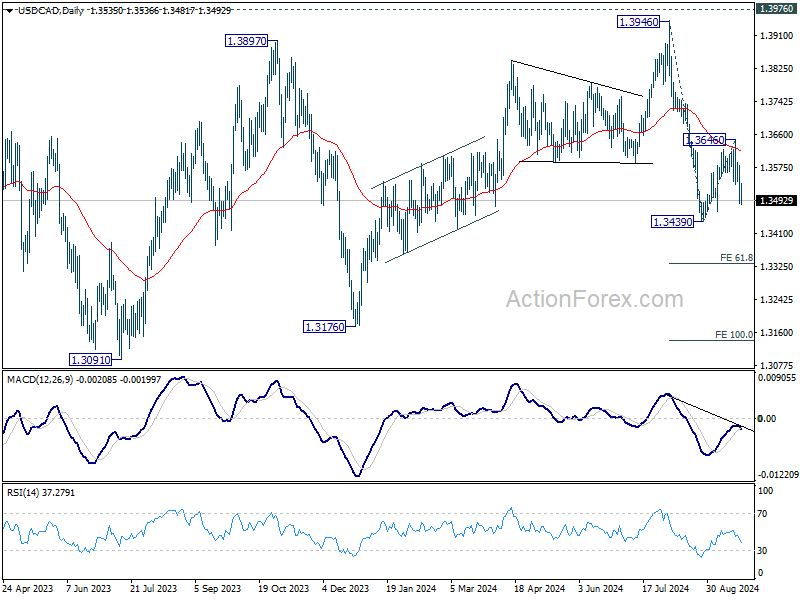
USD/CAD Mid-Day Outlook
Daily Pivots: (S1) 1.3493; (P) 1.3538; (R1) 1.3588; More...
Intraday bias in USD/CAD stays on the downside for retesting 1.3439 low. Firm break there will resume the decline from 1.3946, and target 61.8% projection of 1.3946 to 1.3439 from 1.3646 at 1.3333. On the upside, above 1.3540 minor resistance will turn intraday bias neutral first. But risk will stay on the downside as long as 1.3646 resistance holds, in case of recovery.
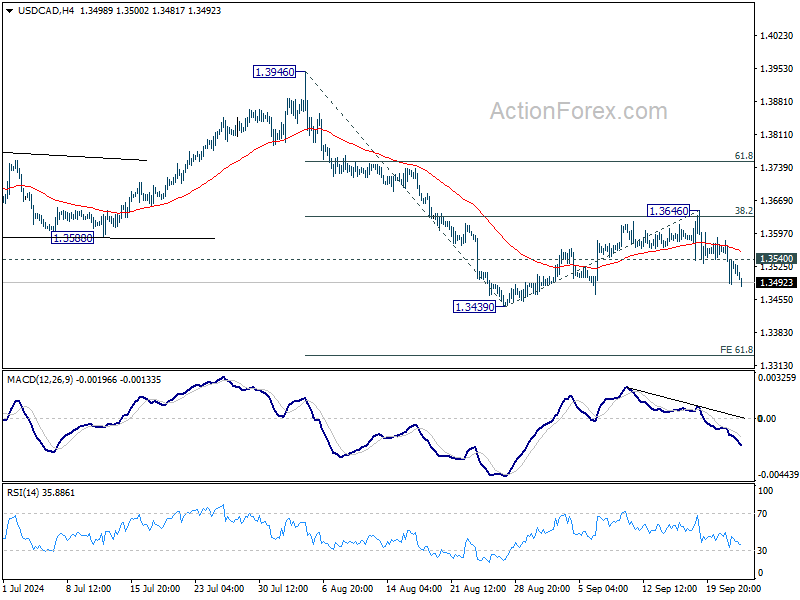
In the bigger picture, corrective pattern from 1.3976 (2022 high) is extending with another falling leg. While deeper decline could be seen, strong support should emerge above 1.2947 resistance turned support to bring rebound. Rise from 1.2005 (2021 low) is still in favor to resume at a later stage.
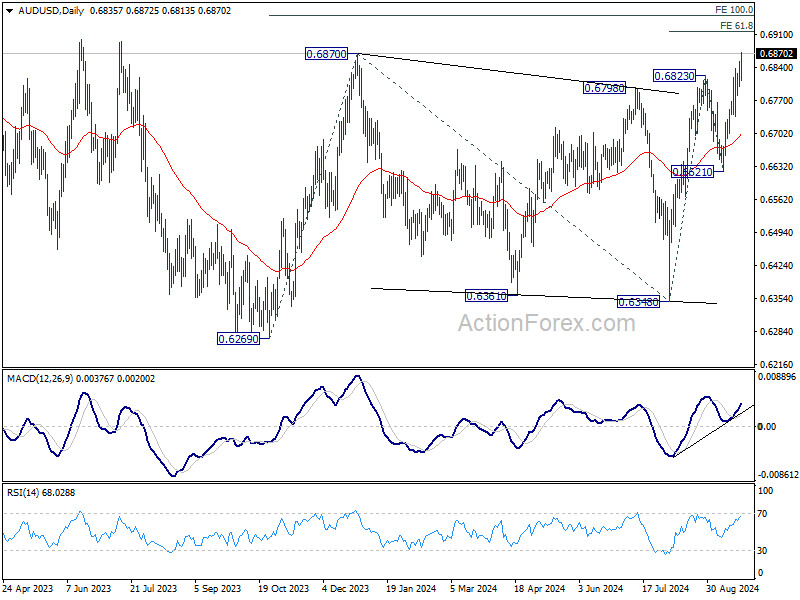
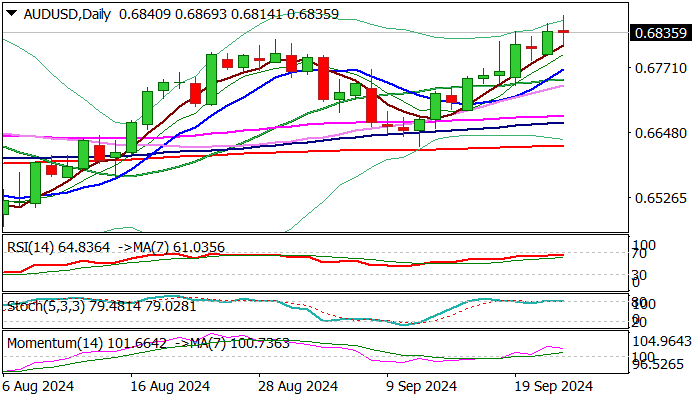
AUD/USD Mid-Day Report
Daily Pivots: (S1) 0.6806; (P) 0.6830; (R1) 0.6862; More...
AUD/USD's rally is still in progress and intraday bias remains on the upside for 61.8% projection of 0.6348 to 0.6823 from 0.6621 at 0.6915. On the downside, below 0.6736 minor support will turn intraday bias neutral first. But outlook will remain cautiously bullish as long as 0.6621 support holds, in case of retreat.
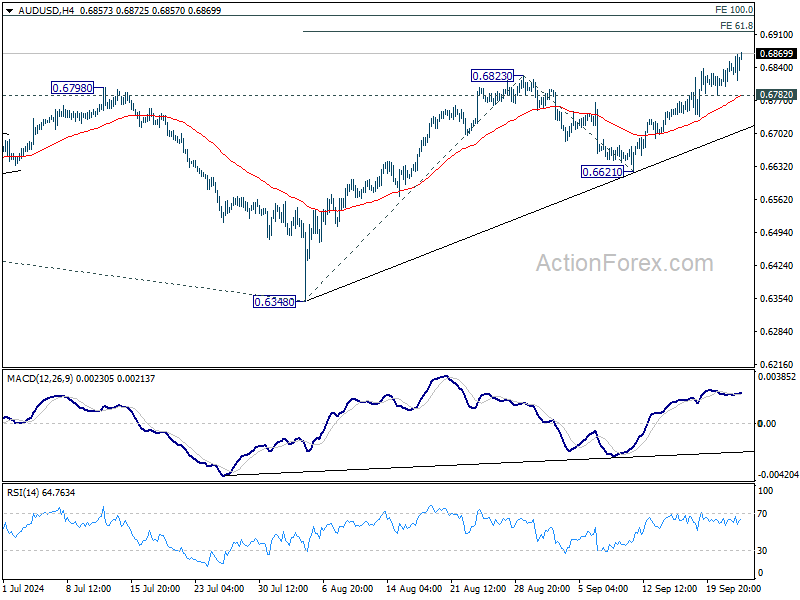
In the bigger picture, overall, price actions from 0.6169 (2022 low) are seen as a medium term corrective pattern, with rise from 0.6269 as the third leg. Firm break of 6870 resistance will target 100% projection of 0.6269 to 0.6870 from 0.6340 at 0.6941. In case of another fall, strong support should be seen from 0.6169/6348 to bring rebound.
Aussie Stays Firm With Copper’s Rally Giving Extra Support
The forex market continues to display a mild risk-on mood, with commodity-linked currencies Australian, New Zealand, and Canadian Dollars gaining ground. In contrast, safe-haven currencies Japanese Yen, Swiss Franc, and Dollar are under pressure.
Australian Dollar jumps earlier today following RBA's decision to hold rates steady, combined with China's broad stimulus package aimed at boosting its sluggish economy. Despite this, New Zealand Dollar has taken the lead as the strongest currency of the day, with Canadian Dollar following closely behind in third place.
Japanese Yen remains the weakest performer, weighed down by rising yields in both the US and Europe. BoJ Governor Kazuo Ueda also reinforced a cautious stance, signaling that the central bank is in no hurry to raise rates, which only adds to Yen's decline. Swiss Franc, meanwhile, is the second weakest, as traders await Thursday's SNB rate decision, with growing speculation that the central bank could opt for a larger-than-expected 50bps rate cut.
Dollar is struggling to rebound rebound but remains confined within a narrow range against Euro, suggesting no significant selling yet. Meanwhile, Euro and British Pound are hovering in the middle, with Euro managing to shrug off disappointing German Ifo report. Although there is growing chatter of an ECB rate cut in October, no clear consensus has emerged.
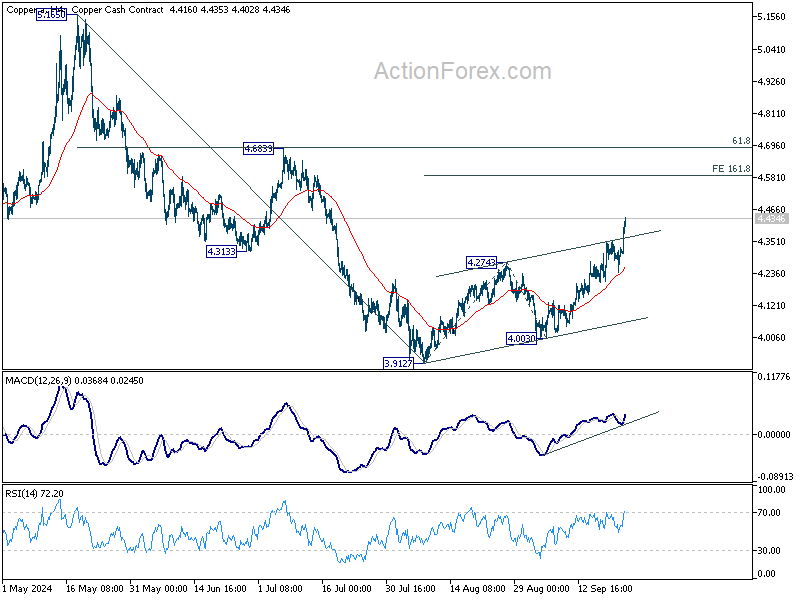
Technically, Copper surges sharply higher on news of China's stimulus. The strong break of near term channel resistance indicates upside acceleration. Further rally should be seen to 161.8% projection of 3.9127 to 4.2743 from 4.0030 at 4.5581. But to confirm reversal of whole down trend from 5.1650, firm break of 4.6839 cluster resistance (61.8% retracement of 5.1650 to 3.9127 at 4.6866) is needed. But in either case, extended rally in Copper would give Aussie an extra lift.
In Europe, at the time of writing, FTSE is up 0.21%. DAX is up 0.50%. CAC is up 1.24%. UK 10-year yield is up 0.0870 at 4.011. Germany 10-year yield is up 0.041 at 2.197. Earlier in Asia, Nikkei rose 0.57%. Hong Kong HSI Rose 4.13%. China Shanghai SSE rose 4.15%. Singapore Strait Times fell -0.43%. Japan 10-year JGB yield fell -0.0532 to 0.811.
ECB's Muller cautious on Oct rate decision, eyes Dec for clearer outlook
ECB Governing Council member Madis Muller struck a cautious tone in comments to Bloomberg, noting that it is "too early to express a clear position" regarding the upcoming October rate decision. While a rate cut cannot be entirely ruled out, Muller suggested that the December meeting would provide a clearer picture, supported by updated economic forecasts.
Muller emphasized that recent data signals downside risks for the Eurozone, highlighting a "weaker near-term outlook" for economic growth. He stated, "There's a bigger probability that economic growth will be lower, not higher, than the expected number outlined in the ECB's base-case scenario."
Despite some positive developments, such as the recent slowdown in wage growth, Muller remained concerned about persistently high services inflation. "On the one hand, wage growth has slowed, which implies that inflationary pressures could be lower looking ahead," he said. "On the other hand, services inflation was very fast according to the latest data. I'd like to see that slow down further."
Germany's Ifo falls to 85.4 as economic pressure mounts
Germany's Ifo Business Climate Index dropped from 86.6 to 85.4 in September, falling below market expectations of 86.1. This decline signals rising concerns for the German economy as key sectors show signs of strain. Current Assessment Index also fell, from 86.5 to 84.4, missing forecasts of 86.0. However, Expectations Index, which reflects sentiment about future economic conditions, remained relatively stable, easing only slightly from 86.8 to 86.3, in line with expectations.
Sectoral data shows widespread weakness. The manufacturing sector posted a significant drop from -17.8 to -21.6, while the services sector also deteriorated, falling from -1.3 to -3.5. The trade sector saw a deeper contraction, with the index dropping from -27.4 to -29.8. On the other hand, construction provided a rare positive, showing a slight improvement from -26.8 to -25.2.
According to the Ifo Institute, "The German economy is coming under ever-increasing pressure." With multiple sectors showing increasing strain, the data suggests the German economy could remain in a precarious position, adding to recession concerns as the Eurozone's overall economic prospects look uncertain.
RBA holds rates at 4.35%, remains vigilant on inflation risks
RBA kept the cash rate target unchanged at 4.35% today, as widely anticipated by markets. The central bank stated that data since the August Statement on Monetary Policy have "reinforced the need to remain vigilant to upside risks to inflation." Maintaining its stance of "not ruling anything in or out," RBA emphasized its determination to return inflation to target levels and affirmed it will "do what is necessary."
Regarding the inflation outlook, RBA noted that headline inflation is expected to "fall further temporarily" due to federal and state cost-of-living relief measures. However, it does not foresee inflation returning sustainably to the 2–3% target range until 2026. This suggests that while short-term relief is expected, underlying inflationary pressures remain a concern over the medium term.
BoJ's Ueda signals no rush to hike rates amid global uncertainties
In a speech today, BoJ Governor emphasized that the central bank will need to thoroughly assess factors such as financial and capital market developments both domestically and internationally, as well as the broader global economic environment. Importantly, Ueda indicated that there is "enough time" to make these evaluations, suggesting that BoJ is not in a hurry to raise interest rates again.
Ueda reaffirmed BoJ's commitment to adjusting its policy based on its economic and inflation outlook, stating that if the projections in the Outlook Report are met, the BoJ would indeed raise the policy interest rate. However, he also stressed the unpredictability of the current environment.
"Given the high uncertainties surrounding economic activity and prices, unexpected situations may occur," Ueda noted, adding that policy actions will need to be timely and flexible rather than adhering to any "fixed schedule."
Ueda further commented on Yen, noting that the recent one-sided depreciation has been partially retraced since August. This, along with a slowdown in the rise of import prices, has reduced the upside risk to inflation driven by higher import costs.
Japan's PMI manufacturing dips to 49.6, services rises to 53.9
Japan's PMI manufacturing index ticked down from 49.8 to 49.6, marking its third consecutive month in negative territory. On the other hand, services sector offered some relief as its PMI edged higher, rising from 53.7 to 53.9. Composite PMI slipped from 52.9 to 52.5, indicating a slight softening in growth momentum.
Usamah Bhatti, Economist at S&P Global Market Intelligence, noted that Japan's private sector expansion carried on through Q3, though at a slower pace. The expansion remained services-led, with the sector showing its strongest growth in five months, while manufacturing output fell back into contraction for the second time in three months.
Bhatti also highlighted that input cost inflation has eased to a six-month low, with both manufacturing and services firms reporting softer cost pressures. However, service providers are increasingly passing higher costs onto customers, as output price inflation ticked up slightly in September. Confidence in the future remains positive, but the overall sentiment has weakened to its lowest level since April 2022.
AUD/USD Mid-Day Report
Daily Pivots: (S1) 0.6806; (P) 0.6830; (R1) 0.6862; More...
AUD/USD's rally is still in progress and intraday bias remains on the upside for 61.8% projection of 0.6348 to 0.6823 from 0.6621 at 0.6915. On the downside, below 0.6736 minor support will turn intraday bias neutral first. But outlook will remain cautiously bullish as long as 0.6621 support holds, in case of retreat.
In the bigger picture, overall, price actions from 0.6169 (2022 low) are seen as a medium term corrective pattern, with rise from 0.6269 as the third leg. Firm break of 6870 resistance will target 100% projection of 0.6269 to 0.6870 from 0.6340 at 0.6941. In case of another fall, strong support should be seen from 0.6169/6348 to bring rebound.
Economic Indicators Update
| GMT | CCY | EVENTS | ACT | F/C | PP | REV |
|---|---|---|---|---|---|---|
| 00:30 | JPY | Manufacturing PMI Sep P | 49.6 | 49.9 | 49.8 | |
| 00:30 | JPY | Services PMI Sep P | 53.9 | 53.7 | ||
| 04:30 | AUD | RBA Interest Rate Decision | 4.35% | 4.35% | 4.35% | |
| 05:30 | AUD | RBA Press Conference | ||||
| 08:00 | EUR | Germany IFO Business Climate Sep | 85.4 | 86.1 | 86.6 | |
| 08:00 | EUR | Germany IFO Current Assessment Sep | 84.4 | 86 | 86.5 | |
| 08:00 | EUR | Germany IFO Expectations Sep | 86.3 | 86.3 | 86.8 | |
| 13:00 | USD | S&P/CS Composite-20 HPI Y/Y Jul | 5.90% | 5.90% | 6.50% | |
| 13:00 | USD | Housing Price Index M/M Jul | 0.10% | 0.20% | -0.10% | 0.00% |
| 14:00 | USD | Consumer Confidence Sep | 103.5 | 103.3 |
ECB’s Muller cautious on Oct rate decision, eyes Dec for clearer outlook
ECB Governing Council member Madis Muller struck a cautious tone in comments to Bloomberg, noting that it is "too early to express a clear position" regarding the upcoming October rate decision. While a rate cut cannot be entirely ruled out, Muller suggested that the December meeting would provide a clearer picture, supported by updated economic forecasts.
Muller emphasized that recent data signals downside risks for the Eurozone, highlighting a "weaker near-term outlook" for economic growth. He stated, "There's a bigger probability that economic growth will be lower, not higher, than the expected number outlined in the ECB's base-case scenario."
Despite some positive developments, such as the recent slowdown in wage growth, Muller remained concerned about persistently high services inflation. "On the one hand, wage growth has slowed, which implies that inflationary pressures could be lower looking ahead," he said. "On the other hand, services inflation was very fast according to the latest data. I'd like to see that slow down further."
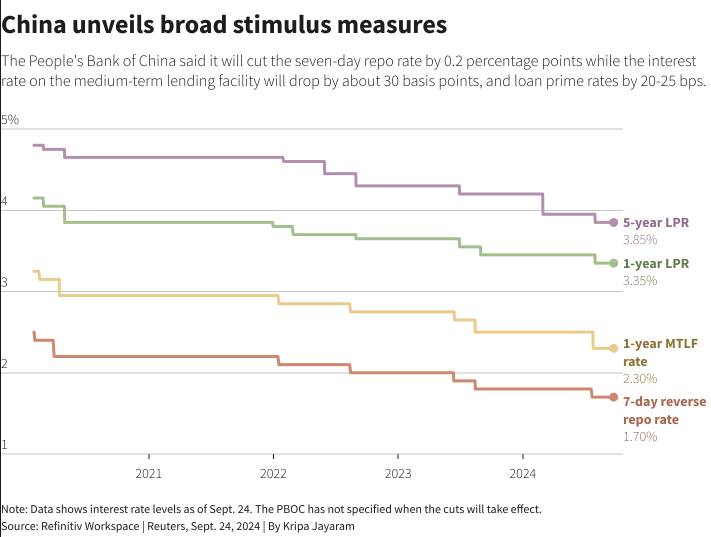
China Slashes Rates – Stimulus Package by PBoC Welcomed by Markets
- The People’s Bank of China (PBoC) has unveiled a stimulus package aimed at boosting economic growth.
- Key measures include a cut in the 7-day repo rate, a reduction in the required reserve ratio (RRR), and support for the mortgage market and property sector.
- Asian and European stock markets have reacted positively to the stimulus as markets welcomed the news.
- Oil prices have risen as well and could benefit from the stimulus package. Will the Oil price recovery continue?
The People’s Bank of China (PBoC) in a surprise briefing this morning unveiled a massive stimulus package in an effort to reach its growth targets. The jury is out on whether these measures will suffice but the initial reaction has been a positive one.
Asian stocks rose to a two and half year high with the Hang Seng Index rising as much as 3.2% and the blue-chip CSI 300 Index rising around 2.4%. The effect has filtered through to the European open as well with stocks in the luxury goods and mining segments in particular benefitting. Overall this is a positive for market sentiment at an important time.
The most important announcement by the PBoC is probably the 20bps cut to the 7-day repo rate. This would make it cheaper for banks to borrow money and thus businesses and individuals will benefit as well. The idea would be that cheaper loans could help boost spending on goods and services.
The other notable measures from the PBoC:
- A 50 basis point reduction in the required reserve ratio (RRR) lowers the RRR for major banks from 10.0% to 9.5%. (This move in conjunction with the others could help spur on weakening credit activity moving forward.)
- Support mortgage market. Outstanding mortgage rates to be cut. Second home purchases min downpayment from 25% to 15%.
- Funding support to be increase from 60% to 100% for property. Central support will increase for unsold homes.
- Will establish new monetary policy rules to support the stability and development of the stock market. Companies to have increased access to liquidity.
The property market has been a particular area of focus for Chinese authorities and global market participants. Last months weak property price data further exacerbated those concerns so it is no surprise that the PBoC has made an effort to bring back stability to an important pillar of the economy.
Moving forward it will be important to see some stability and potential recovery in property prices. Housing inventories also need to begin moving down as this will be a sign that the stimulus measures are having the desired effect. Failure of the above may lead to further concerns and affect market sentiment which would leave the PBoC in a tough spot.
Source: LSEG
Market Reaction
As we touched on earlier, the initial reaction has been a positive one with the Hang Seng and CSI 300 Index benefitting. European equities have also experienced a slight bounce at the open with the DAX rising and individual stocks in certain sectors benefiting.
Market sentiment in general may receive a boost today following the PBoC announcement and risk assets could be the beneficiaries.
Hang Seng (Hong Kong 33) Daily Chart, September 24, 2024
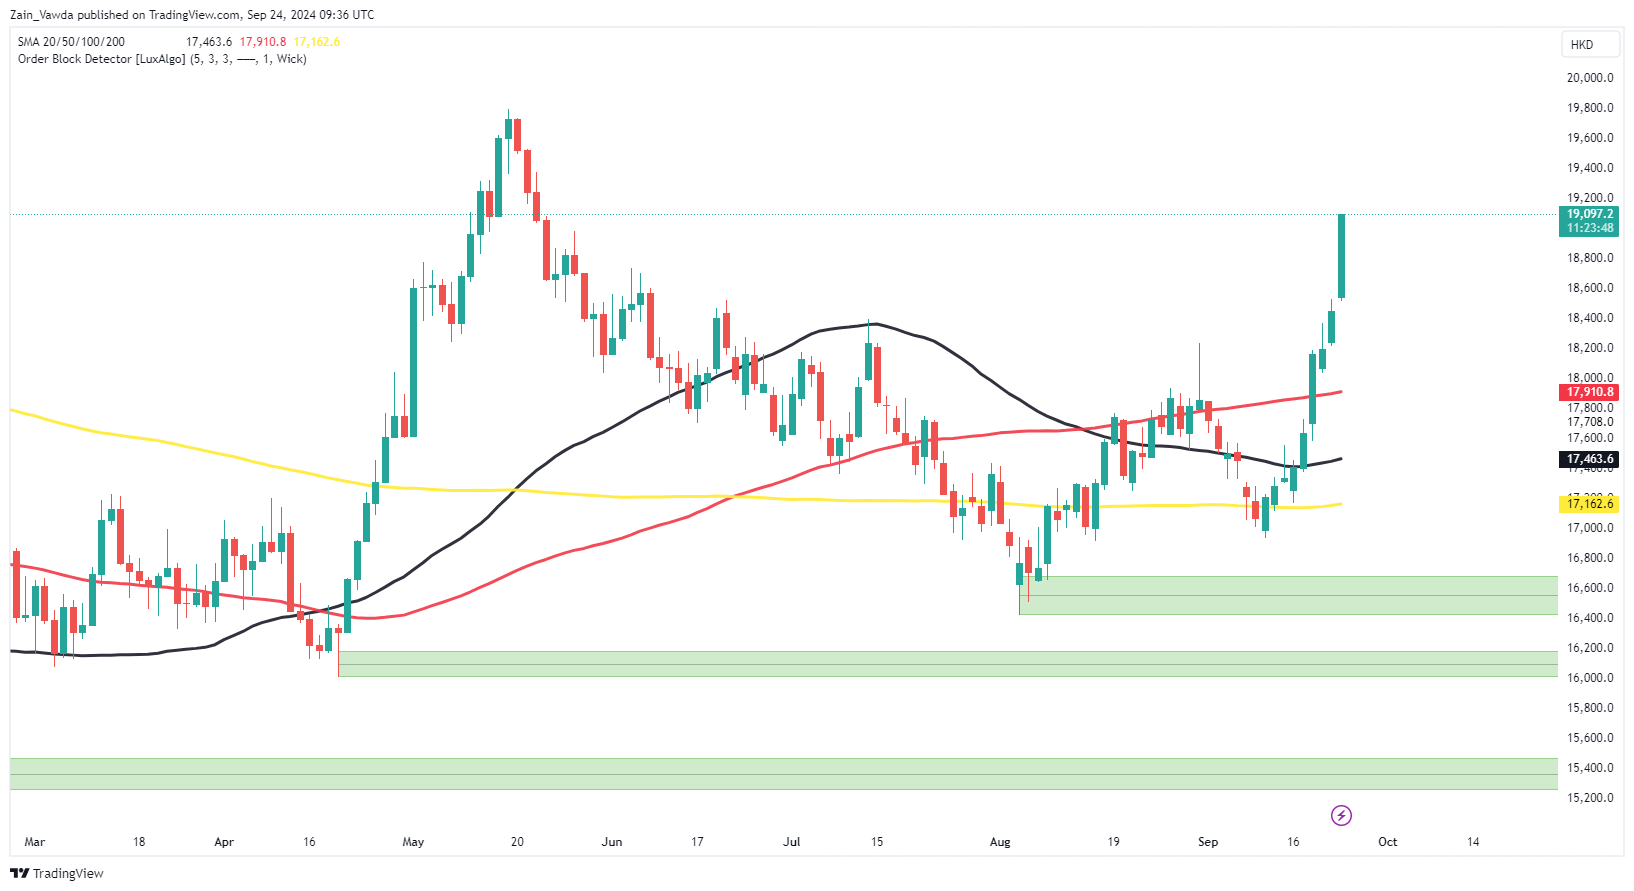
Source: TradingView (click to enlarge)
From a commodity perspective, Oil prices may be one to watch. Chinese growth has been an anchor on Oil prices of late and the move could help oil prices continue its recent rally. Tensions in the Middle East and the PBoC stimulus could be just what the doctor ordered for Oil prices to continue their ascent.
Other commodities such as copper, silver etc may also benefit from the announcement. If markets expect the stimulus to boost spending and demand this could result in an uptick across the commodity space.
Brent Crude Daily Chart, September 24, 2024
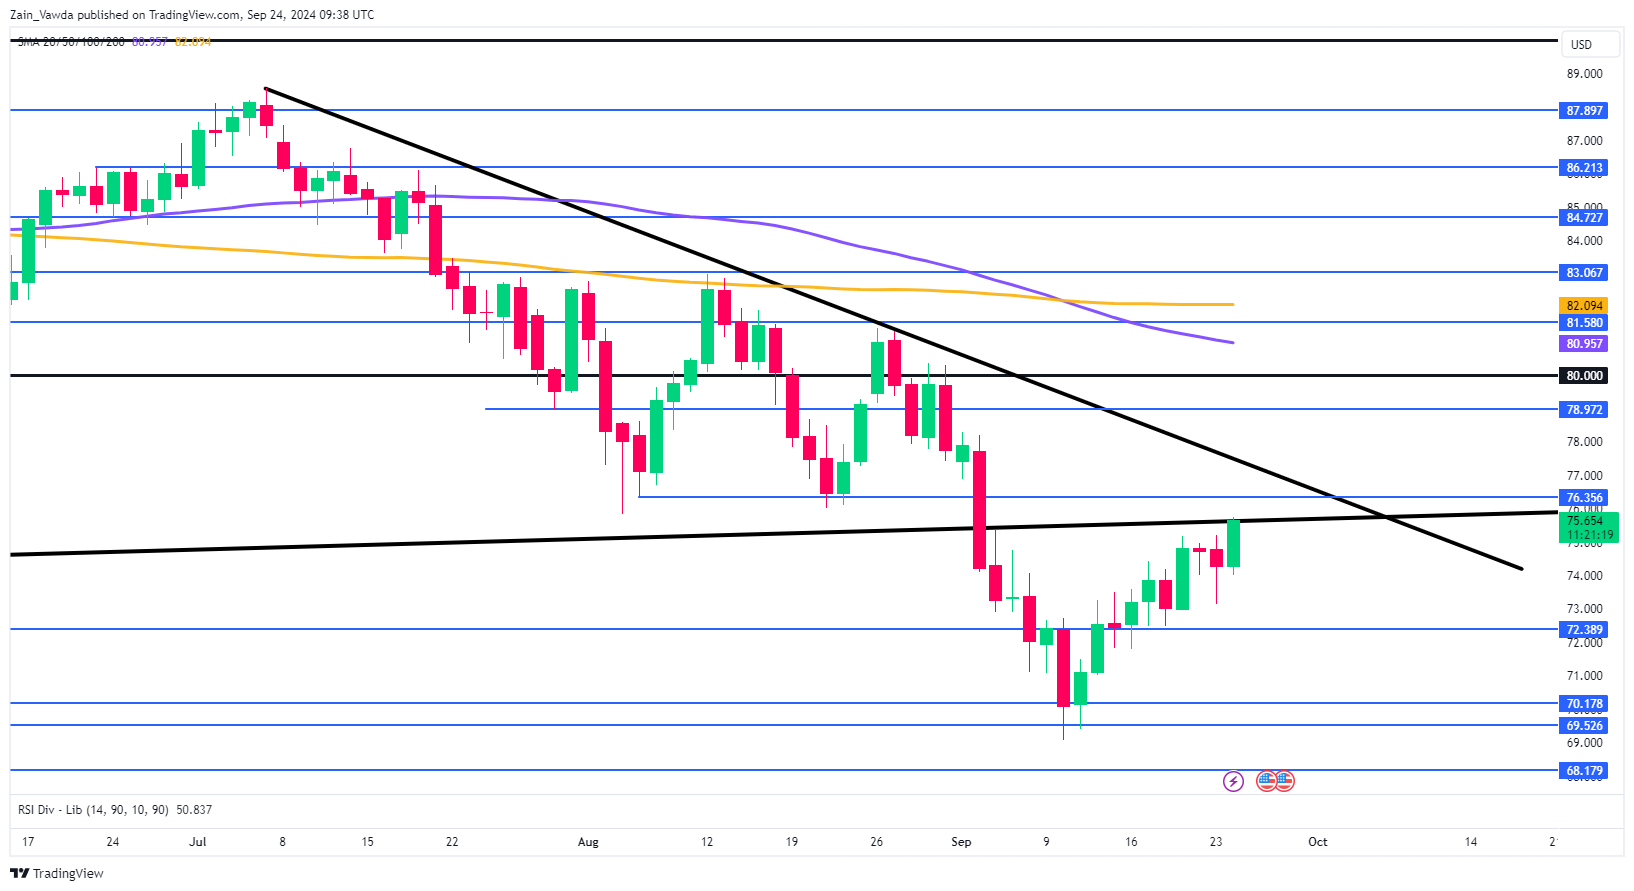
Source: TradingView (click to enlarge)
Support
- 74.00
- 72.38
- 70.00
Resistance
- 76.30
- 78.90
- 80.00
AUD/USD Outlook: Dips After Less Hawkish RBA, But Larger Bulls Remain Intact
AUDUSD eased from new multi-month high on Tuesday after the Reserve Bank of Australia kept rates unchanged in today’s policy meeting, but comments from Governor Bullock were less hawkish than expected and sidelined expectations for possible policy tightening.
The pullback was so far shallow, as Aussie is underpinned by higher commodity prices and diverging Fed/RBA monetary policies, suggesting that larger bulls are just taking a breather.
Strong positive momentum on daily chart and formation of daily Tenkan/Kijun-sen contributes to bullish scenario however, overbought conditions warn that the price action may hold in prolonged consolidation.
Initial supports lay at 0.6814/0.6790 zone, ahead of more significant supports at 0.6774/66 (Fibo 38.2% of 0.6622/0.6869 / rising 10DMA) which should keep the downside protected and maintain bullish structure.
Res: 0.6869; 0.6900; 0.6948; 0.6961.
Sup: 0.6814; 0.6790; 0.6766; 0.6745.
SNB Meeting: Single or Double Cut This Time?
- SNB policy meeting has 50-50 chances for 25bps versus 50bps rate cut
- Potential reaction in Swissy on Thursday at 7:30 GMT
SNB: another bank to cut rates
The time for Swiss National Bank (SNB) to cut rates again has come. The global economic environment is currently facing substantial problems, including inflationary pressures and geopolitical uncertainty, so this decision comes at a vital time when the landscape is facing these challenges.
The policy rate of the SNB is currently set at 1.25% since June 2024. There is a 50-50 chance of a 25bps cut versus a 50bps cut at this meeting. Switzerland's economy, one of the world's most stable economies, has struggled with moderate inflation and a strong Swiss currency, both of which have an influence on the export-driven sectors of the economy. The major responsibility of the SNB is to maintain price stability while simultaneously fostering economic expansion.
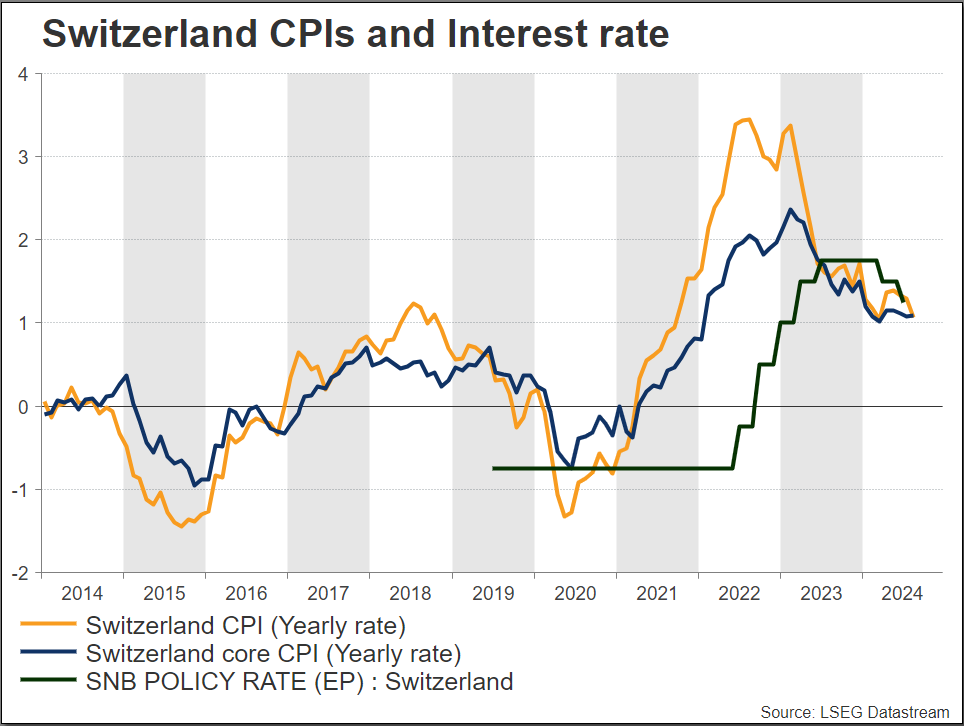
Inflation starts to ease
The goal of the SNB is to maintain inflation within a predetermined range. Recent data suggests that inflationary pressures are beginning to ease, which opens the door for the possibility of a reduction in interest rates. It has the potential to boost borrowing and investment by lowering interest rates, which can lead to increased economic growth. This is particularly significant in light of the fact that Switzerland is currently navigating the post-pandemic recovery phase. The current state of the global economy, which includes the policies of other major central banks such as the Federal Reserve and the European Central Bank, will also impact the SNB's decisions.
Lower interest rates could result in a devaluation of the Swiss franc, which would make Swiss exports more competitive on the international market. A reduction in interest rates would lower the costs of borrowing money for both individuals and businesses, which might potentially lead to an increase in spending and investment.
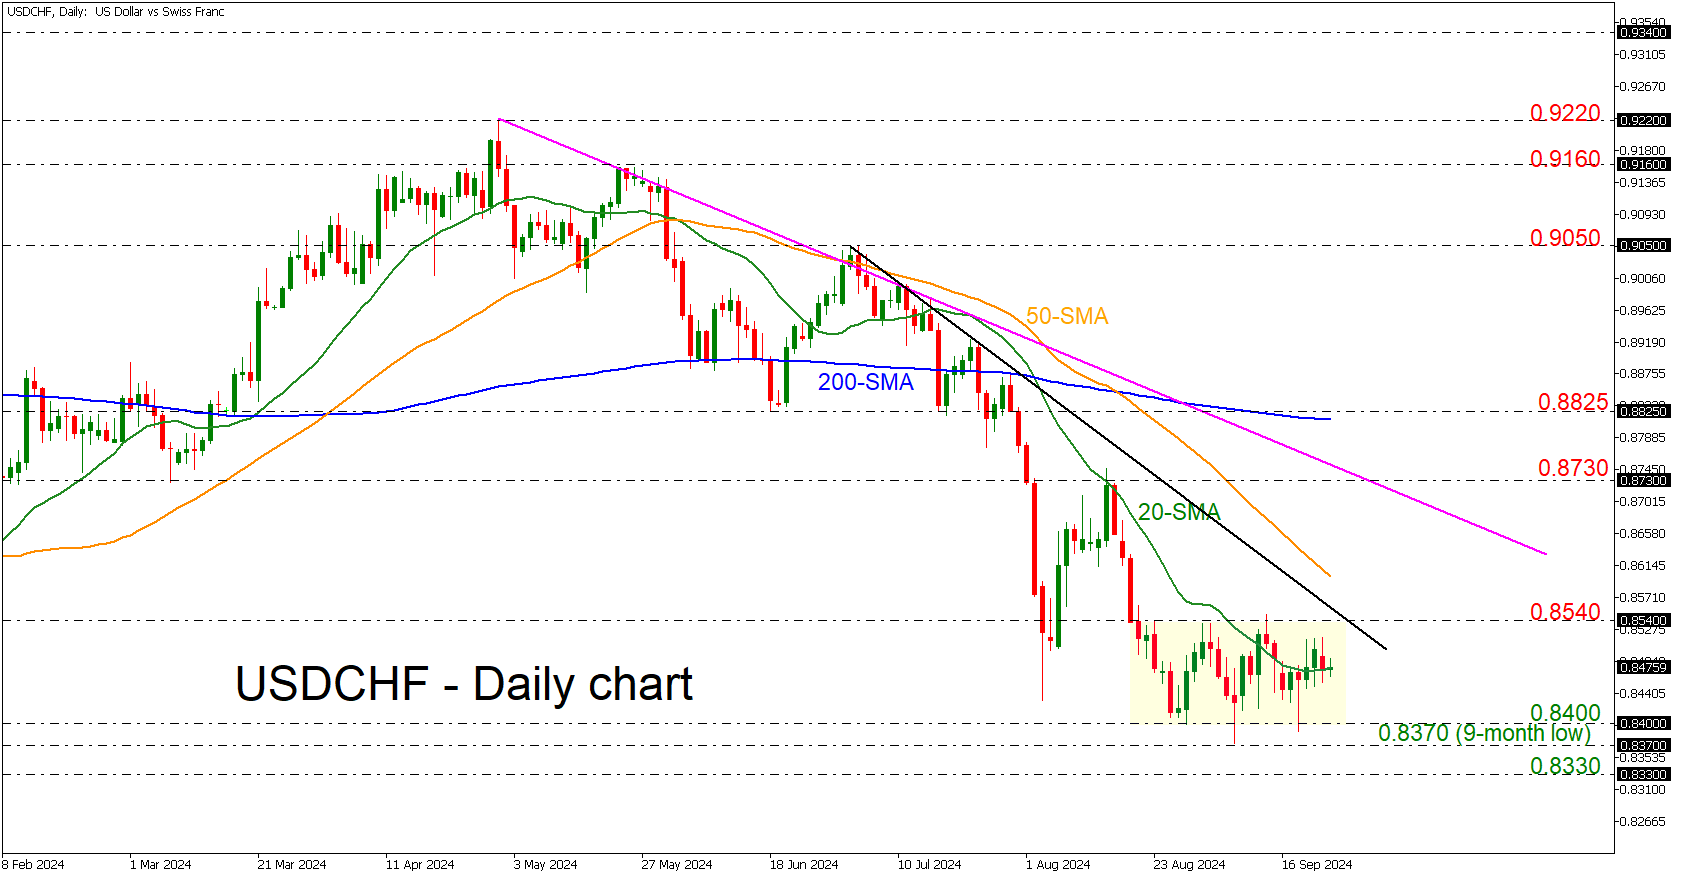
Technical look at USDCHF
The Swissy has been stuck within a sideways channel over the last month, with the upper boundary at the 0.8540 resistance and the lower boundary at the 0.8400 support. If there are steeper declines, it may take USDCHF time to test the previous lows of 0.8400 and the nine-month trough of 0.8370. On the other hand, a break of the narrow range could add some optimism for an upside recovery, meeting the short-term trend line at 0.8580 and the 50-day simple moving average (SMA) at 0.8600.
The short- and medium-term outlooks remain bearish as long as the market holds well beneath the 200-day SMA.
Will Core PCE Inflation Corroborate Bets for Another Double Fed Cut?
- Fed cuts by 50bps, sees another 50bps by December
- Investors turn more dovish, which implies upside risks
- Focus turns to PCE inflation due out on Friday at 12:30 GMT
Some investors expect a back-to-back 50bps cut
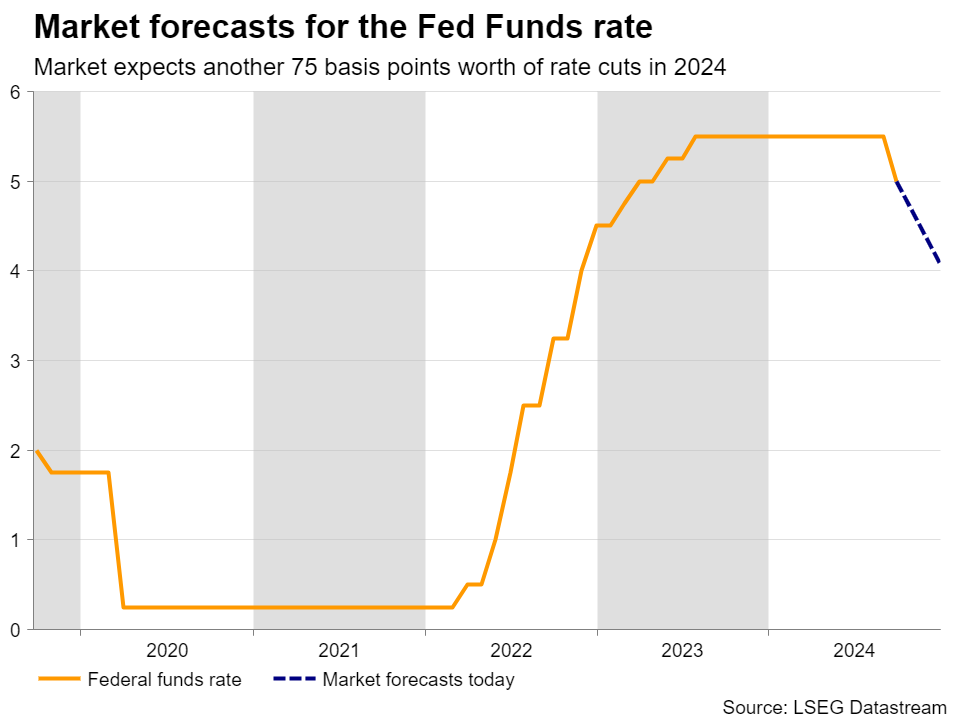
The Fed decided to begin this easing cycle with a double 50bps rate cut at last week’s decision, with the new dot plot pointing to another 50bps worth of reductions by the end of 2024. At the press conference following the decision, Fed Chair Powell noted that the economy is in good shape and that that the decision was designed to keep it there.
Combined with the Committee’s dovish take on interest rates, Powell’s view that there is no imminent risk of recession allowed investors to increase their exposure in stocks, while the dollar suffered some more losses.
Investors went as far as to pencil in another 75bps worth of reductions by December, despite the Fed’s dot plot pointing to 50, and despite a Reuters poll revealing that a strong majority of economists agree with the Fed. Economists believe that policymakers will cut interest rates by 25bps in both November and December, but according to the Fed funds futures, investors are assigning a strong 55% chance for a back-to-back double cut in November.
Dovish bets pose upside risks
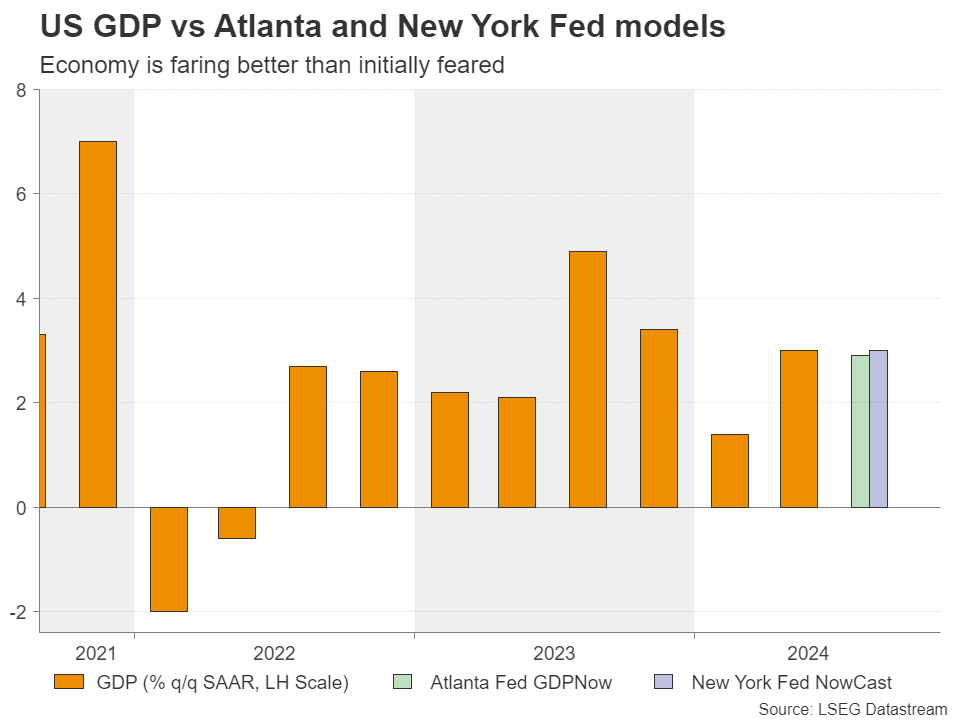
This implies that there may be upside risks moving ahead should data heading into the November decision continue to suggest that the economy is faring well and/or that inflation is not slowing as fast as initially believed.
Indeed, both the Atlanda Fed GDPNow and the New York Fed Nowcast models are pointing to solid growth rates for Q3, while the composite S&P Global PMI for September came in slightly better than expected, holding well above 50, despite the further weakness in the manufacturing sector. This corroborates the notion that the world’s largest economy is doing well.
PCE inflation enters the limelight
Now, investors are likely to turn their attention to Friday’s PCE inflation metrics for August, which are accompanied by the personal income and spending data. As is usually the case, the spotlight is likely to fall on the core PCE price index as it is the Fed’s favorite inflation gauge.
Considering that the core CPI for the month held steady at 3.2% y/y, there is the likelihood for the core PCE to have also held steady at 2.6% y/y. This view is corroborated by the Fed’s own projections, which suggest that inflation will end 2024 at 2.6%. Reuter’s poll is even pointing to an uptick to 2.7%.

Thus, should such an outcome be accompanied by strong income and spending numbers, investors will have fewer reasons to believe that a back-to-back double rate cut will be warranted, something that could help Treasury yields move higher and the US dollar to recover some ground.
Nevertheless, that doesn’t mean Wall Street will pull back. Even at a slower pace, interest rates are destined to continue decreasing. Thus, as long as data keep pointing to decent economic performance, equity traders may be willing to add to their risk exposure.
Euro/dollar may extend latest setback
Euro/dollar pulled back on Monday, after the Euro area PMI revealed that business activity fell into contraction in August, prompting traders to increase their bets about another 25bps cut at the October ECB decision.
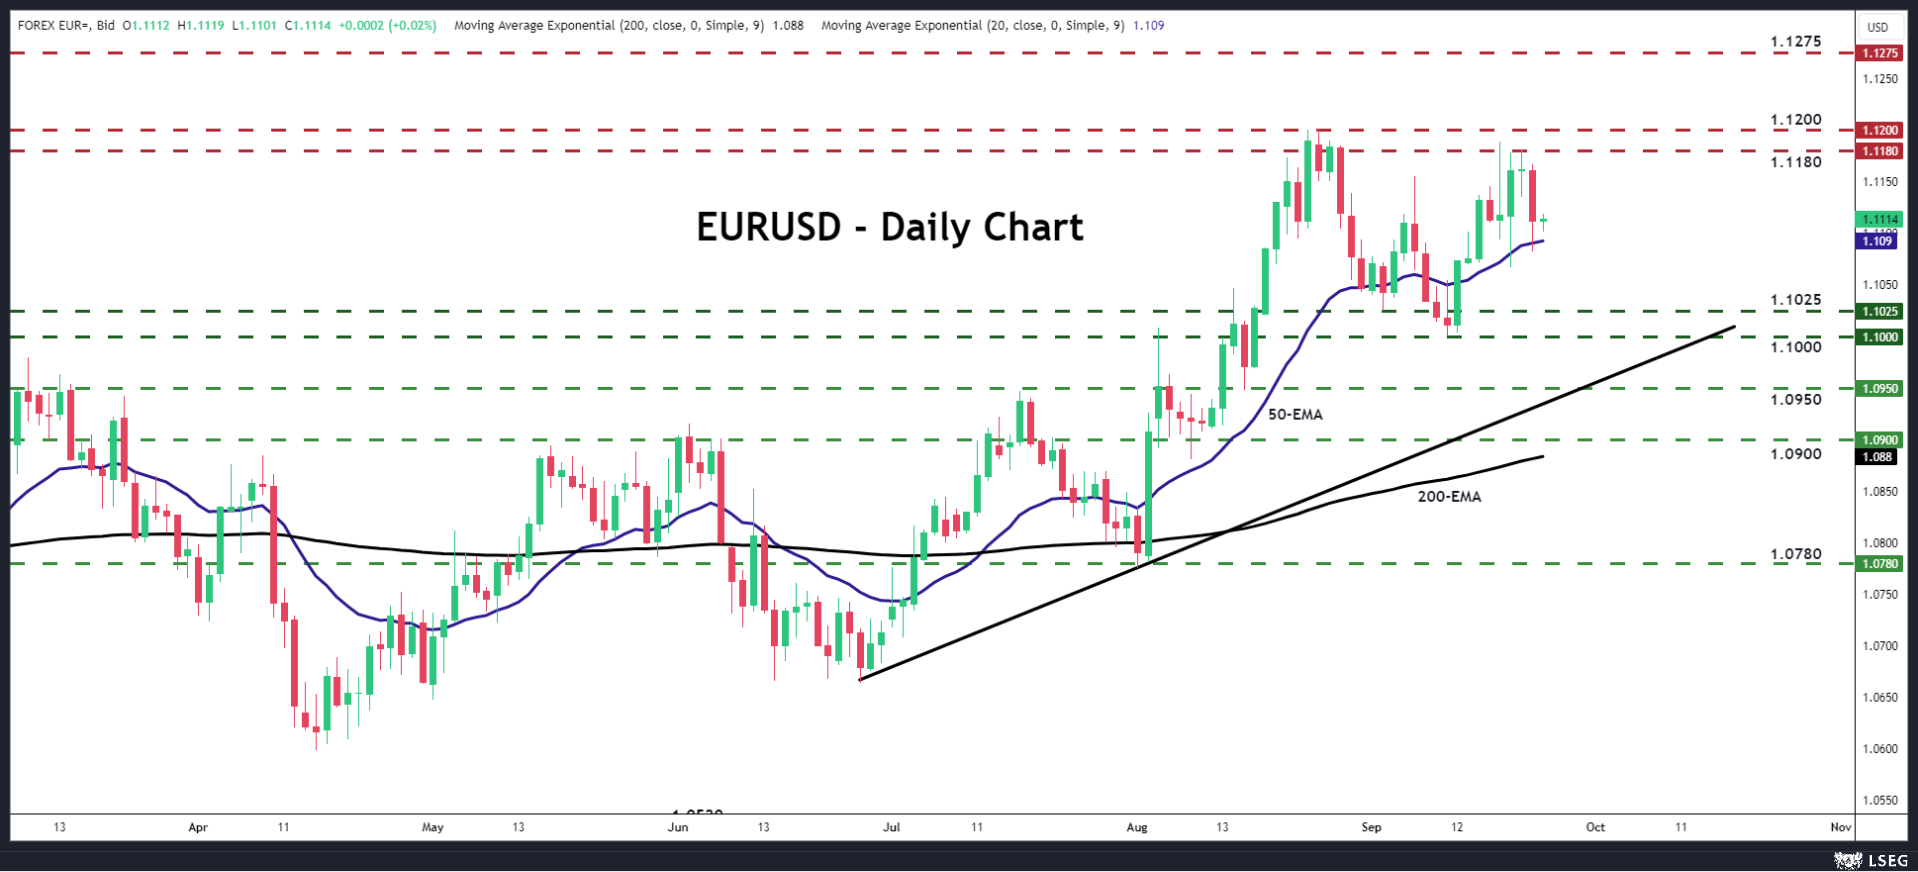
The setback occurred after the pair hit resistance last week near the 1.1180 and should Friday’s US data prove supportive for the dollar, the pair may continue sliding, perhaps until it tests the 1.1025 zone, marked by the low of September 3, or the round figure of 1.1000, which stopped the price from moving lower on September 11.
Now, in case the data encourages investors to increase their Fed rate cut bets, euro/dollar may climb back to the 1.1180 zone, or the 1.1200 area, marked by the highs of August 23 and 26, the break of which could pave the way towards the high of July 18, 2023, at around 1.1275.