Sample Category Title
Germany’s PMI composite falls to 47.2, recession baked in
Germany’s economic outlook has worsened with the latest PMI data showing continued weakness in both manufacturing and services. PMI Manufacturing fell from 42.4 to 40.3 in September, marking a 12-month low. PMI Services dropped to from 51.2 to 50.6, a six-month low. PMI Composite PMI declined from 48.4 to 47.2, a seven-month low.
Cyrus de la Rubia, Chief Economist at Hamburg Commercial Bank, commented on the deepening downturn in the manufacturing sector, saying, “The hope for an early recovery has evaporated,” as output plunged at its fastest rate in a year, with new orders collapsing. The sector’s troubles have prompted significant layoffs, with several major automotive suppliers announcing job cuts.
These concerning trends in manufacturing are now beginning to affect Germany's traditionally robust services sector. De la Rubia warned that activity growth among service providers has slowed for four consecutive months, edging toward stagnation.
A technical recession appears to be "baked in". According to HCOB's Nowcast, Germany’s economy is expected to shrink by -0.2% in Q3, following a -0.1% contraction in Q2.
France PMI composite tumbles to 47.4 as Olympics related anomaly dissipates
France’s economy took a sharp downturn in September as PMI Services dropped significantly from 55.0 to 48.3, marking a six-month low. The broader PMI Composite also fell from 53.1 to 47.4, an eight-month low, signaling a shift back to contraction. While PMI Manufacturing saw a slight uptick from 43.9 to 44.0, it remains in contractionary territory.
According to Tariq Kamal Chaudhry, economist at Hamburg Commercial Bank, the strong growth seen in August was short-lived, with the surge largely driven by "an Olympics-related anomaly" that has since dissipated. He noted that the situation in manufacturing continues to struggle, much like in previous months.
Chaudhry pointed out that their Nowcast predicts "near stagnation" for the French economy in Q3, aligning France with other Eurozone economies facing significant growth challenges.
News of the Week (September 23—September 27): AUDUSD Review
AUDUSD poised for a move—traders should stay alert!
The AUDUSD pair, often referred to by traders as the "Aussie," is a major currency pair representing the exchange rate between the Australian and US Dollar. The Australian Dollar is heavily influenced by commodity prices (especially iron ore and gold), interest rate decisions by the Reserve Bank of Australia, and domestic economic data like employment and inflation. On the other hand, the US dollar responds to US economic indicators, including employment reports, inflation data, and decisions by the Federal Reserve.
US manufacturing purchasing managers index (PMI), Sep 23, 15:45 (GMT+2)
The US Manufacturing PMI is forecasted at 48, up slightly from the previous 47.9. If the PMI result is better than expected, signaling stronger-than-anticipated growth in the manufacturing sector, this would likely strengthen the US Dollar. In that case, the AUDUSD pair would likely fall as the stronger Dollar weighs on the Australian Dollar. However, if the PMI falls short of expectations, reflecting further contraction in manufacturing, the US Dollar could weaken. This would likely lead to a rise in the AUDUSD pair as the Australian Dollar strengthens relative to the US currency.
Australia interest rate decision, Sep 24, 6:30 (GMT+2)
The Reserve Bank of Australia is expected to leave interest rates unchanged at 4.35%. If the RBA’s decision or accompanying statement turns out to be more hawkish than expected, such as signaling a future continuation of rates at current levels, it could lead to a slight rise in the Aussie dollar, pushing AUDUSD higher. On the other hand, if the RBA suddenly cuts rates or dovish forecasts suggest a softer approach to monetary policy, the Australian dollar is likely to weaken. This will lead to a decline in AUDUSD.
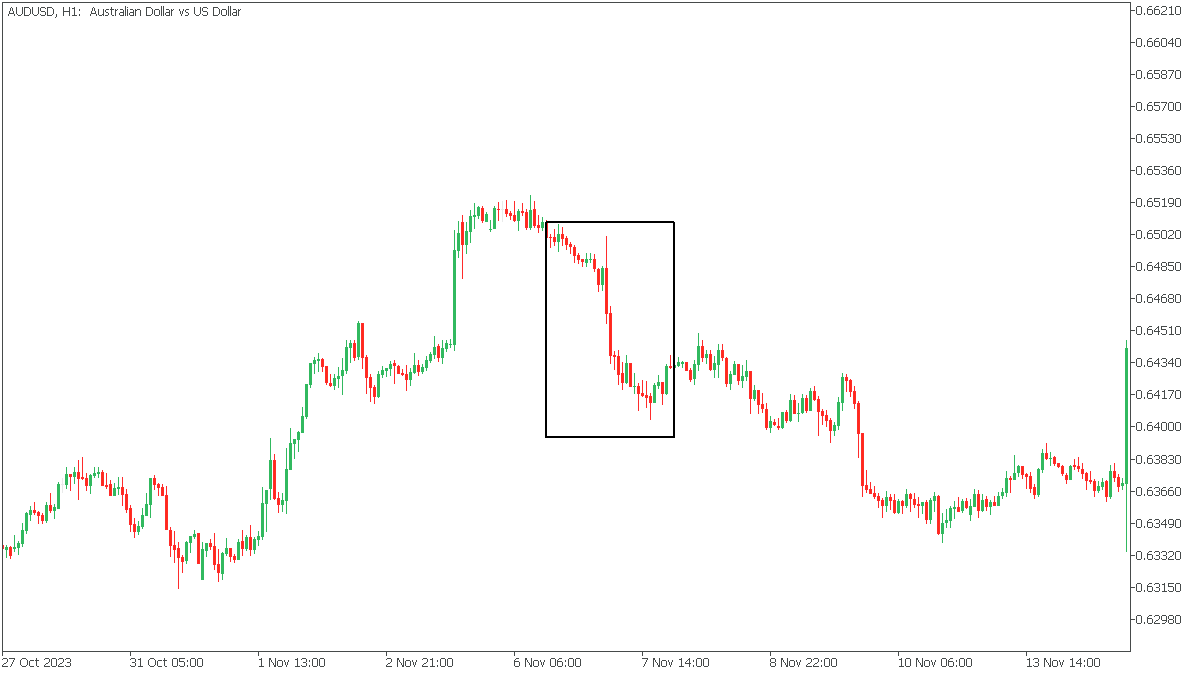
The Bank of Australia rate was last changed on November 7, 2023, from 4.10% to 4.35%, causing the price to spike!
US GDP QoQ, Sep 26, 14:30 (GMT+2)
The US GDP is forecasted to grow strongly at 3.0%, up from the previous 1.4%. If the actual GDP figure exceeds this forecast, indicating even stronger economic expansion, the US Dollar would likely gain further strength. In this scenario, the AUDUSD pair would likely decline as the US Dollar strengthens, overshadowing the Australian Dollar. Conversely, the US dollar could lose momentum if the GDP decreases more than expected. This would likely lead to an upward movement in the AUDUSD pair.
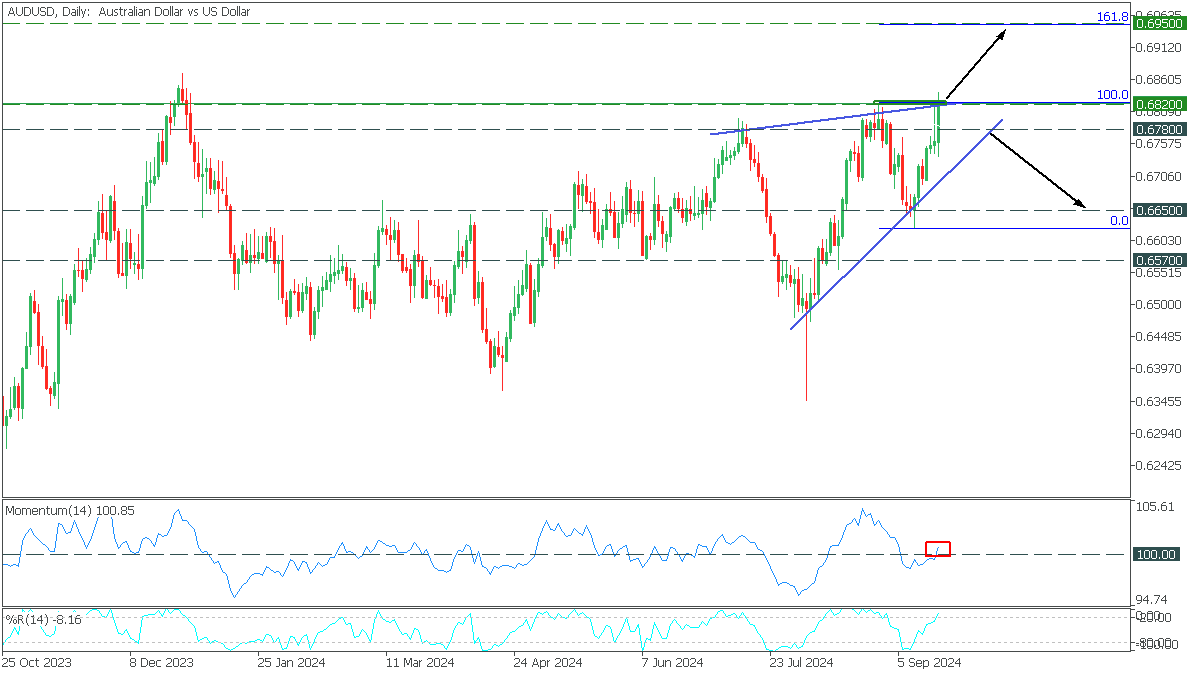
In the Daily timeframe, AUDUSD formed a rising wedge pattern in a short-term bullish impulse. The price has reached the upper trend line, with %R indicating a significant overbought condition. However, at the same time, Momentum has risen above the 100.0 level.
- If the price breaks the trend line above the resistance at 0.6820, the upside will be 0.6950, corresponding to 161.8 Fibonacci;
- A rebound and a break of the lower trendline below 0.6780 support will start a bearish scenario to 0.6650.
PMIs Are Scheduled for Release
Markets
Sterling was among the outperformers on currency markets last Friday. The British pound excelled on significantly stronger than expected August retail sales after an already bumper July. EUR/GBP’s downside at 0.838 (July and by extension a two-year low) is cracking. GBP/USD topped the 1.33 big figure for the first time since February 2022. It attacked the 1.3328 resistance level (76.4% recovery on the 2021-2022 decline). A break higher looks likely on GBP strength and/or USD weakness. Fed’s Waller triggered some of the latter in late European dealings. The influential policymaker said he supported a 50 bps cut last week on favourable inflation dynamics rather than concerns over the labour market. He would do so again in November if the price evolution were to surprise again or if labor market data worsens. That’s setting the bar low and markets noticed. An intraday U-turn in US yields steepened the curve with the front adding less than 1 bp (vs gains of >6 bps earlier on the day) and the long end rising 3.3 bps. Fed fund futures’ pricing now implies a 51% chance of another 50 bps November 7. German yields moved between 0.8 and 1.3 bps higher. ECB’s Lagarde unveiled some of the scope of its strategic review that follows the one that ended in 2021 in a speech at the IMF on Friday. This one will be less wide-ranging and the 2% target isn’t up for discussion. It’s an exercise that focuses on how to deal with risks and uncertainty in an era of more volatile inflation and as structural shifts unfold. It “provides an opportunity to consider how to balance the information from baseline forecasts with real-time information, how to make best use of alternative scenarios, and the importance of the medium-term orientation when faced with different types of shocks.” The results will be published in the second half of 2025.
A quiet Asian sessions brings us quickly to the European eco calendar for today. PMI’s are scheduled for release. The European September gauge is expected to remain near the August levels, meaning: a still-contracting manufacturing sector (45.7 from 45.8), a modestly expanding services sector (52.3 from 52.9) and shy economic growth overall (50.5 composite, down from 51). Risks, if any, are tilted to the downside with the French Olympic boost now dropping out of the equation. That could slow or halt the dollar-driven ascent of EUR/USD, especially with the first important resistance levels nearby (EUR/USD 1.1202). The European/German yield curve is most vulnerable at the front but a negative surprise would drag the longer end probably down as well. First support in the German 10-yr kicks in at 2.08%. 2.34% is the parallel reference of the 10-yr swap.
News & Views
Rating agency Fitch on Friday upwardly revised Portugal’s credit rating outlook from stable to positive while affirming the rating itself at A-. The positive outlook reflects continued progress in reducing public debt, a record of and commitment to prudent fiscal policy and an ongoing external deleveraging. Fitch for 2024 expects moderate economic growth and modest budget surplus (0.2%) to reduce government debt to 95.8% of GDP (from 99.1% at end 2023). It expects a further decline in the debt to GDP ratio to 82.5% by 2028. This projection is underpinned by a high primary surpluses and sustained growth. Fiscal outperformance is seen to continue relative to its rated peers and most EU countries. It sees a budget deficit of 0.2% in 2025-26. Portugal’s debt profile is also supported by substantial cash buffers and a high proportion fixed rate debt. The rating agency thinks the country’s external deleveraging will continue with the current account to expected to stay in surplus (1.7% this year, 1.6% in 2025 and 1.5% in 2026).
The People’s Bank of China provided 160.1 bn yuan of liquidity via 7-reverse repos at 1.7% and 74.5 bn yuan via a 14-day repo at 1.85%. The latter compares to a level of 1.95% at a previous operation. China often uses the 14 day repo to provide liquidity to the banking system ahead of a period of prologued holidays. Even so, the reduction in the rate might be an indication of the PBOC’s intention to further ease policy as economic activity continues to disappoint. Markets are looking forward to a joined press conference scheduled for tomorrow by the heads of the PBOC, the National Financial regulatory Administration and the Chine Securities Regulatory Commission. At the press conference the PBOC and other authorities are expected to address financial support for the economy. The yuan this morning is holding its recent gains against a broadly weak dollar with USD/CNY trading near 7.047.
Graphs
GE 10y yield
The ECB cut policy rates by 25 bps in June and in September. Stubborn inflation (core, services) make follow-up moves less evident. We expect the central bank to stick with the quarterly reduction pace. Disappointing US and unconvincing EMU activity data dragged the long end of the curve down. The move accelerated during the early August market meltdown.
US 10y yield
The Fed kicked off its easing cycle with a 50 bps move. It is headed towards a neutral stance now that inflation and employment risks are in balance. Conservative SEP unemployment forecasts risk being caught up by reality and with it the dot plot (50 bps more cuts in 2024). We hold our call for two more 50 bps cuts this year. Pressure on the front of the curve and weakening eco data keeps the long end in the defensive for now as well.
EUR/USD
EUR/USD moved above the 1.09 resistance area as the dollar lost interest rate support at stealth pace. US recession risks and bets on fast and large rate cuts trumped traditional safe haven flows into USD. EUR/USD 1.1276 (2023 top) serves as next technical references.
EUR/GBP
The BoE delivered a hawkish cut in August. Policy restrictiveness will be further unwound gradually on a pace determined by a broad range of data. The strategy similar to the ECB’s balances out EUR/GBP in a monetary perspective. Recent better UK activity data and a cautious assessment of BoE’s Bailey at Jackson Hole are pushing EUR/GBP lower in the 0.84/0.086 range.
Risk On
Last week marked the end of my myopia and the beginning of the end of the Federal Reserve’s (Fed) tightening cycle. The Fed started lowering its rates by 50bp – a bold decision that raised many questions across investment communities regarding the necessity of a jumbo size cut while the US economy, though slowing, hasn’t necessarily given signs of plunging toward recession. The idea here is to ensure a soft-landing but if, instead, the aggressive rate cut – and the message that it sent to the market that the Fed is on track to do more – revives the inflationary pressures, then we could see optimism fade quickly.
This week, the US will reveal the latest PMI figures, the third estimate of its Q2 GDP growth and the core PCE index. The US economy is expected to have grown near 3%, with improving corporate profits but slowing price pressures. While the Fed’s favorite gauge of inflation is expected to show signs of stabilization a touch above the 2% policy target. The combination of good growth and slowing price pressures could well boost optimism that the Fed will get the soft-landing right, and send the US stocks to fresh highs. A stronger-than-expected data could – maybe – revive concerns that inflation could come back very rapidly. But the good news is that it will take at least a few months before the Fed’s policy loosening affects the inflation data, whereas the fact that the Fed has started loosening policy will temper the negative surprises.
As such, we are certainly entering a sweet period with the Fed loosening before the bill comes in. US and European futures are preparing to start the week on a positive note.
Plus the USDJPY is also giving signs of rebound after the Bank of Japan (BoJ) refrained from hiking its rates last week. Therefore, it’s safe to think that the equity rally has room to extend. The S&P500 closed last week a touch below an ATH, and above the 5700 for the first time. Lower funding costs should help narrowing the gap between the technology-heavy S&P500 and its equal weight version. But that does not mean that the technology heavy Nasdaq won’t continue its journey to the north.
Oil rebounds
Oil and energy could eventually see the benefits of the reflation trade, as well. US crude jump above $72pb last week – along with rising geopolitical tensions. Crude remains bid in the early hours of the week supported by Fed optimism, Mid-East tensions and maybe – a little bit – by the People’s Bank of China (PBoC) decision to cut its 14-day reverse repo rate by 10bp and inject liquidity into the financial system to boost sentiment. The Chinses CSI 300 rebounded last week from February lows. But the trend remains comfortably bearish as the stimulus measures see little enthusiasm in the absence of a deeper strategic change at the heart of the Chinese government.
But anyway, coming back to energy, there is an interesting intersection between Big Tech and its AI projects and energy markets, and that’s nuclear. On Friday, Microsoft and Constellation Energy revealed a power purchase deal that would enable a restart of a reactor at Pennsylvania’s Three Mile Island nuclear plant – a plant that experienced a partial shutdown following an accident in one of its operating units in 1979 and its both units stopped operating in 2019. This plant (the unit 1 of this plant more specifically) will be back on track in 2028 to supply Microsoft’s energy needs for 20-years to come… because there is simply not enough energy to meet both the growing electricity demand of our AI tools and the zero-carbon emission goals. Needless to say that Constellation Energy’s stock price jumped 22% on Friday after the announcement. Uranium ETFs are also an interesting part of the AI play.
Who will cut, who will not?
This week, investors will keep an eye on rate decisions from the Reserve Bank of Australia (RBA) and the Swiss National Bank (SNB). The RBA is expected to keep rates unchanged at this week’s meeting, while the SNB is seen cutting by another 25bp. Elsewhere, some major Eurozone countries will reveal their latest CPI on Friday. Figures could hint at further cool down in European inflation, boost the European Central Bank (ECB) doves and prevent the EURUSD from drilling above the 1.12 resistance.
Focus on Euro Area and US PMIs Today
In focus today
Today, focus is on the euro area PMIs for September. The service PMIs got a 'golden boost' from the Olympics in France in August, which likely reversed in September. While we expect overall momentum in services activity remained broadly unchanged compared to August, we expect the PMIs to decline due to the French data. In the manufacturing sector, activity likely remained subdued as also indicated by the German ZEW.
We will also get preliminary US PMIs for September where we similarly expect the weakness in manufacturing to continue and for services to hold up activity. Also in the US, the Fed's Kahskari and Bostic are on the wire.
As for the rest of the week, on Tuesday we expect the RBA to keep their policy rate unchanged while we see a 50/50 chance that the PBOC will ease policy on Wednesday. On Friday, the ruling party in Japan will pick a new leader and thus a new PM.
Economic and market news
What happened over the weekend
In the Middle East, Lebanon's Hizbollah and Israel continued to exchange fire after a week of intensified hostilities that has seen several high-level Hizbollah members killed and missile attacks in both countries. Fears have risen that the conflict could escalate to a full-blown war which has contributed to higher oil prices during the week, though other factors including the Fed's rate cut also supported oil.
In France, PM Barnier presented a new government to President Macron, consisting of politicians from Macron's centrist party and Barnier's more conservative party. Uncertainty is still high as the French Parliament is highly fragmented and the government would need broad support to pass bills, but a new government would solve some of the political paralysis.
What happened on Friday
The yen continued to weaken after bucking its September rally at the beginning of the week, with USDJPY up 0.9%, after the BoJ left policy rates unchanged and indicated they were not in a large hurry to tighten further. Recent data has seen a pick-up in growth and the yen has recovered from its very weak levels in the middle of the summer (USDJPY -9.6% since late June) which has made hiking rates less acute.
Equities: Global equities were lower on Friday, with European stocks experiencing the most significant declines. Despite this, many indices are not far from all-time highs, and futures are pointing upward this morning in both Europe and the US. Additionally, there has been stimulus from China this morning in the form of an interest rate cut by the People's Bank of China. Japan is leading advances in Asia today, and the yen is continuing to weaken. On Friday, market performance was a mixed bag between cyclicals and defensives, yet utilities stood out by outperforming and being one of the few sectors in the green. In the US on Friday, the indices reported mixed results: Dow +0.1%, S&P 500 -0.2%, Nasdaq -0.4%, and Russell 2000 -1.1%.
FI: Friday's trading session was somewhat volatile with a slight direction for higher rates, with 10y German Bunds ending at 2.21%. France was clearly weak on Friday due to Les Echos reporting that the French budget was likely higher than previously forecasted, to around 6% of GDP. French-German yield spread is trading around 75bp.
FX: BoJ's decision to keep rates unchanged and signal no hurry to hike prompted broad JPY weakness on Friday. USD/JPY was up two big figures on the day. The Fed's first cut caused some volatility in the USD crosses, though USD losses were generally quite modest: at the end of the week, DXY had lost only 0.2% from pre-Fed levels. EUR/SEK kept within a tight range of 11.30-11.40 throughout the week, close to our fair value. EUR/NOK dropped from 11.80 to 11.70, which helped to push NOK/SEK towards 0.97.
EUR/USD Daily Outlook
Daily Pivots: (S1) 1.1139; (P) 1.1161; (R1) 1.1185; More....
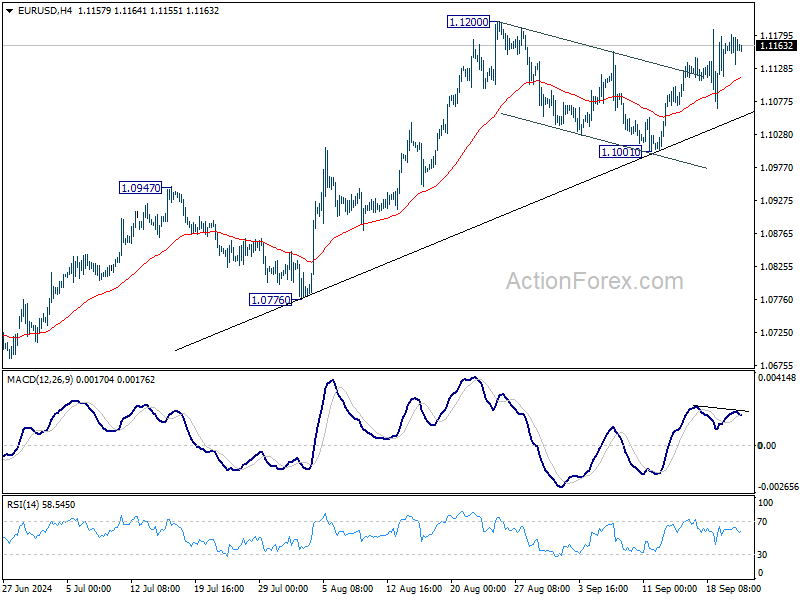
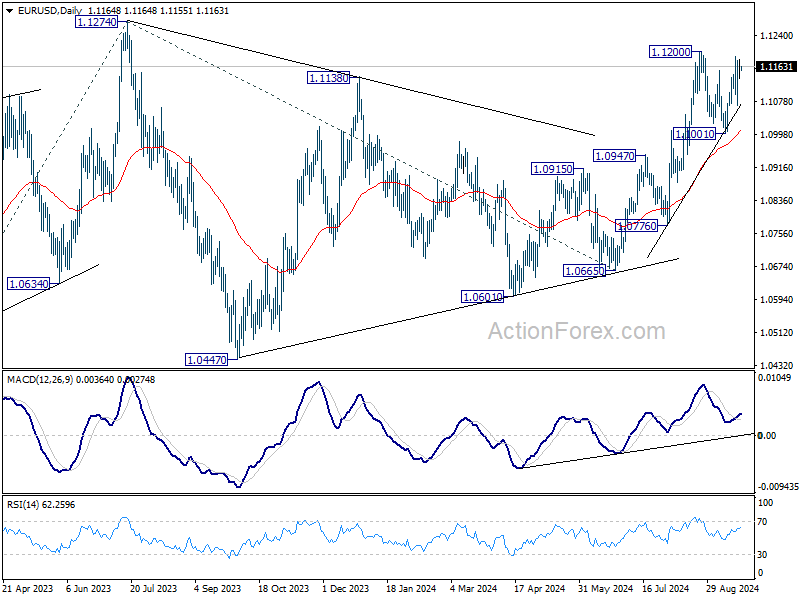
Intraday bias is EUR/USD is turned neutral with 4H MACD crossed below signal line. Some more consolidations could be seen below 1.1200. But further rally is expected as long as 1.1001 support holds. Break of 1.1200 will target 1.1274 high. Firm break there will resume larger up trend.
In the bigger picture, prior break of 1.1138 resistance indicates that corrective pattern from 1.1274 might have completed at 1.0665 already. Decisive break of 1.1274 (2023 high) will confirm resumption of whole up trend from 0.9534 (2022 low). Next target will be 61.8% projection of 0.9534 to 1.1274 from 1.0665 at 1.1740. This will now be the favored case as long as 1.0947 resistance turned support holds.
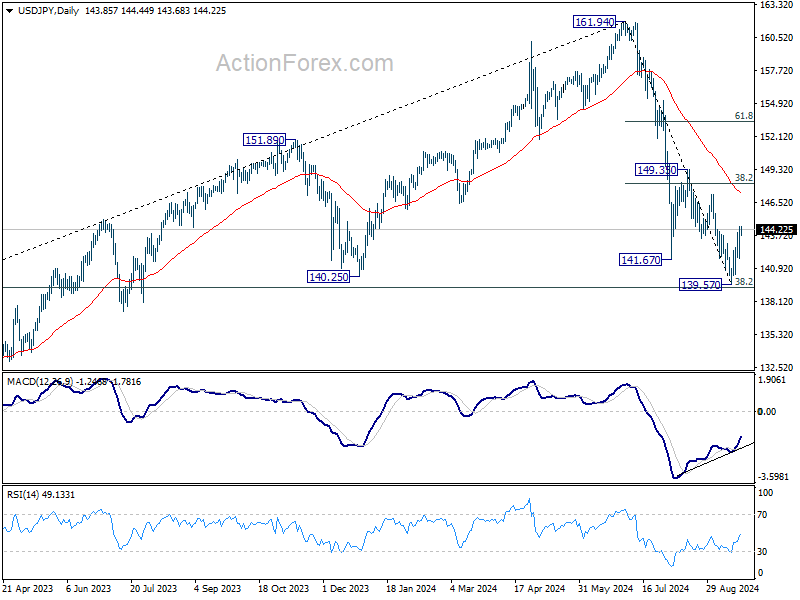
USD/JPY Daily Outlook
Daily Pivots: (S1) 142.28; (P) 143.39; (R1) 145.03; More...
Intraday bias in USD/JPY remains mildly on the upside for the moment. Rebound from 139.57 short term bottom should extend to 38.2% retracement of 161.94 to 139.57 at 148.11. On the downside, below 141.73 minor support will turn bias to the downside for retesting 139.57 instead.
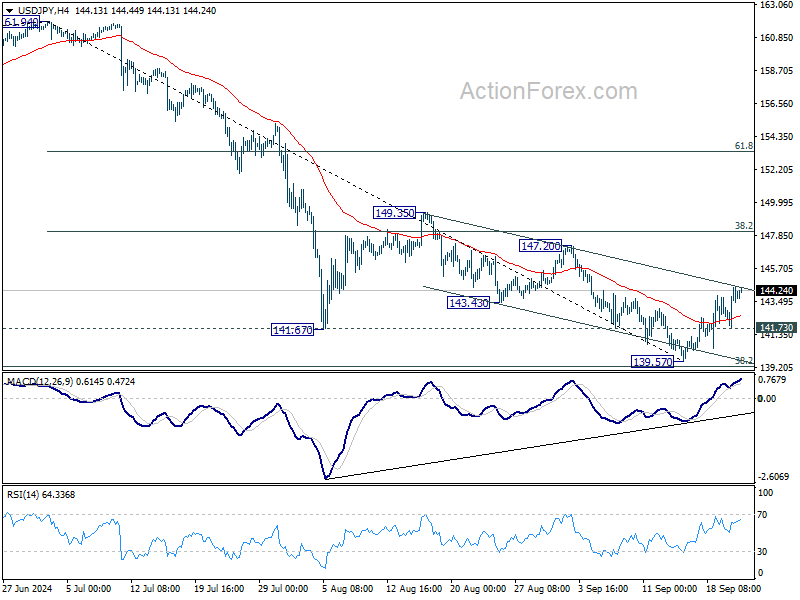
In the bigger picture, fall from 161.94 medium term top is seen as correcting whole up trend from 102.58 (2021 low). Strong support could be seen from 38.2% retracement of 102.58 to 161.94 at 139.26 to contain downside, at least on first attempt. But in any case, risk will stay on the downside as long as 149.35 resistance holds. Sustained break of 139.26 would open up deeper medium term decline to 61.8% retracement at 125.25.
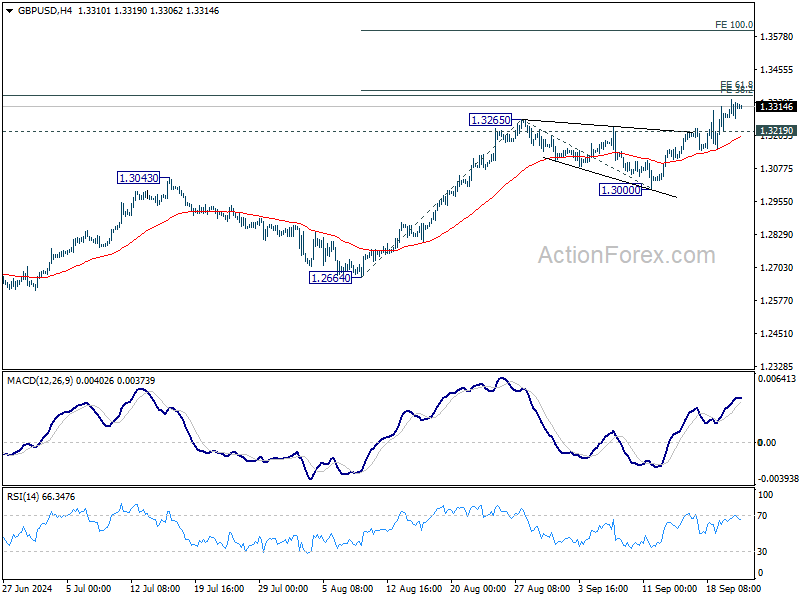
GBP/USD Daily Outlook
Daily Pivots: (S1) 1.3278; (P) 1.3309; (R1) 1.3354; More...
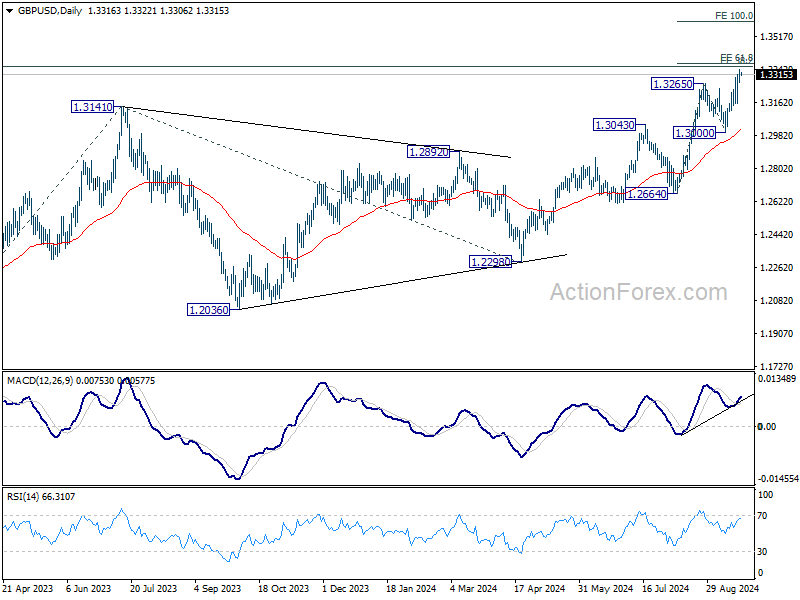
Intraday bias in GBP/USD remains on the upside for the moment. Current rally is in progress for 1.2664 to 1.3265 from 1.3000 at 1.3371. Firm break there will pave the way to 100% projection at 1.3601 next. On the downside, below 1.3219 minor support will turn intraday bias neutral and bring consolidations first. But outlook will stay bullish as long as 1.3000 support holds.
In the bigger picture, up trend from 1.0351 (2022 low) is in progress. Next target is 38.2% projection of 1.0351 to 1.3141 from 1.2298 at 1.3364. Decisive break there will target 61.8% projection at 1.4022. For now, outlook will stay bullish as long as 1.2892 resistance turned support holds, even in case of deep pullback.
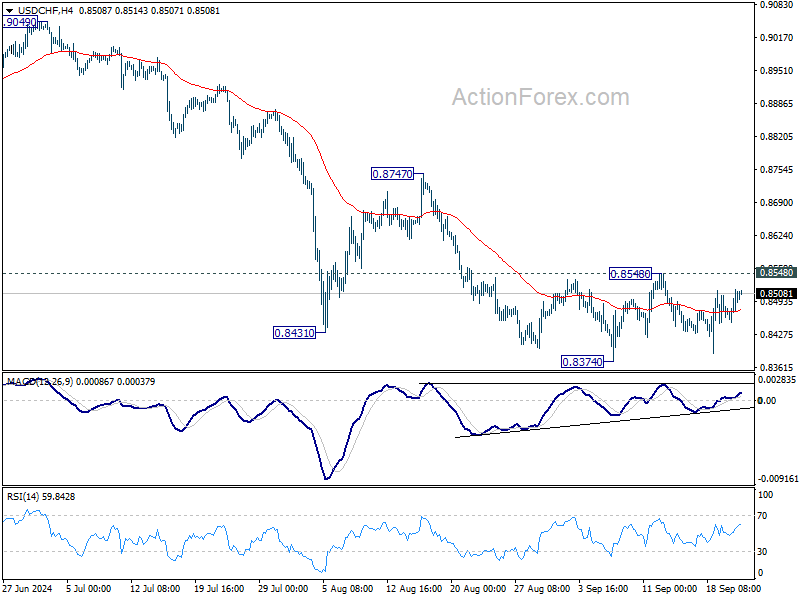
USD/CHF Daily Outlook
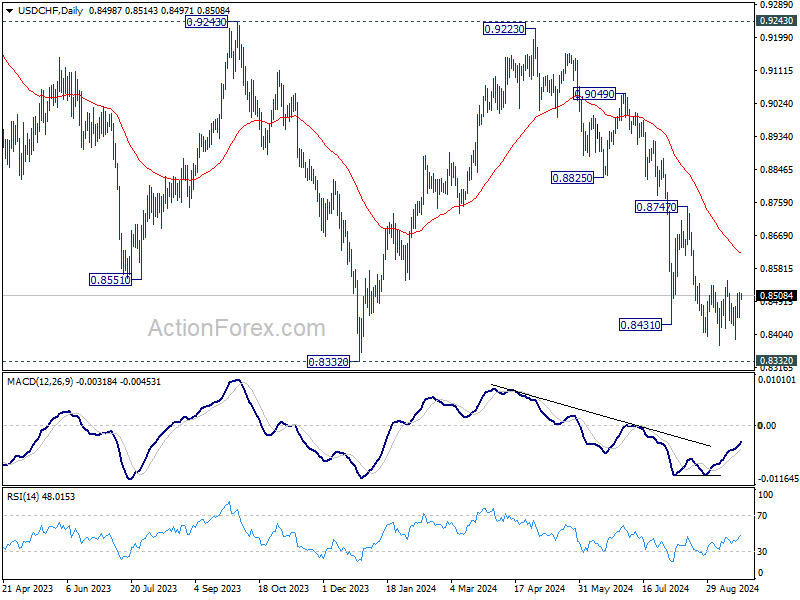
Daily Pivots: (S1) 0.8465; (P) 0.8491; (R1) 0.8530; More…
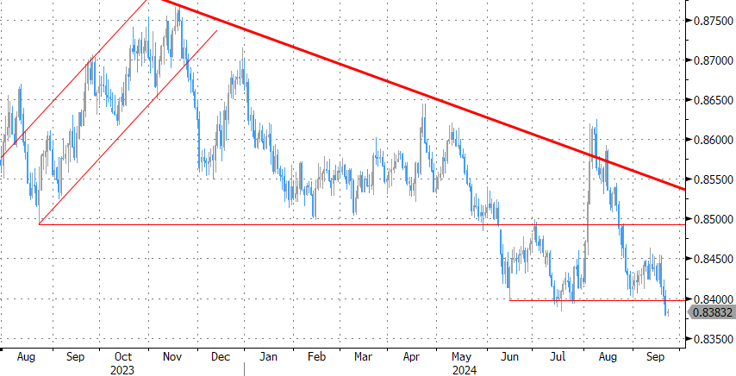
Intraday bias in USD/CHF remains neutral as range trading continues. On the downside, break of 0.8374 will resume the fall from 0.9223 to retest 0.8332 low. Decisive break there will indicate larger down trend resumption. However, considering bullish convergence condition in 4H MACD, break of 0.8548 resistance will confirm short term bottoming, and turn bias back to the upside for 0.8747 resistance.
In the bigger picture, price actions from 0.8332 (2023 low) are currently seen as a medium term corrective pattern, with fall from 0.9223 as the second leg. Strong support could be seen from 0.8332 to bring rebound. Yet, overall outlook will continue to stay bearish as long as 0.9243 resistance holds. Firm break of 0.8332, however, will resume larger down trend from 1.0146 (2022 high).