Sample Category Title
The Weekly Bottom Line: More Reason to Ride Down the Policy Escalator
U.S. Highlights
- The second estimate of Q2 GDP revealed that the U.S. economy grew at 3.0% annualized, a bit stronger than previously reported, thanks to an upward revision in consumer spending.
- Spending momentum continued into July, outstripping income growth for the sixth consecutive month and pushing the savings rate to a two-year low of 2.9%.
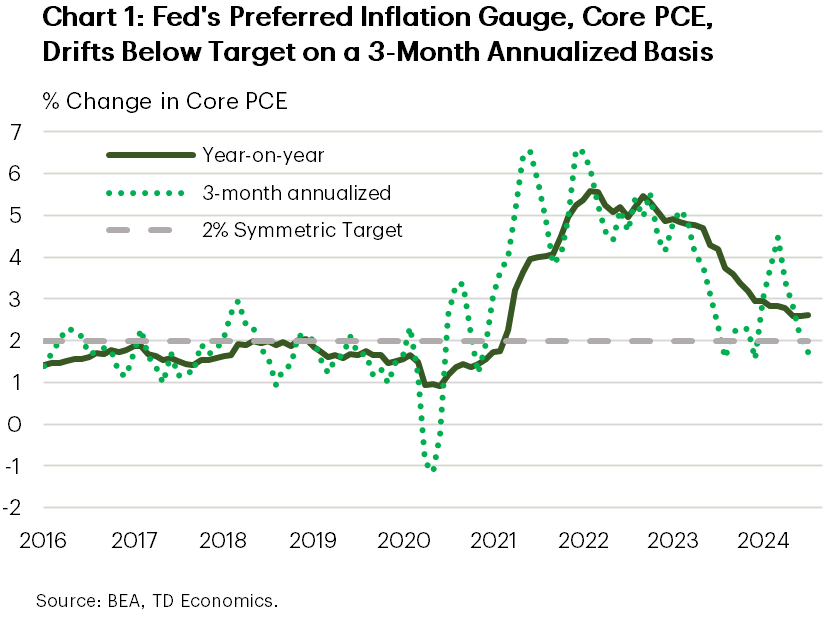
- Core PCE inflation held steady at 2.6% year-on-year in July, while the three-month annualized rate of change fell below the Fed’s 2% inflation target.
Canadian Highlights
- Second-quarter GDP came in ahead of expectations, driven by government expenditures and business spending. Other details were less encouraging, as household spending, residential investment and net exports fell short of expectations.
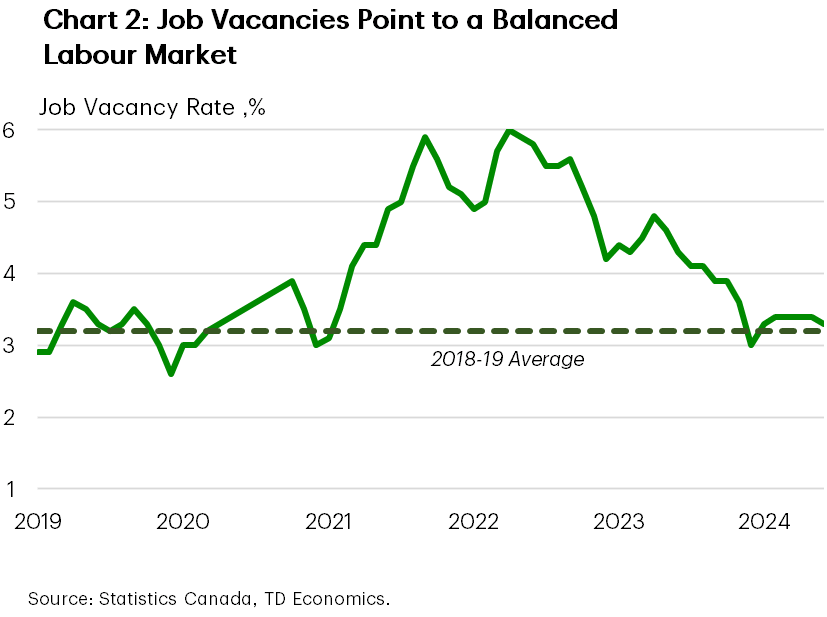
- In other news, June payrolls declined for the first time in six months while the job vacancy rate remained steady.
- The Bank of Canada is likely to interpret this week’s data as supportive of maintaining its easing bias, with three more quarter-point cuts expected by year-end.
U.S. – Fed to Tilt Focus to Labor Market as it Tees Up First Rate Cut
The Labor Day weekend is upon us, providing an opportunity to celebrate the achievements of the American worker. Keeping with the labor market theme, now that the Fed appears relatively confident that inflation will return to target, we believe it will put a little more emphasis the other side of its dual mandate – the goal of maximum employment – to determine the speed and size of policy easing. In that vein, next week’s payrolls report can’t come soon enough. This week’s data, meanwhile, did little to rock the boat, coming in broadly positive. Amidst this backdrop, long-term yields trended modestly higher, while the S&P 500 looks to end the week lower by 0.6% as of the time of writing.
A second read on U.S. GDP revealed an even better growth profile of 3.0% annualized in the second quarter (vs. 2.8% previously), thanks in large part to an upward revision in consumer spending (2.9% vs. 2.3% previously). But this week’s highlight was the July personal income and spending (PCE) report. The latter showed that overall and core PCE inflation held steady on an annual basis, coming in at respectively 2.5% and 2.6% in July. Looking to more recent trends, on a 3-month annualized basis, core PCE eased to 1.7% in July from 2.1% in the month prior, suggesting we’re likely to see more cooling in inflationary pressures in the months ahead (Chart 1).
The PCE report also shed light on consumer spending, which had a relatively healthy start to the third quarter. Real spending rose by 0.4% month-over-month (m/m) in July – an acceleration from 0.3% in the month prior, with both goods and service spending chipping in with healthy gains. However, real disposable personal income continued to trail behind (+0.1%), which meant consumers had to dip into their savings to sustain the higher rate of spending. As a result, the personal savings rate fell to a two-year low of 2.9%.
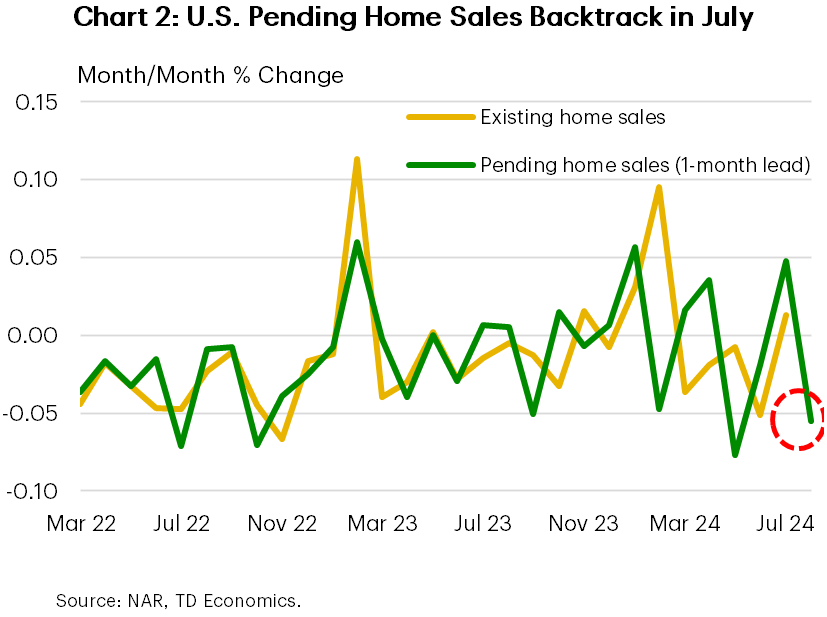
Other consumer-related indicators continued to paint a nuanced picture. Americans were a little more upbeat in August, with the Conference Board confidence measure rising to a six-month high, thanks in large part to an improvement in the “expectations” subcomponent. Still, plans to buy large ticket items, including cars, homes, and major appliances, all trended lower on the month. And it’s not just survey data showing a consumer’s reluctance to make big purchases. Pending home sales – a leading indicator for existing home sales – fell sharply in July (-5.5%), driving home the point that the recent pullback in interest rates has so far failed to spark a sustained improvement in sales (Chart 2).
Next week, attention will turn towards the August payrolls report, which will help shape whether the Fed cuts by 25 or 50 basis points at its next rate decision in September. Market expectations call for some rebound in job gains relative to July’s gain of 114,000. The recent steadying of both jobless claims and job postings suggests that the chances of another downside miss is less likely, which favors a 25 basis point cut in September.
Canada – More Reason to Ride Down the Policy Escalator
The final week of a summer break stayed drama-free with analysts’ attention squarely on Friday’s marquee release of Canada’s second-quarter GDP. Equity markets saw intraday volatility primarily driven by earnings, leaving the TSX closing -0.3% on the week. In the rates market, today’s data was met as a confirmation of what had already been priced – a gradual stepwise descent in 25 basis points increments through the end of the year. Longer-term yields inched higher with the 10-year government bond up 8 bps to 3.12% to end the week.
Real gross domestic product (GDP) rose by 2.1% quarter-on-quarter (q/q, annualized) in the second quarter, ahead of expectations calling for a gain of 1.6% q/q (Chart 1). The primary drivers of this gain were government expenditures supported by increases in compensation of employees (expense on the government ledger), and purchases of goods and services. Business spending on non-residential investment and machinery & equipment also made a significant contribution to today’s reading.
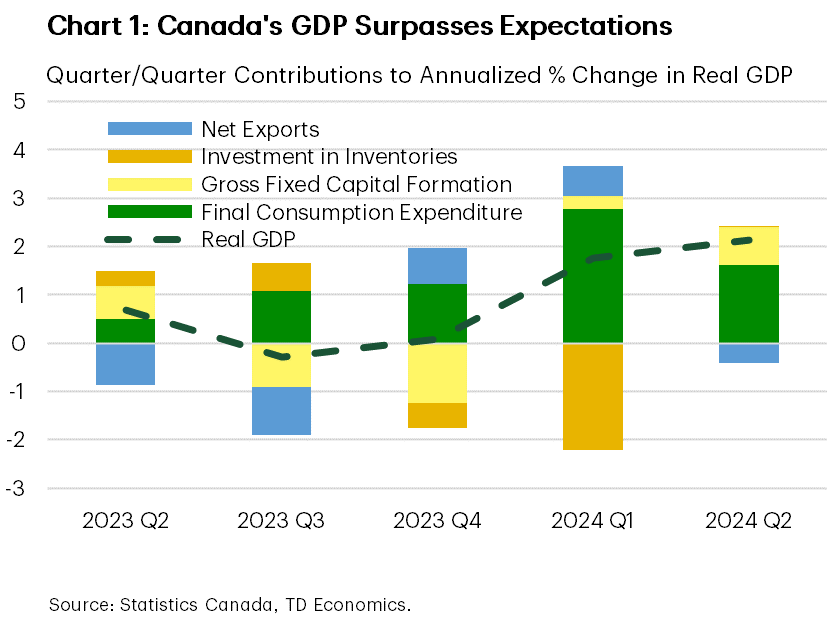
However, other details were less encouraging. Household spending came in lower than expected, consistent with the more recent data pointing to a weaker trajectory. A higher revision to Q1 spending partially offsets last quarter’s miss as the upward adjustment roughly matches the magnitude of Q2’s shortfall. Services spending remained a steady growth contributor with consumers increasing their outlays on necessities such as housing, food, and electricity. Spending on goods edged down, particularly in automobile expenditures, which were impacted by temporary technological setbacks are expected to reverse next quarter. Softer spending combined with solid gains in compensation led to an increase in the savings rate, which rose to 7.2% - the highest reading since Q1 2022 and significantly above the pre-pandemic average.
On the housing front, residential investment saw its largest decline in over a year with all major components – construction, renovations and homeownership transfer costs – falling during the quarter. Net exports also fell short of expectations for a rebound, weighing on the GDP reading. We expect growth to continue at a below-trend pace for the next several quarters until the economy gains further relief from lower rates.
In other news, this week’s Survey of Employment, payrolls and hours data showed that June payrolls declined for the first time in six months. The job vacancy rate – a ratio of vacancies to a number of available jobs – remained close to its pre-pandemic average, indicating a relatively balanced demand-supply position (Chart 2). The details show significant disparities among sectors, with labour demand still elevated in the service sector, but has cooled below pre-pandemic levels for the goods-producing sector.
The Bank of Canada is likely to interpret this week’s data as supportive of maintaining its easing bias. With the Fed now poised to adopt a similar policy stance, the risk of significant monetary policy divergence has diminished, reducing downward pressure on the Canadian dollar and easing the risk of importing price inflation.
Weekly Economic & Financial Commentary: The Search for Clues Continues
Summary
United States: The Search for Clues Continues
- Fed watchers are still on the lookout for clues on the size of the well-telegraphed September rate cut. This week's economic indicator lineup, which broadly beat expectations and reaffirmed a soft landing, provides limited insight. Next Friday's employment report will go a long way toward determining the actions taken by the FOMC at next month's meeting.
- Next week: ISM Manufacturing & Services (Tue. & Thu.), Employment (Fri.)
International: Eyes On Global Monetary Policy Decisions Ahead as Summer Comes to a Close
- It was a relatively light week for global economic data releases. Eurozone headline inflation slowed, while services price pressures remained persistent in August; we maintain our view for gradual European Central Bank rate cuts. A slight upside surprise in Australia inflation in July should keep RBA policymakers on hold until next year, in our view. Both Canada and Sweden released GDP reports that we view as consistent with a steady pace of rate cuts from the Bank of Canada and Riksbank through the end of 2024.
- Next week: China PMIs (Sat.), Bank of Canada Rate Decision (Wed.), Japan Labor Cash Earnings (Thu.)
Topic of the Week: That Chill in the Air Means College Football Is Upon Us
- Summer is winding down and fall is just around the corner. Before the leaves change color, temperatures dip and pumpkin spice finds its way into everything, what better way to mark the transition into autumn than to dive deep into the college football season and the regional economies the top teams call home?
BoC to Cut Rates Again Ahead of Pivotal U.S. Employment Report
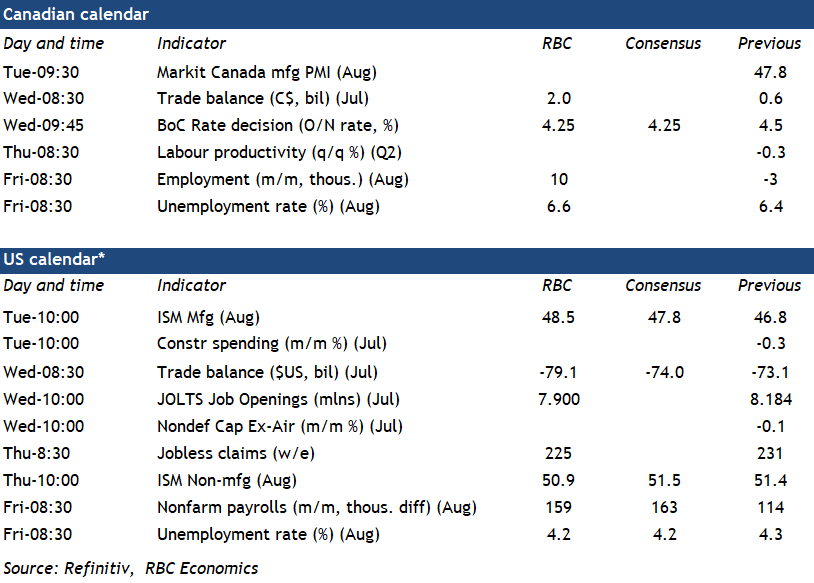
We expect another 25-bps cut to the overnight rate (to 4.25%) from the BoC meeting next week to build on cuts already delivered in each of the prior two meetings in June and July. Comments from Governor Macklem will likely again err on the dovish side, continuing to emphasize a softening economic backdrop that makes it more likely that inflation will keep trending lower.
CPI prints, although still important to the BoC’s consideration, are backward-looking and lag the economic backdrop that has continued to soften. The 2.1% annualized increase in Q2 GDP was above the 1.5% gain that the BoC expected in the July MPR but still left per-capita output down for the seventh in the last eight quarters. The unemployment rate is up almost a percentage point from a year ago – and we expect another increase (to 6.6%) in August to be reported next Friday as employment continues to grow at a slower pace than the size of the labour force.
Governor Macklem reinforced after the last rate cut in July that the central bank is convinced inflation will continue to drift lower even if “there could be setbacks along the way,” but July CPI data also surprised on the downside. Moving forward, the hurdle for more BoC rate cuts from what are still-elevated levels is low. Our own base-case assumes another 150 basis points of cuts (including the expected September reduction) by mid-2025.
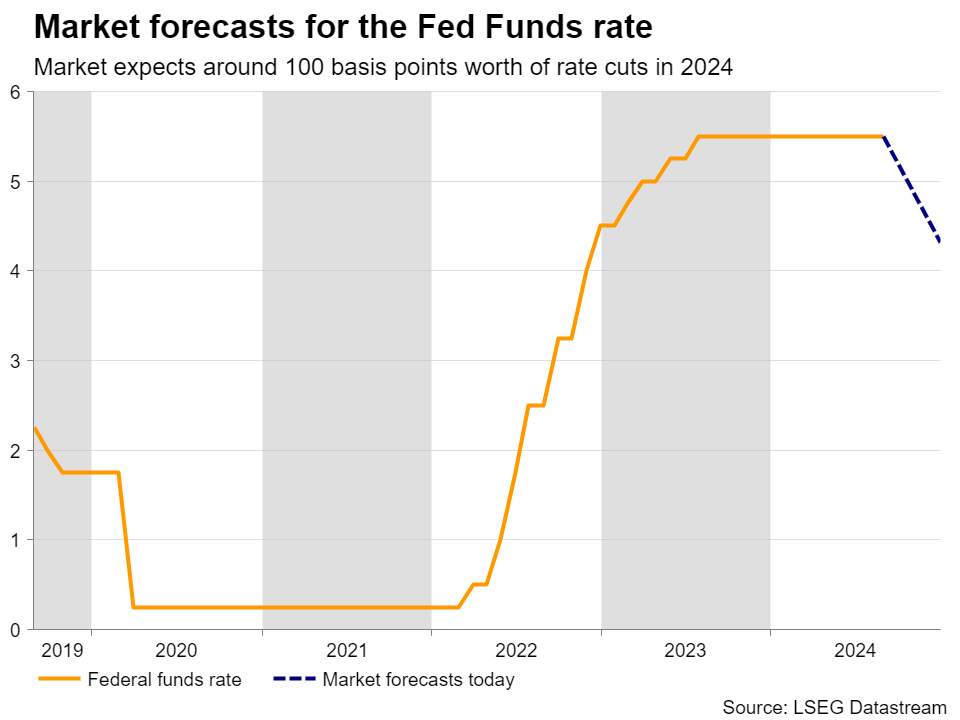
While the decision for the BoC to pivot to lower interest rates this year was likely relatively easy, the economic backdrop for the U.S. Federal Reserve has been more complicated. Resilient U.S. GDP growth and a flare-up in inflation pressures earlier this year has kept the Fed on the sidelines for longer than other advanced economies. But a downside surprise in U.S. labour market data in July jolted worries that a feared more significant labour market slowdown may have started, with a rise in the unemployment rate breaching thresholds usually only seen during U.S. recessions (the so-called ‘Sahm’ rule.)
For now, slowdown has been more of a ‘normalization ’ than a crumbling in the broader economic backdrop with the unemployment rate rising but to levels that are still low. And we expect a surge in temporary layoffs in July will at least partially reverse in August. Further sharp deterioration in labour market conditions is not in our base case and, as Powell made clear at Jackson Hole, would not be welcomed by Fed policymakers. If, however, next week’s report was to show a significant number of those ‘temporary’ layoffs have shifted into permanent job losses, that could prompt more interest rate cuts than our current assumption for two 25 bps cuts (September and December Fed meetings) this year.
Week ahead data watch
We look for Canadian employment to edge up 10k in August after two consecutive small declines in June and July. But with the population still growing rapidly, and a large pullback in the labour force participation rate in July is not likely to be repeated, we look for job growth to be outpaced by labour force growth and for the unemployment rate to rise to 6.6%.
We expect the July Canadian trade surplus to increase to $2.0B in July, with exports expanding by 1.3% and imports down by 0.8%. Much of the export growth is expected to have come from higher motor vehicle shipments (4%), and higher oil prices boosting the energy trade balance.
U.S. trade deficits likely widened to $79.1 B in July. According to the advance trade report, goods deficits widened by $6.1B from June to July, given imports were up 2.3% m/m, and exports of goods came in flat.
Week Ahead – Investors Brace for NFP Amid Fed Rate Cut Speculation
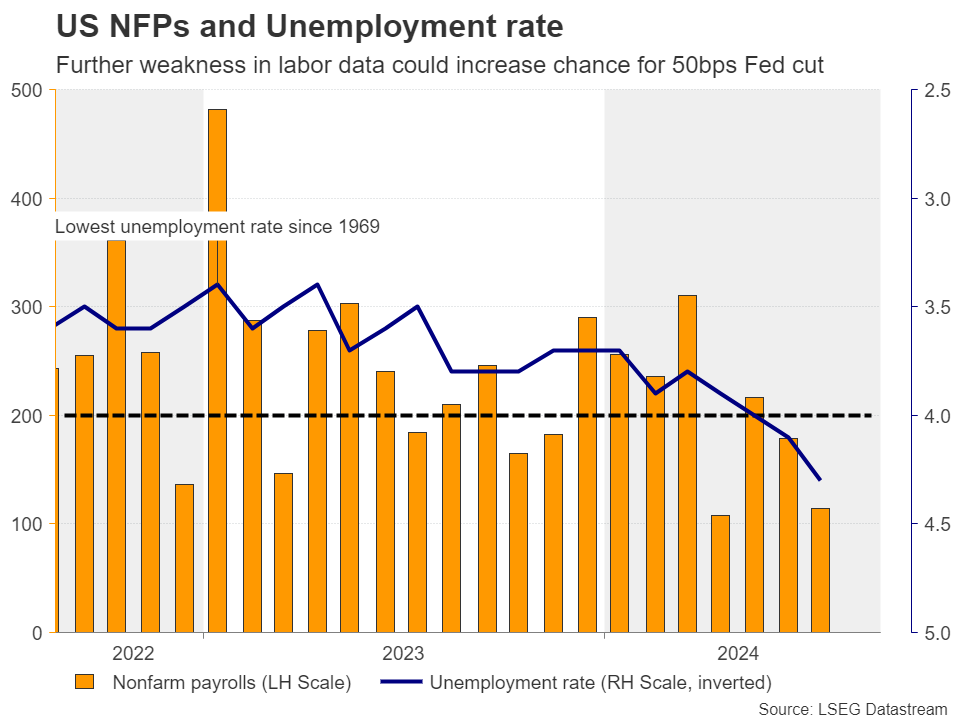
- Traders see decent chance for 50bps Fed cut in September
- Powell adds extra importance to jobs data, NFP awaited
- BoC decides on rates, third consecutive cut is fully priced in
- Aussie traders lock gaze on GDP numbers
Bets for double Fed cut remain elevated
Here comes another NFP week, with investors eagerly awaiting the results as they try to discern the size and pace of the Fed’s forthcoming rate cuts.
The weaker than expected July numbers triggered market turbulence, instilling fears about a potential recession in the US and prompting investors to price in around 125bps worth of Fed rate cuts by the end of the year.
Nonetheless, subsequent data after the jobs report alleviated investors’ concerns, encouraging them to scale back their bets. That said, a dovish speech by Fed Chair Powell at Jackson Holec did not allow them to materially alter their dovish view. Investors are still expecting interest rates to end the year around 100bps below current levels, while penciling in a decent 35% chance for a 50bps reduction at the September 18 gathering.
Employment data take center stage
At Jackson Hole, Powell said that the “time has come for policy to adjust” and that the timing of rate cuts “will depend on incoming data”. He also placed extra emphasis on the labor market, saying that they would “not seek or welcome further cooling in labor market conditions.”
This makes next Friday’s nonfarm payrolls even more important as signs of further cooling may convince more traders that the Fed may start its easing cycle with a bold 50bps reduction. This could push Treasury yields lower and exert more pressure on the US dollar.
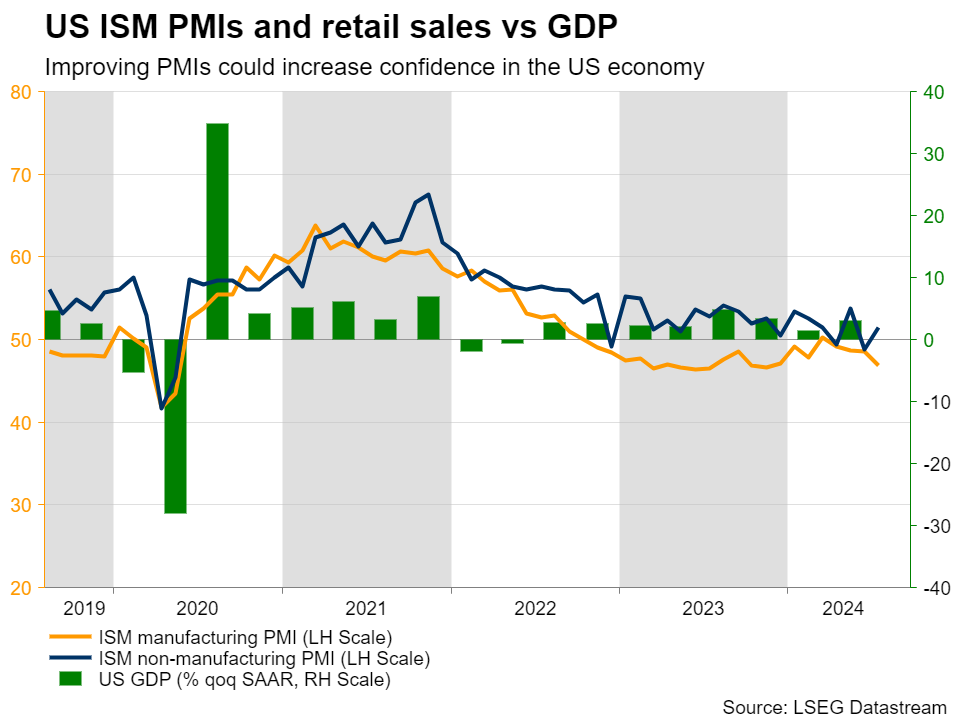
The question is: How will Wall Street react? Will another tepid employment report rekindle recession fears, or will equity investors cheer the prospect of even lower borrowing costs? Perhaps the answer lies on the outcome of the ISM manufacturing and non-manufacturing PMIs for August, due out on Tuesday and Thursday, respectively.
The Atlanta Fed GDPNow model estimates a respectable 2.0% real GDP growth for the third quarter, and if the ISM prints point to improving activity, investors may retain their confidence in the world’s largest economy, thereby increasing their risk exposure.
Market participants may get some information about the state of the labor market ahead of Friday’s NFPs. On Tuesday, the JOLTS job openings for July are due to be released, while on Thursday, the ADP employment report will be published. Thursday’s agenda also includes data on Nonfarm Productivity and Unit Labor Costs for Q2.
BoC preparing for a third straight cut
In neighboring Canada, the BoC is scheduled to announce its interest rate decision on Tuesday, with Canada’s overnight index swaps (OIS) suggesting that a third consecutive quarter-point cut is virtually assured. There is even a 15% chance of a more substantial 50bps cut.
At its July meeting, the BoC announced its second cut in a row, keeping the door wide open for more action in upcoming gatherings. Since then, the monthly GDP data revealed that the economy slowed in May from April and approached stagnation in June. The employment report revealed a greater loss of jobs in July compared to June, and, most importantly, inflation continued its downward trajectory.
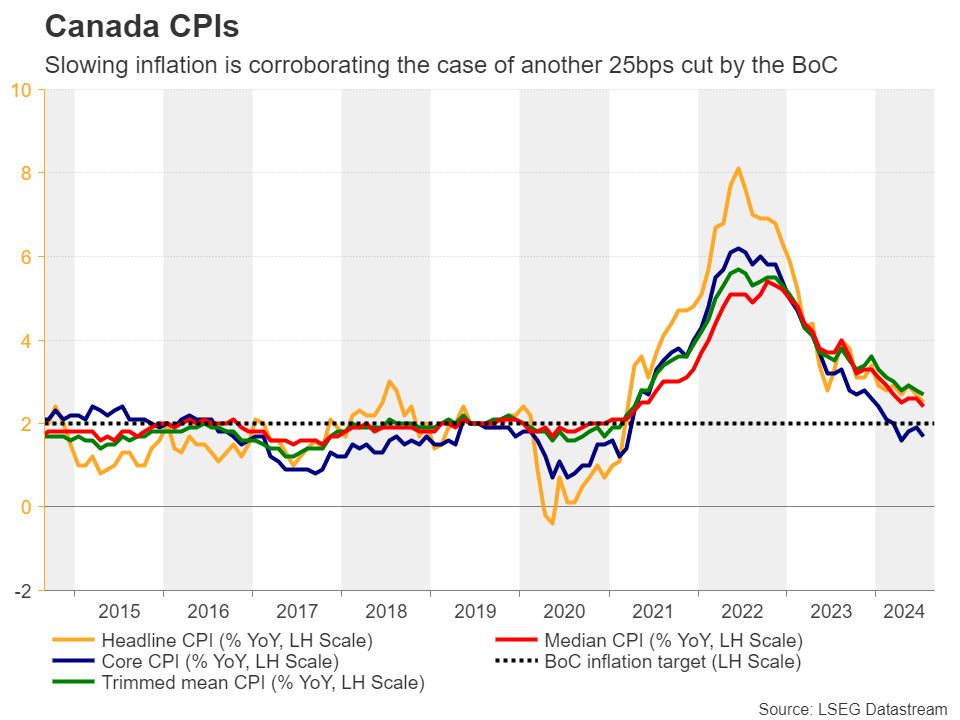
The data justifies the expectation that the Bank will cut again at this gathering, suggesting also that policymakers will maintain a highly accommodative stance. The loonie may slide in such a case but considering that rate cuts have already been anticipated for each of the remaining meetings this year, the broader outlook for dollar/loonie is unlikely to change.
Due to its risk-sensitive nature, the loonie has recently been enjoying inflows, as risk appetite remains elevated in the face of aggressive Fed rate cut bets, and should the US data corroborate that view, the prevailing downtrend in dollar/loonie may stay intact.
The Canadian jobs data are due to be released on Friday, at the same time with the US employment report.
Will Australia’s GDP numbers halt the aussie’s rally?
Aussie traders will also stay busy next week as apart from changes in the broader market sentiment, they will also have to digest Australia’s GDP data for Q2 on Wednesday, as well as China’s Caixin manufacturing and services PMIs on Monday and Wednesday.
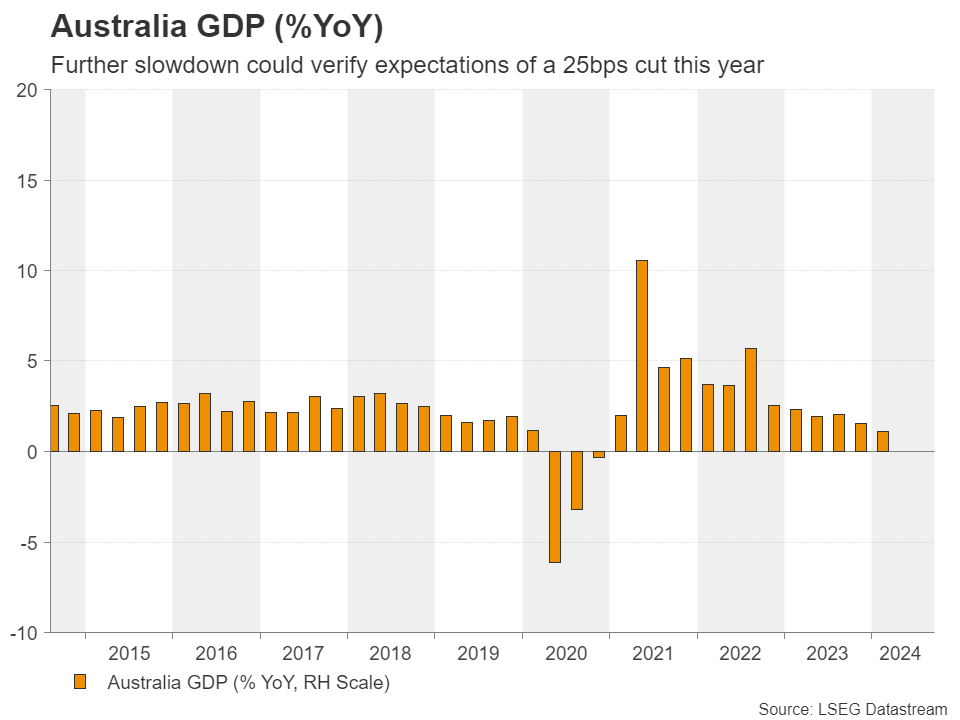
When they last met, RBA policymakers decided to keep interest rates unchanged at 4.10%, adding that they remain willing to further tighten policy as inflation, although declining, remains elevated. Yet, the market is not penciling any additional rate hikes. On the contrary, traders are almost fully pricing in a 25bps cut by the end of the year and soft data may verify their view.
If so, the aussie could give back a portion of its latest aggressive gains, but the fact that RBA expectations are way less dovish than other major central banks, combined with the broader risk appetite, may keep any GDP-related losses limited and short-lived.
Weekly Focus – Jobs Report Set to Guide Central Banks in September
Markets were in waiting mode ahead of final pivotal data releases before September's round of central bank meetings. Equity markets were mixed, with European main indices outperforming their US counterparts amid Nvidia's somewhat disappointing earnings report, while bond yields were little changed. The post-Jackson Hole rally in EUR/USD cooled off, with the cross declining back below 1.11. Oil prices rose modestly due to supply concerns in Libya with Brent hovering close to USD80/bbl, as the situation remains unresolved (see Reuters).
Preliminary euro area August HICP showed headline inflation cooling to 2.2% y/y - the slowest pace in three years. That said, the decline was largely driven by negative base effect in energy prices, as core inflation was virtually unchanged at 2.84% y/y (July 2.85%).
In the US, Conference Board's August consumer sentiment survey was strong on the headline level but with soft details. Consumers turned more optimistic both with regards to current economic conditions (134.4; from 133.1) as well as the future outlook (82.5; from 81.1), but still saw their employment prospects weakening. The 'Jobs Plentiful' index fell to the lowest level since March 2021. Leading labour market data released so far in August has provided mixed signals, as both consumer sentiment and PMI employment indices weakened but jobless claims have still trended lower after July distortions.
Next week's most important data release will be the US August Jobs Report on Friday. We forecast a modest rebound in nonfarm payrolls growth to +170k (July +114k), we see unemployment rate remaining at 4.3% (unchanged) and average hourly earnings growth at +0.2% m/m SA (unchanged). Markets are currently pricing around 35% probability of the Fed initiating its easing cycle with a 50bp cut, but a print in line with our forecasts would likely push market pricing to converge towards a 25bp move (our call).
Leading up to Friday, US data calendar includes several other key releases as well, namely August ISM manufacturing and services indices as well as the July JOLTs data. Job openings from the latter are a key measure of labour demand for the FOMC.
Labour markets remain in focus in the euro area as well. ECB's key measure of wage growth, the Q2 Compensation per Employee data, is due for release on Friday. The ECB staff projections from June estimated that wage growth would increase to 5.1% y/y in Q2 from 5.0% y/y in Q1, but the indicator of negotiated wages (Q2 +3.6% y/y; Q1 +4.7%) pointed towards clear downside risks. Markets have fully priced in ECB's 25bp cut at the September meeting, in line with our call. Focus is turning towards the final meetings of 2024, where we expect one more cut in December. Markets price in cumulative 37bp for the last two meetings of the year, implying a 50% probability of the next move coming already in October.
Leading data is due for release from China as well. Official NBS PMIs will be released already tomorrow on Saturday and the private Caixin manufacturing PMI will follow on Monday. The manufacturing indices have sled below the neutral level of 50 over summer, where we expect them to remain, reflecting continued growth challenges in China.
Sunset Market Commentary
Markets
Easy base effects due a high monthly EMU CPI reading last year already foreshadowed a substantial cooling of EMU headline inflation this month. On top of that, German (2.0%) and Spanish (2.4%) national data published yesterday surprised slightly to the downside. Maybe there was room for the EMU figure to also touch the psychological barrier of 2%? This didn’t materialize. The August Flash CPI printed exactly in line with consensus (headline 0.2% M/M and 2.2% Y/Y, core 2.8% from 2.9%). Slightly higher than expected French data prevented the hoped for bigger decline. Aside from favourable base effects, disinflation was mainly driven by lower energy prices (-1.0% M/M and -3.0% Y/Y). However core inflation (ex-energy, fresh food, alcohol & tobacco) still rose 0.3% M/M and 2.8% Y/Y. Services inflation is holding well above an underlying dynamics of 2% (0.4% M/M and 4.2% Y/Y from 4.0%). Core data only confirm that disinflation hasn’t reached a point yet for the ECB to pre-commit on the pace of further easing beyond the September meeting. In this respect, ECB’s Schnabel already before the CPI release indicated that policy still has to focus on inflation. Any easing should proceed gradually and cautiously as inflation momentum continues to be (too) high. In this context, there is no reason for markets to leave current indecisive pricing between 2 or 3 25 bps ECB rate cuts for the 3 remain meetings of this year. In the US, July personal income (0.3%) and spending (0.5) confirmed that the consumer stays in good shape. The closely watched price deflators also were almost exactly as expected (0.2% M/M and 2.5% Y/Y, core 0.2% M/M 2.6% Y/Y). The reaction to the data was limited. Yields drifted cautiously higher, confirming a ST bottoming pattern going into the US long weekend (Labour Day on Monday) and ahead of next week’s key data releases (ISM’s, payrolls). US yields add between 3.0 bps (2-y) and 0.5 bp (30-y). Similar pattern for in the EMU with the German 2-y yield adding 3.5 bps. The 30-y trades little changed. On FX, the dollar still extends its comeback but gains are more modest compared to yesterday and Wednesday (DXY 101.55 from 101.37, USD 1.1065 from 1.1075). EUR/GBP tested the 0.84 barrier, but no break occurred yet (0.8415). Equities still (gradually) extend the rally post the early month sell-off (Eurostoxx 50 + 0.1%, S&P +0.5%).
News & Views
The Chinese central bank has begun to actively trade government bonds in the market. In a statement on its website, the PBOC explained that it sold long-dated bonds while buying ones with shorter maturities. The combination resulted in a net purchase of CNY 100bn. There has been speculation about this for months after the central bank warned multiple times before taking other actions earlier in August on the investor stampede into the government bond market that pushed (long-term) yields to the lowest in many years. The Silicon Valley Bank saga in mind, Chinese authorities fear the liquidity and broader financial stability consequences in case of a sudden market reversal. At the same time, the central bank is seeking a steep-enough yield curve to provide incentives to invest and lend – hence the operation twist – at a time when the Chinese economy is struggling to regain traction. Both the Chinese yuan and yields reacted stoic though the news got out in late Asian trading hours. USD/CNY is extensively testing the December 2023 2-yr low around 7.08.
The Canadian economy grew a more than expected 2.1% q/q (annualized) in Q2 of this year. That is quicker than the 1.8% seen in Q1 and penciled in by analysts. Government consumption was a major driver, adding 1.27 ppts to the number. Household consumption contributed a mere 0.34 ppts. Business investments added some 0.8 ppts, about evenly split between business and governments. A drop in imports did not make up for the bigger decline in exports, producing a net export contribution of about -0.4 ppts. The Canadian dollar and government bond yields pared a kneejerk move higher after the growth details nuanced the headline beat. USD/CAD is trying to recover the 1.35 big figure on USD strength as well. Canadian yields maintain some of the gains but it’s limited to 2.0 bps at the front end of the curve. Money market expectations for the Bank of Canada’s meeting next week barely budged with a third 25 rate cut more than priced in.
Graphs
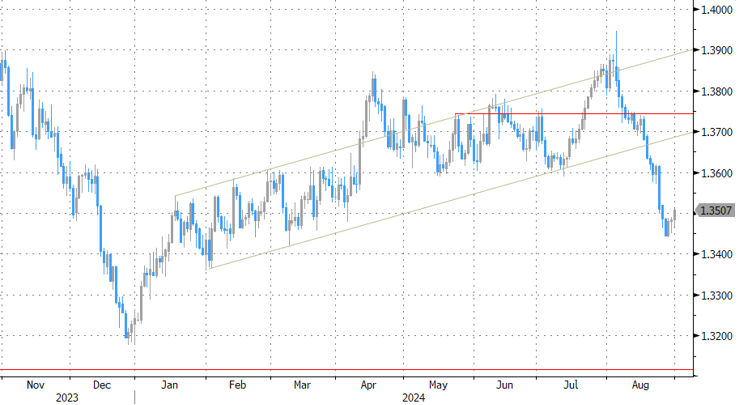
USD/CAD: Loonie doesn’t profit from better Q2 Canada GDP growth. BoC expected to continue easing next week.
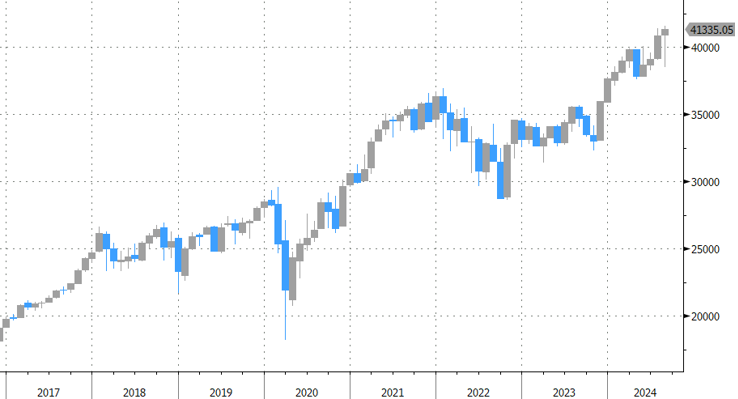
Dow Jones industrial Index more than reverses early August sell-off to set now all time record on hoped for soft landing of US economy
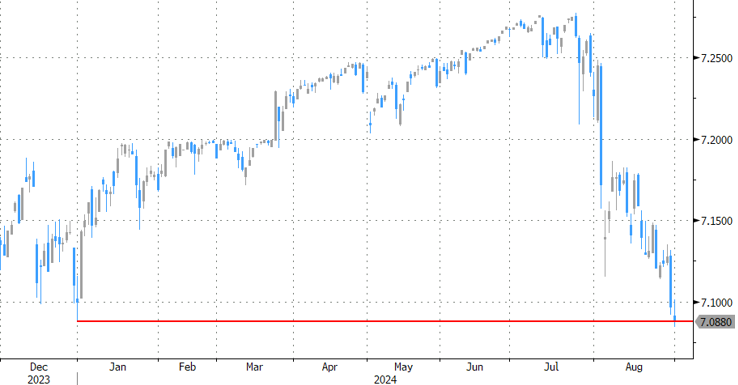
USD/CNY testing end 2023 low as yuan strength takes over from USD correction earlier this month.
US 2y yield shows ST signs of bottoming as quite some Fed easing is discounted. Next week’s data to decide on next directional move.
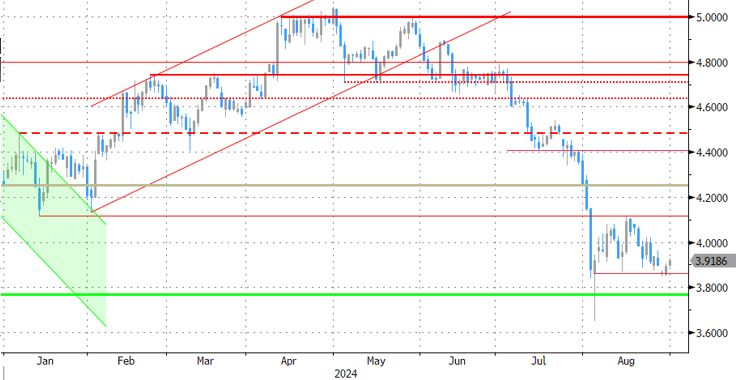
Gold Tries to Break Out of a Triangle
Gold has hit a glass ceiling at $2525 an ounce on the spot market, which it has been battling against for the past two weeks. A series of smaller and smaller pullbacks and more frequent rallies to the resistance indicate impressive buying pressure. Under these conditions, we should expect a breakout to the historical highs soon, but it will be important to watch how the price behaves afterwards.
Over the past two weeks, a triangle of horizontal resistance and rising support has formed on the gold chart. This is a clear indication that buyers are taking the initiative at increasingly higher levels.
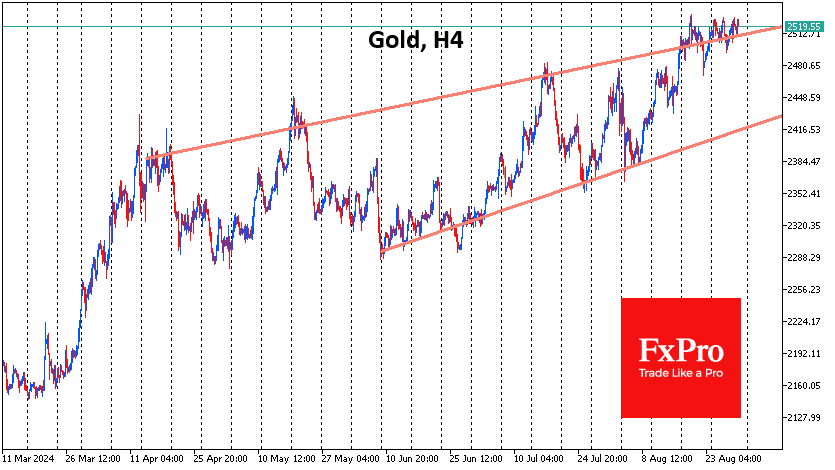
The same conclusion can be drawn if we look at the longer-term chart period since April, when the trend of increasingly shallow corrections continued. The current consolidation is an oscillation around the upper boundary of the uptrend since then.
In the daily timeframe, we continue to see a divergence between the RSI and the price trend, which is a sign of upward exhaustion. However, we saw a similar situation from October 2023 to February 2024, which was followed by a strong uptrend rather than a short-term uptrend.
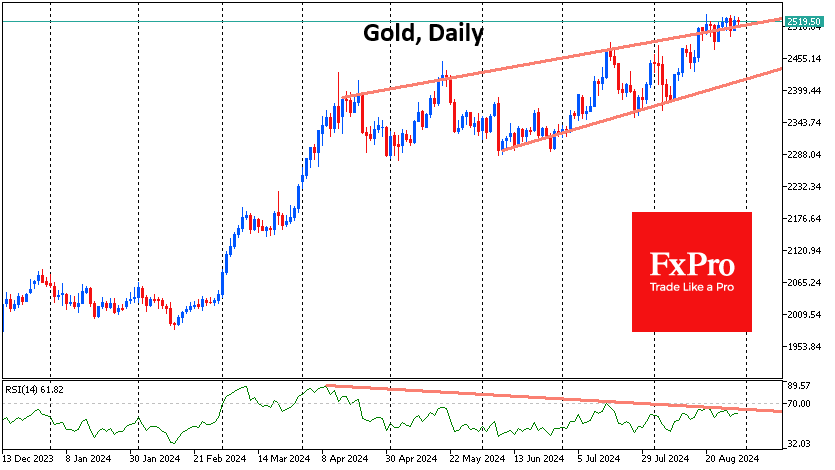
One of the main drivers of the gold price over the past two months has been the dollar’s near 5% weakness against a basket of major currencies, which largely explains the 8.5% appreciation in the ounce. However, we note that the DXY is attempting to reverse its direction to the upside as it reaches the lower end of its trading range in early 2023.
Together, these signals point to a likely near-term break of resistance with a renewal of historical highs, which could be followed by a medium- or even long-term reversal in the dynamics of the gold price.
If we take a look beyond the charts, gold’s short-term fate will be determined by the Fed’s monetary policy outlook: how much it will cut interest rates before the end of the year. The monthly Employment report on September 6th and the CPI on the 11th will help clarify the answer.
U.S. Consumers Start Q3 on an Upbeat Note; Income and Spending Rise, Inflation Stable
Personal income grew 0.3% month-on-month (m/m) in July, up from June's 0.2% gain and above market expectations (0.2%).
Accounting for inflation and taxes, real personal disposable income grew 0.1% for a second consecutive month.
Personal consumption expenditures growth accelerated in July, up 0.5% m/m. This was higher than the 0.3% recorded in June, but in line with market expectations (0.5%). Spending in real terms rose 0.4% m/m – adding to the upwardly revised 0.3% gain recorded in June (previously 0.2%). The uptick in real spending reflected increases in both goods (0.7%) and services (0.2%) outlays.
On inflation, the Fed's preferred inflation metric, the core PCE price deflator, held steady on both a monthly and annual basis. Core PCE rose 0.2% m/m and 2.6% annually. While the monthly reading was in line with market expectations (0.2%), the annual number came in marginally lower than expected (2.7%). Notably, on a 3-month annualized basis, the measure slid to 1.7% in July from 2.1% in June.
The personal savings rate declined to 2.9% in July from a downwardly revised 3.1% in June (previously 3.4%). This is the first time the measure has fallen below 3% in over 2 years.
Key Implications
Consumers seemed to have relied more heavily on savings to keep consumption going in July. While the resilience they have displayed thus far has been impressive, the slowdown in the job market and diminished savings will put this to the test going forward. As such, consumer spending, while not grinding to a halt, is expected to lose some momentum as the year draws closer to an end.
On the inflation front, the Fed's preferred core measure continues to maintain the recent cooling trend. While not slowing further, it has also not accelerated. What's more, on a 3-month annualized basis core PCE continues to decelerate from the flare-up in Q1 and has fallen below the Fed's 2% target for the first time since last December. On balance, there is nothing in today's report that would dissuade the Fed from cutting rates in September.
USD/CHF Mid-Day Outlook
Daily Pivots: (S1) 0.8418; (P) 0.8456; (R1) 0.8512; More…..
Intraday bias in USD/CHF remains neutral as consolidations continues above 0.8399. Further decline is expected as long as 0.8540 minor resistance holds. Break of 0.8339 will resume the decline from 0.9223 and target 61.8% projection of 0.9049 to 0.8431 from 0.8747 at 0.8365, and then 0.8332 low. However, firm break of 0.8540 will turn bias back to the upside for 0.8747 resistance instead.
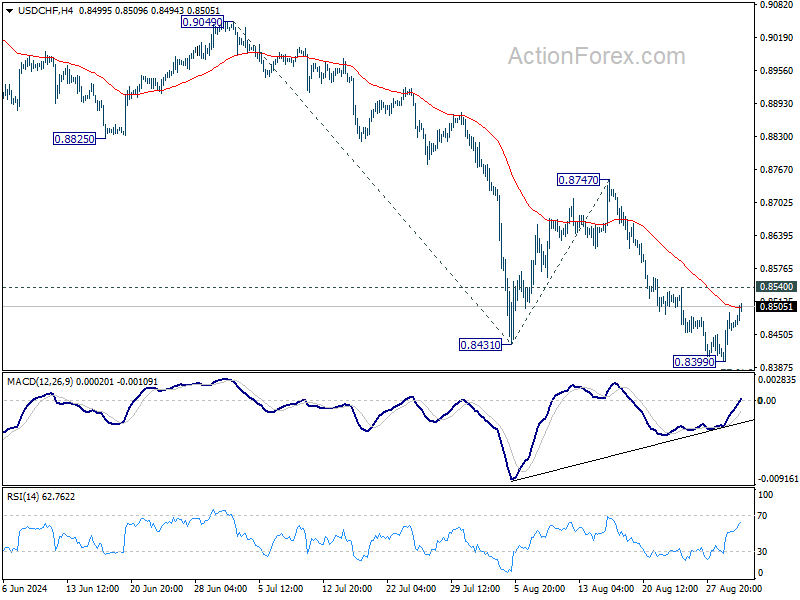
In the bigger picture, price actions from 0.8332 (2023 low) are currently seen as a medium term corrective pattern, with fall from 0.9223 as the second leg. Strong support could be seen from 0.8332 to bring rebound. Yet, overall outlook will continue to stay bearish as long as 0.9243 resistance holds. Firm break of 0.8332, however, will resume larger down trend from 1.0146 (2022 high).
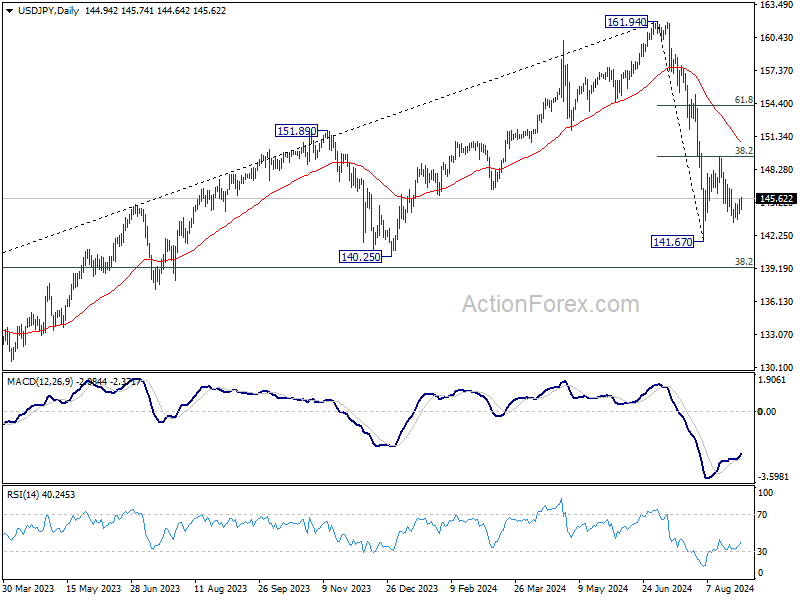
USD/JPY Mid-Day Outlook
Daily Pivots: (S1) 144.28; (P) 144.92; (R1) 145.61; More...
Outlook in USD/JPY is unchanged. Intraday bias remains neutral and further fall is in favor with 146.47 minor resistance intact. Break of 143.43 will bring retest of 141.67 low. Firm break there will resume the whole fall from 161.94 to 140.25 support next. On the upside, above 146.47 will turn intraday bias back to the upside for 149.35 resistance instead.
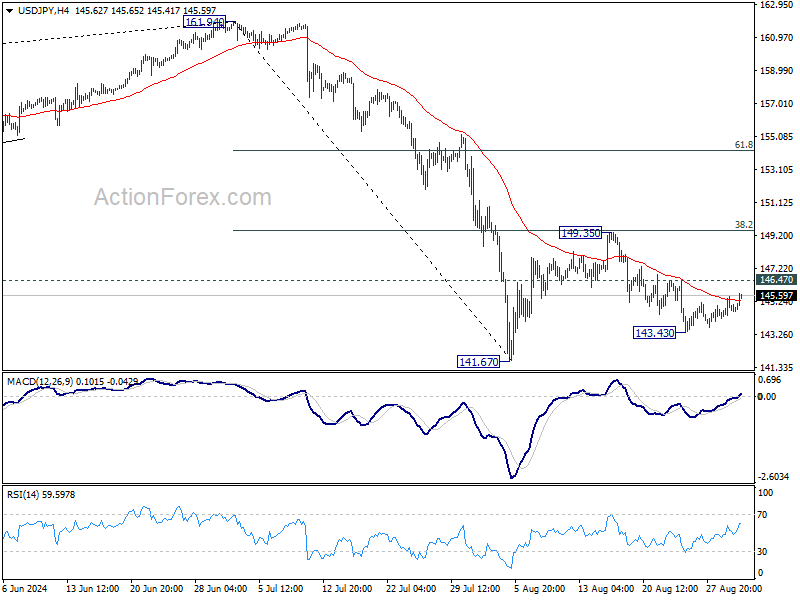
In the bigger picture, fall from 161.94 medium term top is seen as correcting whole up trend from 102.58 (2021 low). Deeper decline could be seen to 38.2% retracement of 102.58 to 161.94 at 139.26, which is close to 140.25 support. In any case, risk will stay on the downside as long as 55 W EMA (now at 149.38) holds. Nevertheless, firm break of 55 W EMA will suggest that the range for medium term corrective pattern is already set.