
Sample Category Title
EMU August Flash CPI Probably Will Confirm Yesterday Trends from Germany and Spain
Markets
Fixed income and FX markets yesterday had to cope with a divergent message from EMU and US data. German and Spanish August headline inflation slowed more than expected (German HICP -0.2% M/M and 2.0% from 2.6% vs 2.2% expected, Spain 0.0% M/M and 2.4% Y/Y from 2.9%). This provides some comfort for the ECB as it intends to further reduce policy tightening next month. However, the slowdown mainly came from lower energy prices. The progress in measures of underlying inflation was far less impressive (Spain core 2.7% from 2.8, Germany 2.8% from 2.9%, with still rather robust services inflation 0.4% M/M). Still, the data initially pushed EMU yields lower in a steepening move. However, global bond market momentum changed after the publication of US data. US Q2 GDP growth was upwardly revised from 2.8% Q/Qa to 3.0% due to strong personal consumption (2.9% from 2.3%). Weekly jobless claims also held a relatively low 231k. The Q2 GDP revision is old news but was enough for yields to close 2-3 bps higher across the curve. German yields reversed part of the initial decline though the 2-y yield still lost -2.8 bps. The 30-y added 2.1 bps. After recent dollar weakness, softer EMU CPI data this timed triggered a correction of the euro. EUR/USD dropped from the 1.1140 area to close at 1.1077. DXY rebounded from 101.00 to 101.34, but gains in the likes of USD/JPY (close 145) were modest. Equities initially also enjoyed some reflationary dynamics (EuroStoxx 50 +1.08%). US indices also opened with a constructive momentum, but mostly couldn’t hold on to initial gains (Nasdaq -0.23%). The Dow (+0.58%) finished at a new record. Markets for now apparently embrace a favourable (US) soft landing scenario.
This morning, Asian equities show broad-based gains with China outperforming. The yuan extends its comeback from earlier this month with USD/CNY testing the end-December low. The yen trades little changed after higher than expected Tokyo CPI data (USD/JPY 144.9). Later today, EMU August flash CPI probably will confirm yesterday trends from Germany and Spain (headline expected at 0.2%M/M and 2.2% Y/Y, core 2.8% from 2.9%, risks for downside ‘surprise’). With 3 additional 25 bps ECB rate cuts at each of the remaining meetings this year still not fully discounted, there is still room for some further decline in yields at the short end of the EMU yield curve. This also might trigger some further euro correction ST. In the US, the July income and spending data and the PCE deflators will be published. For the latter, a 0.2% M/M price dynamics is expected. Even in case of a mild soft surprise, we don’t expect a big market reaction with already 100 bps of cumulative Fed rate cuts discounted for this year. US markets are heading for a long weekend (Labour day). The focus will turn to next week’s key ISM’s and US labour market data. In this respect, we don’t change our call yet for the dollar to stay rather weak in the run-up the September Fed meeting.
News & Views
Tokyo inflation, the closely watched frontrunner of national inflation (September 20 release) put an October rate hike (updated GDP/CPI forecasts contrary to September meeting) by the Bank of Japan on the table. The central bank’s preferred gauge, CPI ex. fresh food, rose by 0.5% M/M with the Y/Y-figure unexpectedly accelerating from 2.2% to 2.4%. Headline inflation increased by 0.6% M/M and 2.6% Y/Y, matching the highest level YTD. Details showed goods inflation increasing by 0.8% M/M and services inflation rising by 0.3% M/M with sharper increases in costs of eating out, household services and entertainment driving the latter. While some of the inflation pick-up was the result of one-offs and base effects, it does not change the picture of a broad upswing in (service) prices. This bolsters the case for a further, be it gradual policy normalization by the Bank of Japan. The BoJ’s July hike came partially unexpected and helped cause the early August market riot, prompting some soothing comments from the central bank afterwards. Money markets therefore don’t expect much from the September 20 meeting and expect the next rate hike by December at the very earliest. Japanese bond yields trade little changed today as does the yen. USD/JPY oscillates around opening levels just south of 145.
Graphs
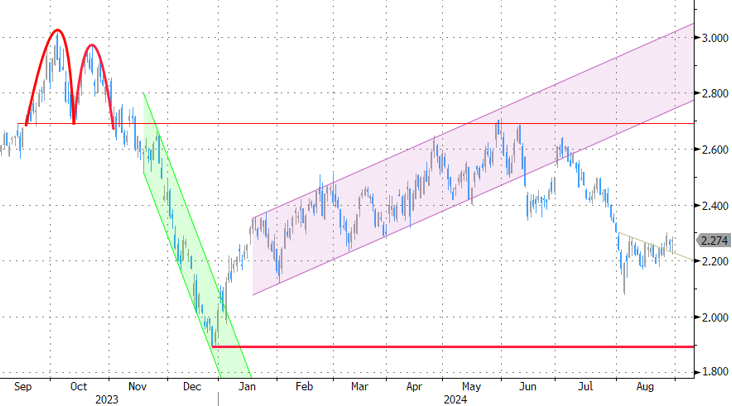
GE 10y yield
The ECB cut policy rates by 25 bps in June. Stubborn inflation (core, services) make follow-up moves less evident. Markets nevertheless price in two to three more cuts for 2024 as disappointing US and unconvincing EMU activity data rolled in, dragging the long end of the curve down. The move accelerated during the early August market meltdown.
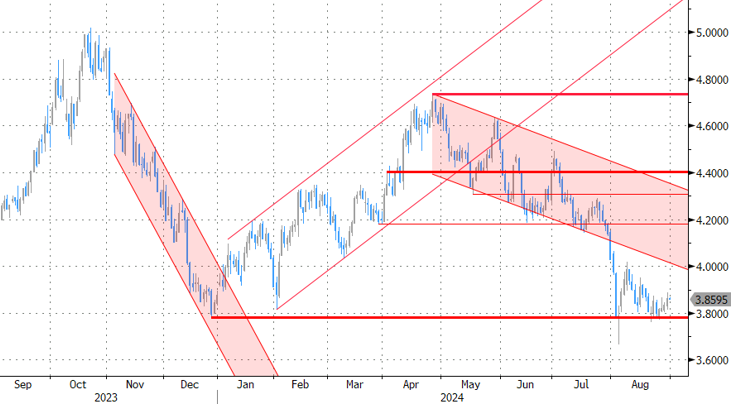
US 10y yield
The Fed in its July meeting paved the way for a first cut in September. It turned attentive to risks to the both sides of its dual mandate as the economy is moving to a better in to balance. Markets tend to err in favour of a 50 bps lift-off. The pivot weakened the technical picture in US yields with another batch of weak eco data pushing the 10-yr sub 4%. Powell at Jackson Hole didn’t challenge markets’ positioning.
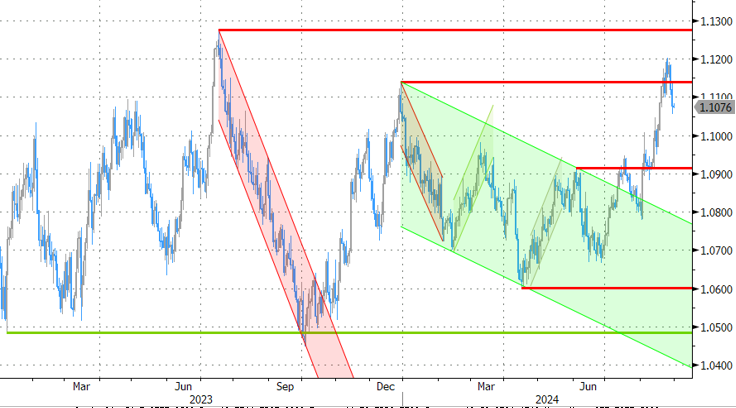
EUR/USD
EUR/USD moved above the 1.09 resistance area as the dollar lost interest rate support at stealth pace. US recession risks and bets on fast and large (50 bps) rate cuts trumped traditional safe haven flows into USD. EUR/USD 1 1.1276 (2023 top) serves as next technical reference.
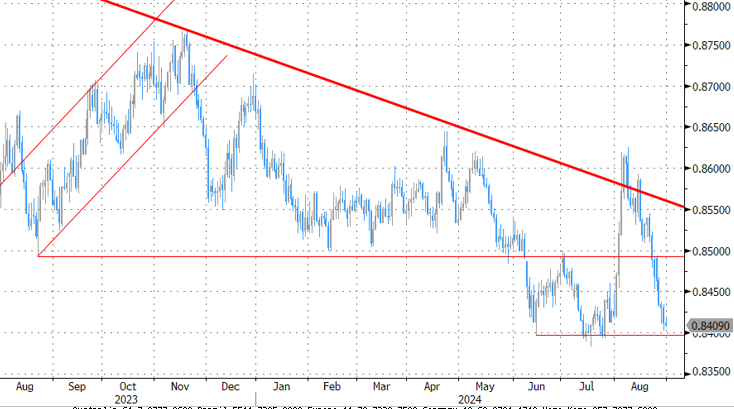
EUR/GBP
The BoE delivered a hawkish cut in August. Policy restrictiveness will be further unwound gradually on a pace determined by a broad range of data. The strategy similar to the ECB’s balances out EUR/GBP in a monetary perspective. Recent better UK activity data and a cautious assessment of BoE’s Bailey at Jackson Hole are pushing EUR/GBP lower in the 0.84/0.086 range.
Sentiment Remains Strong Despite Nvidia
Yesterday was could’ve been worse. A more than 6% drop in Nvidia somehow limited the S&P500 gains, but many stocks in the S&P500 gained yesterday after the latest GDP update came in better than expected and pointed that the US economy has grown 3% in the Q2 versus 2.8% printed earlier. The consumer spending almost doubled, as well, to 2.9% from 1.5% printed a quarter earlier. The cool down in the GDP prices was less, but core prices eased more than expected. All in all, the US economy rebounded in the Q2 but the rebound didn’t increase price pressures. In plain English, the data tasted exactly how investors love it – with the additional sweet topping – for the Fed rate cut expectations – that it has slowed in the Q3 but slowed from a higher mark.
So there was reason to cheer the latest growth update yesterday. The US 2-year yield rebounded a little, but settled around the 3.90% mark, the 10-year yield is at 3.86% - the gap between the two has almost closed : a positive sign for those who expect a soft landing, and the US dollar rebounded. The US dollar index recovered on the thinking that the Federal Reserve (Fed) will start cutting rates in September, yes, but a 50bp cut is probably not needed straight away.
But note that activity on Fed funds futures still gives two thirds chance for a 50bp rate cut from the Fed in the September meeting and the Fed is seen cutting rates by 100bp from now to the end of the year – a scenario that implies that we will see a sharp slowdown from the current quarter. Happily, the data is not *that* alarming. Therefore, I believe that there is room for trimming the Fed cut expectations to between 50-75bp cut this year, and that should justify a further positive correction in the US dollar and a further rotation in the S&P500 toward the growth-friendly, cyclical stocks – including energy and financials.
Europe vs US
Rotation from tech to other sectors, which is also called the reflation trade, is believed to be positive for the European stocks. And indeed, capital inflows into the European stocks outpaced inflows into the US markets in the Q2 – precisely boosted by the expectation that the global rate cuts would be better for the reflation-friendly European stocks than their technology-heavy American peers (and also because the European Central Bank (ECB) started cutting rates before the Fed). And the Stoxx 600 has been greatly benefiting from it. Yesterday, the index almost matched a record high that was printed back in June and remains attractive for investors who look for interesting valuations to get away from highly valued American stock markets. And despite this year’s rally, the European stocks remain significantly cheaper than the ones across the Atlantic. In numbers, the Stoxx 600 offers a PE ratio of around 14 well below the S&P500’s average 21.
The problem is that the rate cut expectations alone cannot infinitely attract investors to the old continent. Europe is slowing, its airline and luxury businesses are not doing well – the Chinese woes have a significant negative impact on the most influential luxury brands – so much that the British Burberry and EasyJet risk dropping out of the FTSE 100 index shortly. And Bloomberg Intelligence revised its consensus EPS for the Stoxx 600 down by 1.4% this year, and 1.6% for next year. Over in the US, the technology stock investors are preparing for challenging times yet the S&P500’s non-Magnificent 493 stocks saw their growth expectations more than double and should see the benefits of the upcoming rate cuts. And if the Fed can offer the US economy a soft landing, there will be nothing to stop the US indices from outperforming its European peers.
PCE watch
Today, the US will release the latest core PCE index, the Fed’s favourite gauge of inflation. The data is expected to hint at a tiny rebound in July. A stronger-than-expected read could lead to a further USD recovery. But even in that case, the Fed doves are more interested in jobs data than inflation figures. What would really change the game is… a strong jobs data from the US next week.
Currencies
The US dollar’s latest rebound pulled the EURUSD lower yesterday. Softer-than-expected German and Spanish inflation updates helped bringing the ECB doves back to the market. Inflation in Germany even fell below the ECB’s 2% target! The combination of less dovish Fed expectations and more dovish ECB expectations sent the EURUSD all the way down to 1.1070. The pair is consolidating near the 1.1075 this morning. The aggregate CPI data from the Eurozone will likely confirm the slowing price pressures in the Eurozone in a way to let the ECB consider a clearer path for easing its policy. The EURUSD could find a good reason to return below the 1.10 mark – especially if we welcome a strong jobs data from the US next week.
Elsewhere, the USDJPY consolidates a touch below the 145 mark amid a mixed bag of data released in Tokyo earlier this morning. The data showed a slower rebound in industrial production, a bigger-than-expected slowdown in retail sales, a larger-than-expected rise in unemployment rate and a stronger-than-expected inflation during late summer. We believe that ongoing price pressures will likely keep the Bank of Japan inclined toward normalization. However, if economic fundamentals deteriorate further, the BoJ could quickly reverse course and extend support to the economy. This would hinder the Japanese yen's recovery and potentially enhance carry trades.
Energy Base Effects to Drive EA August Inflation Down, Focus on Services Price Momentum
In focus today
We expect the euro area inflation data today to show that headline inflation eased to 2.2% y/y in August from 2.6% in July, driven by base effects on energy prices. We see underlying inflation remaining persistent due to sticky service inflation and a normalization of core goods inflation from the very low levels seen in the first half of the year. The most important part of the print will be the monthly increase in services inflation, which we expect to come in at around 0.3% m/m s.a. for the third consecutive month. This will still be high but at least lower than what we saw at the beginning of the year.
The Fed's preferred measure of inflation, the PCE, is due for release this afternoon. CPI data released earlier suggested that on a monthly level, underlying inflation pace has remained fairly steady from June.
Economic and market news
What happened overnight
In Japan, we got mixed signals as core inflation rose to 2.4% in Tokyo in August, which was higher than expected (cons.: 2.2%). As a leading indicator of the national CPI, the print is a signal in the hawkish direction. Retail sales rose less than expected at 2.6% (cons.: 2.9%), while unemployment also picked up. As of this morning the Nikkei is up, and the JPY has gained. Asian markets in general were also up, driven in part by yesterday's strong US macro data (see below).
What happened yesterday
Both German and Spanish inflation declined by more than expected in July to 2.0% and 2.4% y/y, respectively. The decline was mainly due to base effects on energy prices but shows that the disinflationary process is going in the right direction, which supports the case of gradual easing from the ECB.
In Sweden, Swedish Q2 GDP declined less than initially reported at -0.3% q/q as we had expected. EURSEK trended down slightly during the day but otherwise market impact was muted.
From the US, Q2 GDP growth was revised up to 3.0% y/y at an annualized rate from 2.8% previously reported, while initial jobless claims gave mixed signals as new claims fell while continuing claims increased. Both US yields and the dollar rose slightly on the news, as did equities though the gains were pared by the end of the session.
Equities: Global equities ended higher yesterday with Europe leading the advances. Equity investors essentially received what they desired in the form of Goldilocks/soft-landing data, which normally would have led to cyclical outperformance. This trend was observed in Europe; however, one major company in the US, Nvidia, disrupted the typical pattern there. Consequently, we experienced an atypical day with consumer staples and tech underperforming together. It is important to note that we should not read too much into this but rather focus on the fact that the soft-landing narrative was reinforced. The ECB gained more confidence in implementing a rate cut at their next meeting in less than two weeks. The combination of improved odds for a soft-landing and continued looser monetary policy should benefit small caps the most, which was indeed the case yesterday despite a marginal increase in US yields. In the US yesterday, Dow +0.6%, S&P 500 0.00%, Nasdaq -0.2%, and Russell 2000 +0.7%. Asian markets are broadly higher this morning, with Chinese markets leading the advances. European futures are mixed, while US futures are higher.
FI: The upward revision of the Q2 US GDP figures was the dominating theme in yesterday's session, while markets reacted very modestly to the soft German and Spanish inflation data out for August. 10Y UST yields ended the day 4bp higher, while long-end EGB yields were close to unchanged across the board. Markets continue to discount 160bp worth of rate cuts from the ECB until end-2025. The Bund ASW-spread reached a new 2.5 month low of 28.52bp, and thus the widening seen following the French elections has now been almost fully reversed.
FX: Yesterday marked the fourth consecutive day with limited FX volatility with the most notable price action being EUR/USD continuing the last sessions' move lower and the CNH extending its rebound. The EUR generally did poorly which saw EUR/SEK and EUR/NOK edge marginally lower. EUR/GBP was little changed with the cross finding support around the 0.84 level
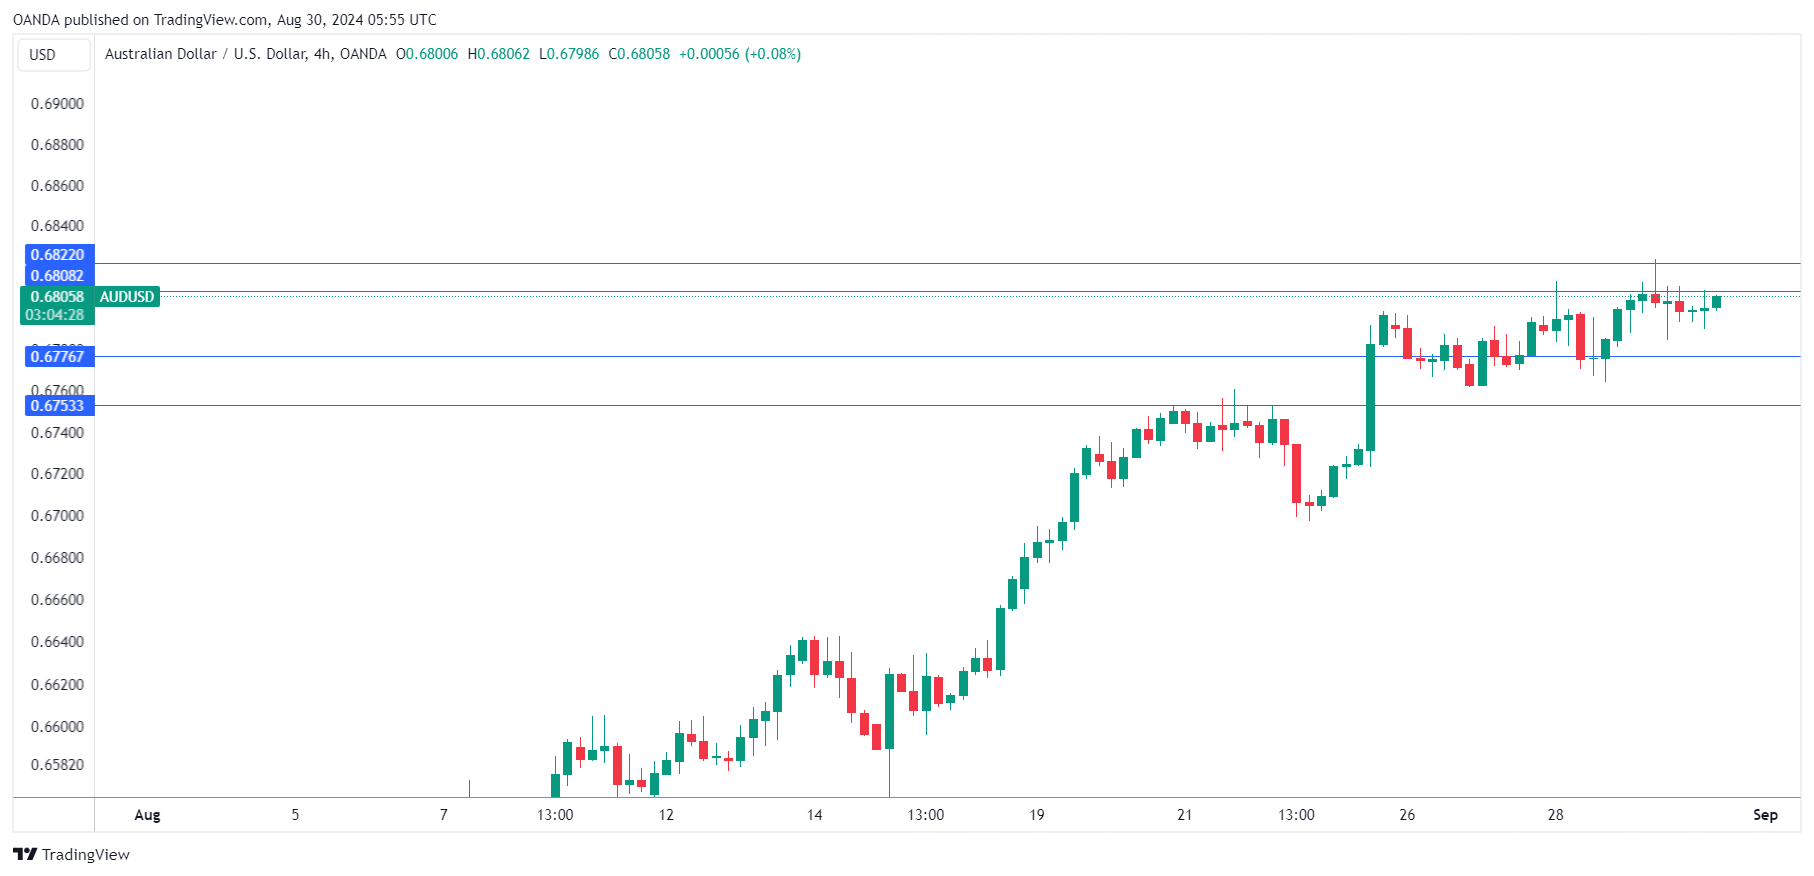
AUD/USD – Australian Retail Sales Flat, Aussie Shrugs
The Australian dollar continues to have a quiet week. AUD/USD is trading at 0.6804 in the European session, up 0.09% today at the time of writing.
Australian retail sales stagnate
Consumer spending in Australia has been weak, which has chilled economic activity. Retail sales for July didn’t provide any relief with a reading of zero, shy of the market estimate of 0.3% and well off the June gain of 0.5%. Consumers continue to feel squeezed by elevated interest rates and the high cost of living. The weak economy and a cooling labor market are making consumers even more cautious about discretionary spending.
Will today’s soft data prod the Reserve Bank of Australia to consider a rate cut? The RBA is frustrated with the slow decline in inflation – Governor Bullock has said that the central bank is unlikely to cut for six months and RBA members have been discussing a possible rate hike at recent meetings. The markets are marching to a different tune and have priced in a rate cut in November with more cuts early next year.
The remaining tier-1 events ahead of the Sept. 24 policy meeting are GDP and the employment report and both releases will be important factors in the rate decision. If these numbers are weaker than supported, it would support the case for a rate cut before year’s end.
The week wraps up with the US Core PCE Price index, considered the Federal Reserve’s preferred inflation indicator. The markets are expecting a small increase in July – from 2.5% to 2.6% y/y and 0.1% to 0.2% m/m. A small move is unlikely to concern the Fed, which has shifted its focus to the weakening labor market now that the battle with inflation is largely over.
AUD/USD Technical
- AUD/USD is testing resistance at 0.6808. Above, there is resistance at 0.6822
- 0.6776 and 0.6754 are providing support
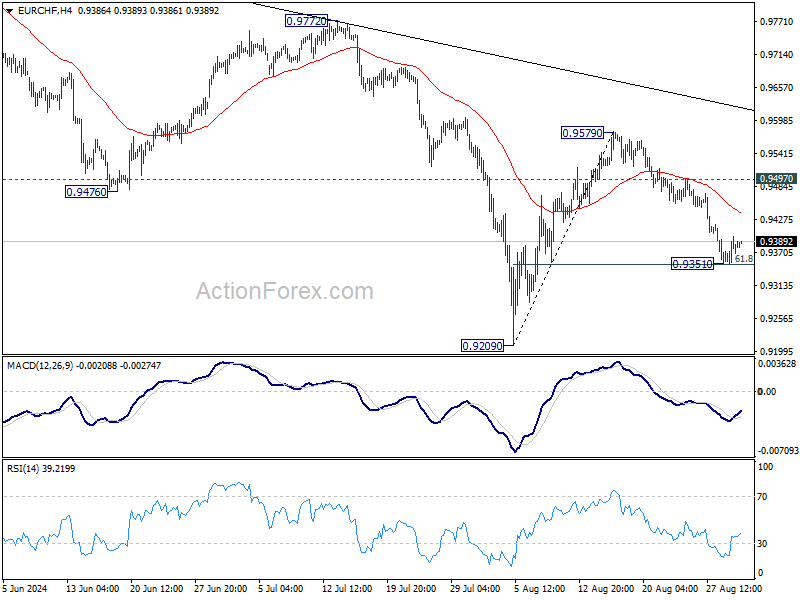
EUR/CHF Daily Outlook
Daily Pivots: (S1) 0.9361; (P) 0.9380; (R1) 0.9407; More....
A temporary low is formed at EUR/CHF at 0.9351, inch above 61.8% retracement of 0.9209 to 0.9579 at 0.9350. Intraday bias is turned neutral for some consolidations. Further decline is expected as long as 0.9497 resistance holds. Firm break of 0.9350 will pave the way to retest 0.9209 low. However, break of 0.9497 will turn bias back to the upside for 0.9579 resistance instead.
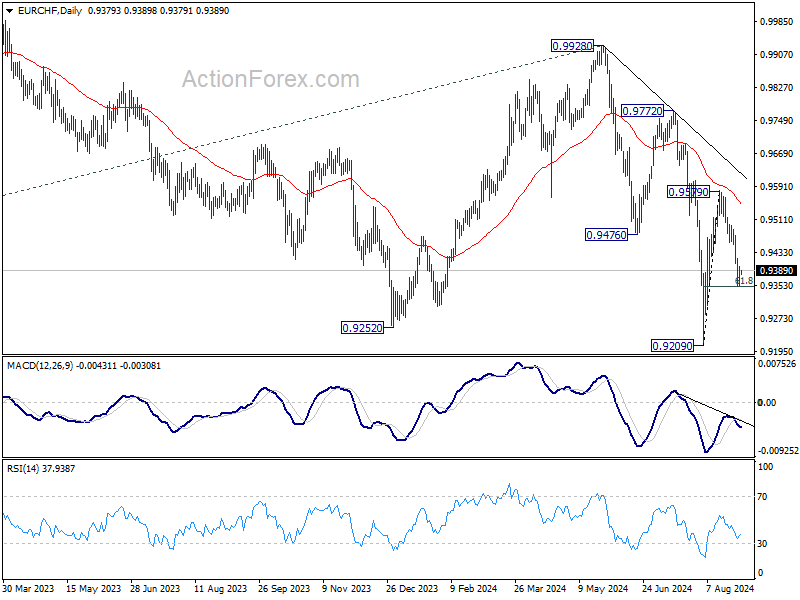
In the bigger picture, medium term corrective pattern from 0.9407 (2022 low) might have completed with three waves to 0.9928. Decisive break of 0.9252 (2023 low) will confirm long term down trend resumption. Next target will be 61.8% projection of 1.1149 to 0.9407 from 0.9928 at 0.8851. For now, outlook will stay bearish as long as 0.9928 resistance holds, even in case of strong rebound.
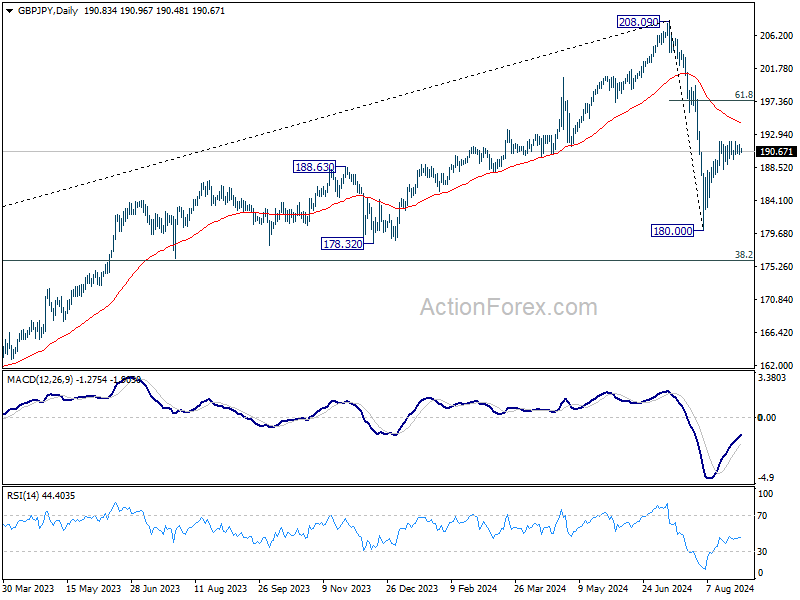
GBP/JPY Daily Outlook
Daily Pivots: (S1) 190.24; (P) 190.85; (R1) 191.33; More...
GBP/JPY continues to stay in range below 191.99 and intraday bias remains neutral. On the upside, above 191.99 will target 61.8% retracement of 208.09 to 180.00 at 197.35, as the second leg of the corrective pattern from 208.09. On the downside, however, firm break of 187.84 support will argue that rebound from 180.00 has completed, and turn bias back to the downside for retesting 180.00 instead.
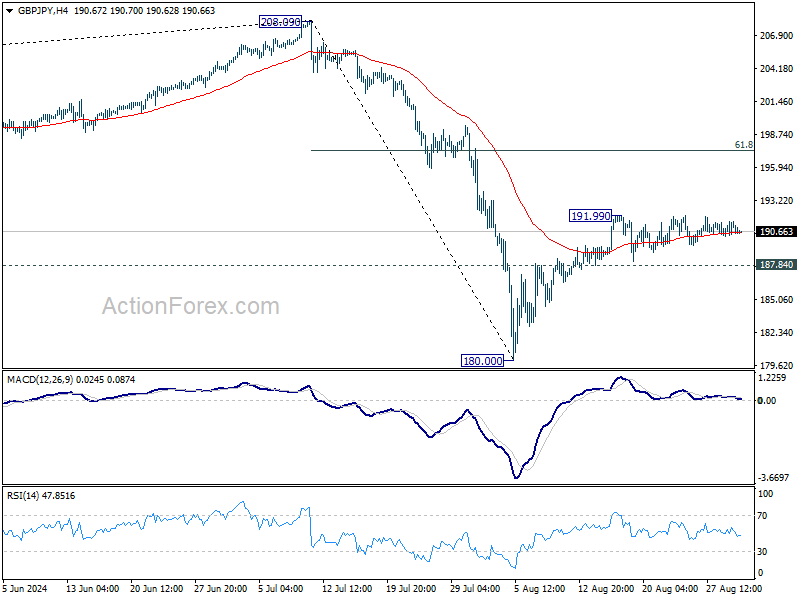
In the bigger picture, price actions from 208.09 are seen as a correction to whole rally from 123.94 (2020 low). Current development suggests that the first leg has completed and the range of medium term consolidation should be set between 38.2% retracement of 123.94 to 208.09 at 175.94 and 208.09.
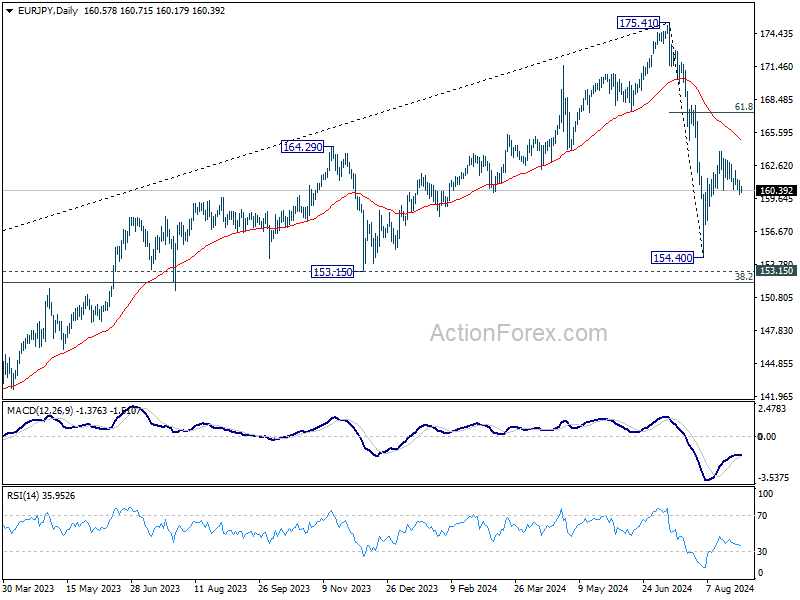
EUR/JPY Daily Outlook
Daily Pivots: (S1) 160.00; (P) 160.63; (R1) 161.24; More....
EUR/JPY continues to stay in range below 163.86 and intraday bias remains neutral. On the upside, break of 163.86 will target 61.8% retracement of 175.41 to 154.40 at 167.38, as the second leg of the corrective pattern from 175.41. On the downside, however, firm break of 159.80 support will suggest that the rebound from 154.40 has completed, and turn bias back to the downside for 154.40 instead.
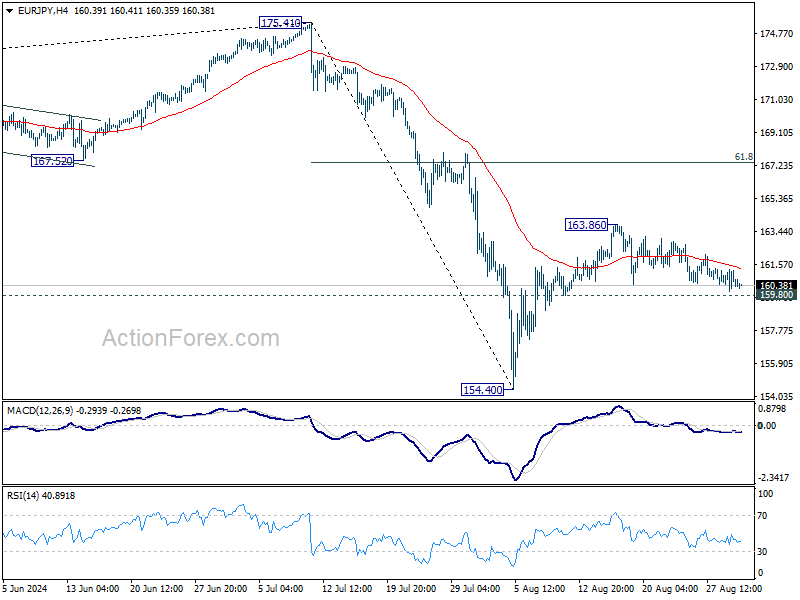
In the bigger picture, price actions from 175.41 are seen as correction to rally from 114.42 (2020 low). Current development suggests that the first leg has completed. The range of consolidation should be seen between 38.2% retracement of 114.42 to 175.41 at 152.11 and 175.41 high.
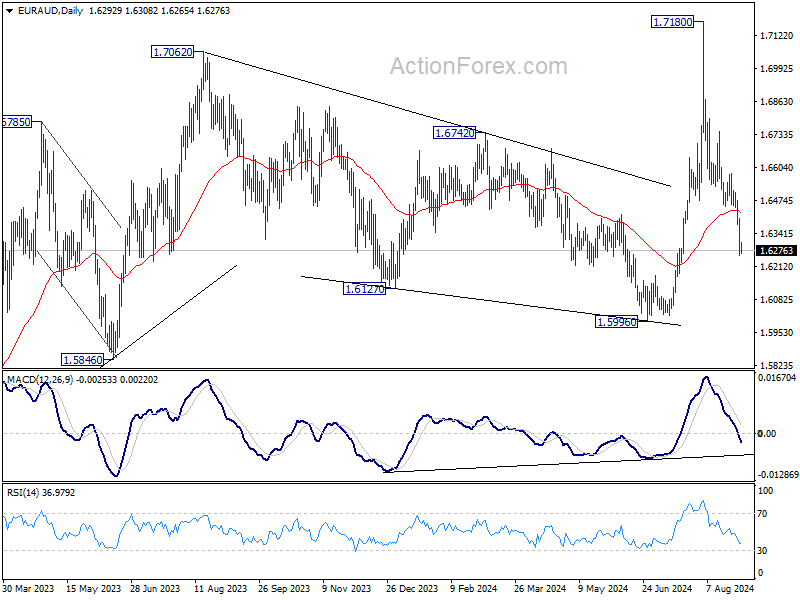
EUR/AUD Daily Outlook
Daily Pivots: (S1) 1.6234; (P) 1.6319; (R1) 1.6379; More...
EUR/AUD's fall from 1.7180 is in progress and intraday bias stays on the downside for 1.5996 support. Strong support could be seen there to bring rebound. On the upside, above 1.6117 minor resistance will turn intraday bias remains neutral first.
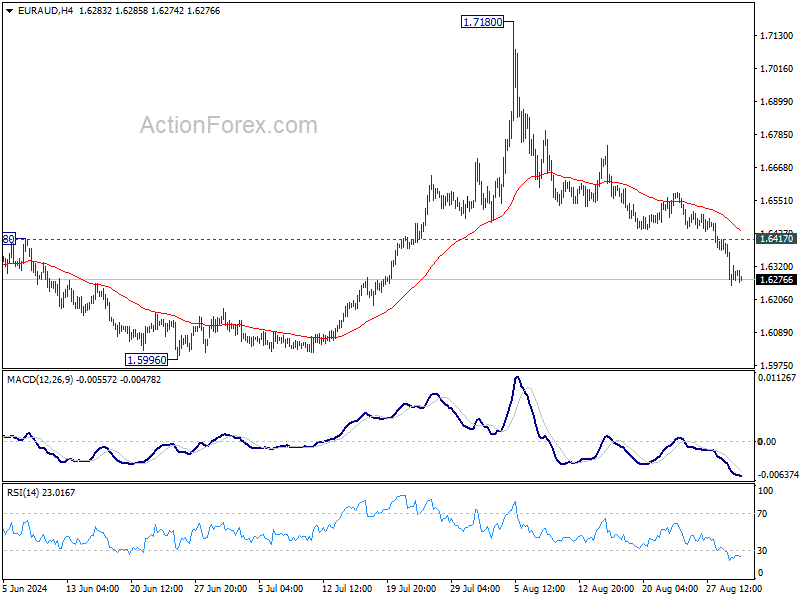
In the bigger picture, outlook is mixed up by the deeper than expected fall from 1.7180. Yet as long as 1.5996 support holds, up trend from 1.4281 (2022 low) is still expected to resume at a later stage. Firm break of 1.7180 will pave the way to 61.8% projection of 1.4281 to 1.7062 from 1.5996 at 1.7715.
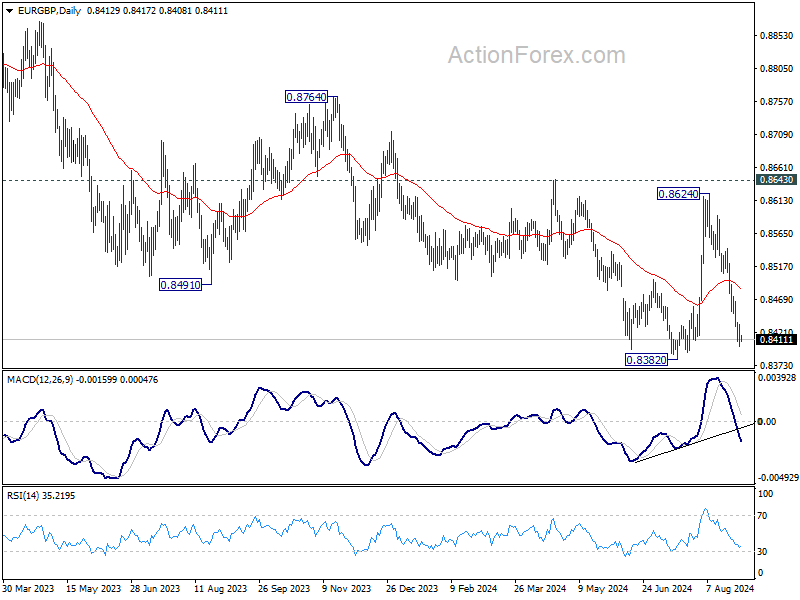
EUR/GBP Daily Outlook
Daily Pivots: (S1) 0.8399; (P) 0.8417; (R1) 0.8430; More....
EUR/GBP's fall from 0.8624 is still in progress and intraday bias stays on the downside for retesting 0.8382 low. Strong support could be seen from there to bring rebound on first attempt. Above 0.8449 minor resistance will turn intraday bias neutral first. But risk will stay on the downside as long as 55 D EMA (now at 0.8484) holds. Firm break of 0.8382 will confirm larger down trend resumption.
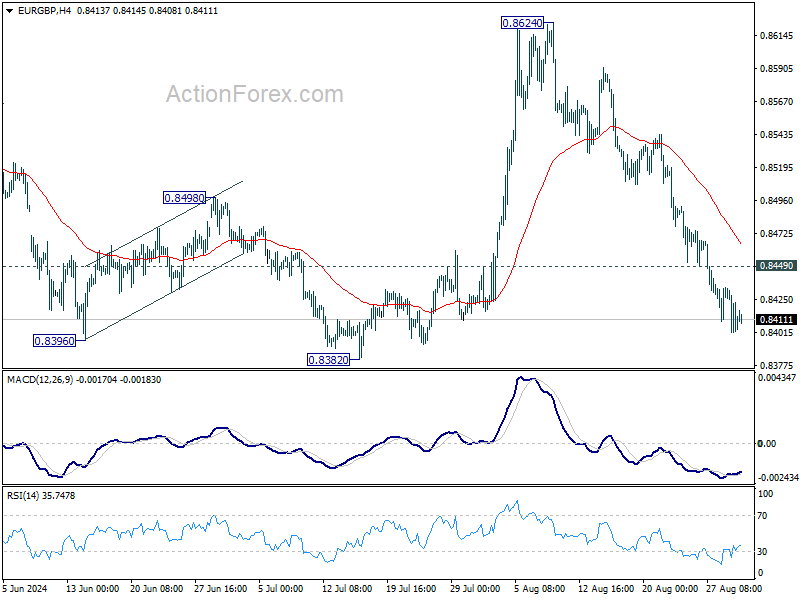
In the bigger picture, while the rebound from 0.8382 is strong, there is no confirmation of trend reversal yet. As long as 0.8643 resistance holds, down trend from 0.9267 could still resume through 0.8382 at a later stage towards 0.8201 (2022 low). However, firm break of 0.8643 will indicate that such down trend has completed, and turn outlook bullish for 0.8764 resistance next.
Resilient Risk Sentiment Limits Dollar Rebound, Eurozone and US Inflation Reports Take Center Stage
Trading activity was notably subdued in the final Asian session of the week and August, but with a busy economic calendar ahead, volatility could pick up soon. Euro remains the weakest performer of the week, as the broad slowdown in inflation, reflected in data from Germany, Spain, Belgium, and Ireland, points towards another ECB rate cut in September. This trend is expected to be further confirmed by today's Eurozone CPI flash report.
Currently, economists are still anticipating that ECB will continue to cut interest rates at a quarterly pace, with reductions in September and December. However, the faster-than-expected decline in inflation is raising the possibility of a more aggressive easing path by ECB. If Germany's economy deteriorates further into recession and the temporary boost from the Olympics fades quickly in France, ECB may be compelled to act more forcefully.
Meanwhile, Dollar is attempting to recover this week, but it is struggling to find clear momentum, especially against commodity currencies. Yesterday's data showed an upward revision of US Q2 GDP to a 3% annualized rate, easing some recession fears. However, Dollar's gains have been capped by resilient risk sentiment, highlighted by DOW reaching another record high. Investors are now focused on today's release of the PCE core price index, Fed's preferred inflation gauge, which could offer more insights into the pace of the anticipated easing cycle beginning in September.
For the week overall, New Zealand Dollar is the strongest performer, followed by Canadian Dollar and Swiss Franc. British Pound, the second worst, is trailing just ahead of Euro, while Yen is also on the weaker side. Dollar and Australian Dollar are positioned in the middle of the performance chart.
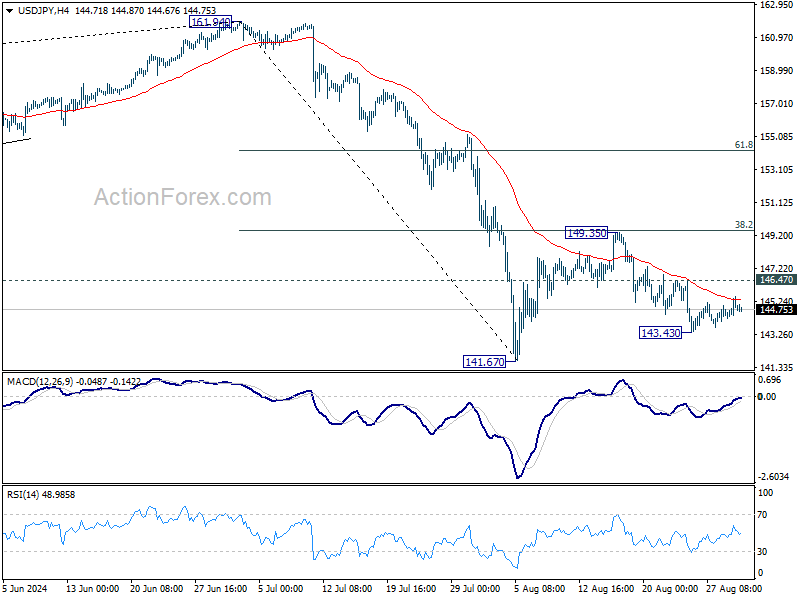
Technically, USD/JPY's decline from 149.35 remains alive despite weak downside momentum. Break of 143.43 will bring deeper fall to retest 141.67 low. Further break there will resume whole fall from 161.94. Nevertheless, break of 146.47 minor resistance will bring stronger rebound towards 149.35 resistance, with prospect of resuming the rise from 141.67 low. The next significant move could depend on the market's reaction to today's US PCE data, particularly its impact on treasury yields.
In Asia, at the time of writing, Nikkei is up 0.58%. Hong Kong HSI is up 1.48%. China Shanghai SSE is up 1.25%. Singapore Strait Times is up 0.60%. Japan 10-year JGB yield is up 0.0167 at 0.907. Overnight, DOW rose 0.59% S&P 500 fell -0.00%. NASDAQ fell -0.23%. 10-year yield rose 0.026 to 3.867.
SNB's Jordan: Strong Franc and weak European demand squeeze Swiss industry
SNB Chairman Thomas Jordan, who is set to step down at the end of September, highlighted the challenges facing Swiss industry due to the recent strength of the Swiss Franc and weak demand in Europe. Speaking at an event overnight, Jordan emphasized the difficulties these factors pose for Swiss industrial goods, particularly given that Germany and Europe are the primary markets for the country's industry.
"Germany and Europe are the main markets for industry. If the growth is weak there, this automatically affects demand for our industrial goods," Jordan stated. He also acknowledged that the strong exchange rate adds further pressure, noting, "The exchange rate ... does not make the situation easier. It makes it difficult for the industry."
Jordan reaffirmed SNB's commitment to maintaining price stability, defined as an inflation rate of 0-2%, which he described as a "crucial precondition for prosperity." He reiterated that interest rates remain SNB's main tool for achieving this stability, though interventions in currency markets are also on the table if needed.
Looking ahead, markets are currently pricing in a 70% chance of a 25bps rate cut by SNB at their next meeting on September 26, with a 30% probability of a more aggressive 50bps cut.
ECB's Nagel warns against cutting rates too quickly
Bundesbank President Joachim Nagel delivered a strong message overnight, cautioning that a timely return to price stability cannot be taken for granted." He emphasized that ECB must tread carefully and "must not lower policy rates too quickly,"
"We are not there yet. While our 2% target is in sight, we have not reached it," he added.
Nagel highlighted concerns that inflation, although nearing 2% target in late summer, is likely to rebound and remain above target well into 2025 due to persistent increases in service costs.
Addressing the differing views within ECB's Governing Council, Nagel acknowledged the "intense" debates that typically accompany "turning points in the interest-rate cycle".
However, he sought to dispel any notion of broader disagreement, stating, "When making their decisions, monetary policymakers are always faced with some degree of uncertainty. That is why a certain diversity of opinion among them as well as scope for their own judgment are considered features, not bugs."
Japan's Tokyo inflation accelerates in Aug as production and retail sales miss estimates in Jul
Japan's Tokyo CPI data for August shows further acceleration in inflation, with core inflation (excluding food) rising to 2.4% yoy, above the expected 2.2%. CPI core has been climbing steadily every month since hitting a bottom of 1.6% yoy in March.
Core-core CPI, which excludes both food and energy, also ticked up to 1.6% from 1.5%, while headline CPI surged to 2.6% from 2.2%.
These figures are often seen as a leading indicator for nationwide trends. Some economists noted that rise in prices growth was primarily driven by the phase-out of government subsidies on utility bills and a spike in rice prices. Underlying inflation trends may moderate in the coming months as these one-time factors dissipate.
Also released today, Japan's industrial production rose by 2.8% mom in July, slightly below the expected 3.3%. Looking ahead, manufacturers surveyed by the Ministry of Economy, Trade, and Industry anticipate 2.2% increase in output for August, followed by -3.3% contraction in September.
Retail sales growth also slowed to 2.6% yoy in July, down from 3.7% in June, and below the expected 2.9%.
Additionally, the unemployment rate rose to 2.7% from 2.5%, surpassing expectations of it remaining steady at 2.5%. The jobs-to-applicants ratio, however, edged slightly higher to 1.24.
Australia's retail sales stagnate in Jul as spending momentum stalls
Australia's retail sales turnover for July showed no growth on a monthly basis, falling short of the expected 0.2% mom increase. This flat result comes after consecutive 0.5% mom increases in both June and May, driven by mid-year sales events.
According to Ben Dorber, head of retail statistics at the Australian Bureau of Statistics, "After rises in the past two months boosted by mid-year sales activity, the higher level of retail turnover was maintained in July."
However, the detailed breakdown reveals a mixed picture across industries, with most sectors either seeing declines or remaining flat. The only industry to post an increase was food retailing, which managed a modest 0.2% rise.
Looking ahead
The economic calendar is rather busy today. Eurozone CPI flash will be the main highlight in European session, while unemployment rate will also be released. Germany will publish import prices, retail sales and unemployment rate. France consumer spending, Swiss KOF economic barometer, and UK M4 money supply will be published too.
Later in the day, Canada will release monthly GDP. US will release personal income and spending, PCE inflation, and Chicago PMI.
EUR/GBP Daily Outlook
Daily Pivots: (S1) 0.8399; (P) 0.8417; (R1) 0.8430; More....
EUR/GBP's fall from 0.8624 is still in progress and intraday bias stays on the downside for retesting 0.8382 low. Strong support could be seen from there to bring rebound on first attempt. Above 0.8449 minor resistance will turn intraday bias neutral first. But risk will stay on the downside as long as 55 D EMA (now at 0.8484) holds. Firm break of 0.8382 will confirm larger down trend resumption.
In the bigger picture, while the rebound from 0.8382 is strong, there is no confirmation of trend reversal yet. As long as 0.8643 resistance holds, down trend from 0.9267 could still resume through 0.8382 at a later stage towards 0.8201 (2022 low). However, firm break of 0.8643 will indicate that such down trend has completed, and turn outlook bullish for 0.8764 resistance next.
Economic Indicators Update
| GMT | Ccy | Events | Actual | Forecast | Previous | Revised |
|---|---|---|---|---|---|---|
| 22:45 | NZD | Building Permits M/M Jul | 26.20% | -13.80% | -17.00% | |
| 23:30 | JPY | Tokyo CPI Y/Y Aug | 2.60% | 2.20% | ||
| 23:30 | JPY | Tokyo CPI core Y/Y Aug | 2.40% | 2.20% | 2.20% | |
| 23:30 | JPY | Tokyo CPI core-core Y/Y Aug | 1.60% | 1.50% | ||
| 23:30 | JPY | Unemployment Rate Jul | 2.70% | 2.50% | 2.50% | |
| 23:50 | JPY | Industrial Production M/M Jul P | 2.80% | 3.30% | -4.20% | |
| 23:50 | JPY | Retail Trade Y/Y Jul | 2.60% | 2.90% | 3.70% | |
| 01:30 | AUD | Retail Sales M/M Jul | 0.00% | 0.20% | 0.50% | |
| 01:30 | AUD | Private Sector Credit M/M Jul | 0.50% | 0.40% | 0.60% | |
| 05:00 | JPY | Housing Starts Y/Y Jul | -1.10% | -6.70% | ||
| 06:00 | EUR | Germany Import Price Index M/M Jul | 0.00% | 0.40% | ||
| 06:00 | EUR | Germany Retail Sales M/M Jul | 0.00% | -1.20% | ||
| 06:45 | EUR | France Consumer Spending M/M Jul | 0.60% | -0.50% | ||
| 06:45 | EUR | France GDP Q/Q Q2 | 0.30% | 0.30% | ||
| 07:00 | CHF | KOF Leading Indicator Aug | 100.6 | 101 | ||
| 07:55 | EUR | Germany Unemployment Change Aug | 61K | 18K | ||
| 07:55 | EUR | Germany Unemployment Rate Aug | 6% | 6% | ||
| 08:30 | GBP | Mortgage Approvals Jul | 61K | 60K | ||
| 08:30 | GBP | M4 Money Supply M/M Jul | 0.50% | 0.50% | ||
| 09:00 | EUR | CPI Y/Y Aug P | 2.20% | 2.60% | ||
| 09:00 | EUR | CPI Core Y/Y Aug P | 2.80% | 2.90% | ||
| 09:00 | EUR | Eurozone Unemployment Rate Jul | 6.50% | 6.50% | ||
| 12:30 | CAD | GDP M/M Jun | 0.10% | 0.20% | ||
| 12:30 | USD | Personal Income M/M Jul | 0.20% | 0.20% | ||
| 12:30 | USD | Personal Spending Jul | 0.50% | 0.30% | ||
| 12:30 | USD | PCE Price Index M/M Jul | 0.20% | 0.10% | ||
| 12:30 | USD | PCE Price Index Y/Y Jul | 2.60% | 2.50% | ||
| 12:30 | USD | Core PCE Price Index M/M Jul | 0.20% | 0.20% | ||
| 12:30 | USD | Core PCE Price Index Y/Y Jul | 2.70% | 2.60% | ||
| 13:45 | USD | Chicago PMI Aug | 44.6 | 45.3 | ||
| 14:00 | USD | Michigan Consumer Sentiment Index Aug F | 67.8 | 67.8 |