Sample Category Title
WTT: What To Trade in September
September is often seen as a cautious or "risk-off" month for traders, influenced by factors like economic uncertainty, updates from China, and concerns about the rate cuts in the US. This generally means that traders might prefer safer investments, although this can vary depending on the asset. Here are two of my favorite trade ideas for the month of September.
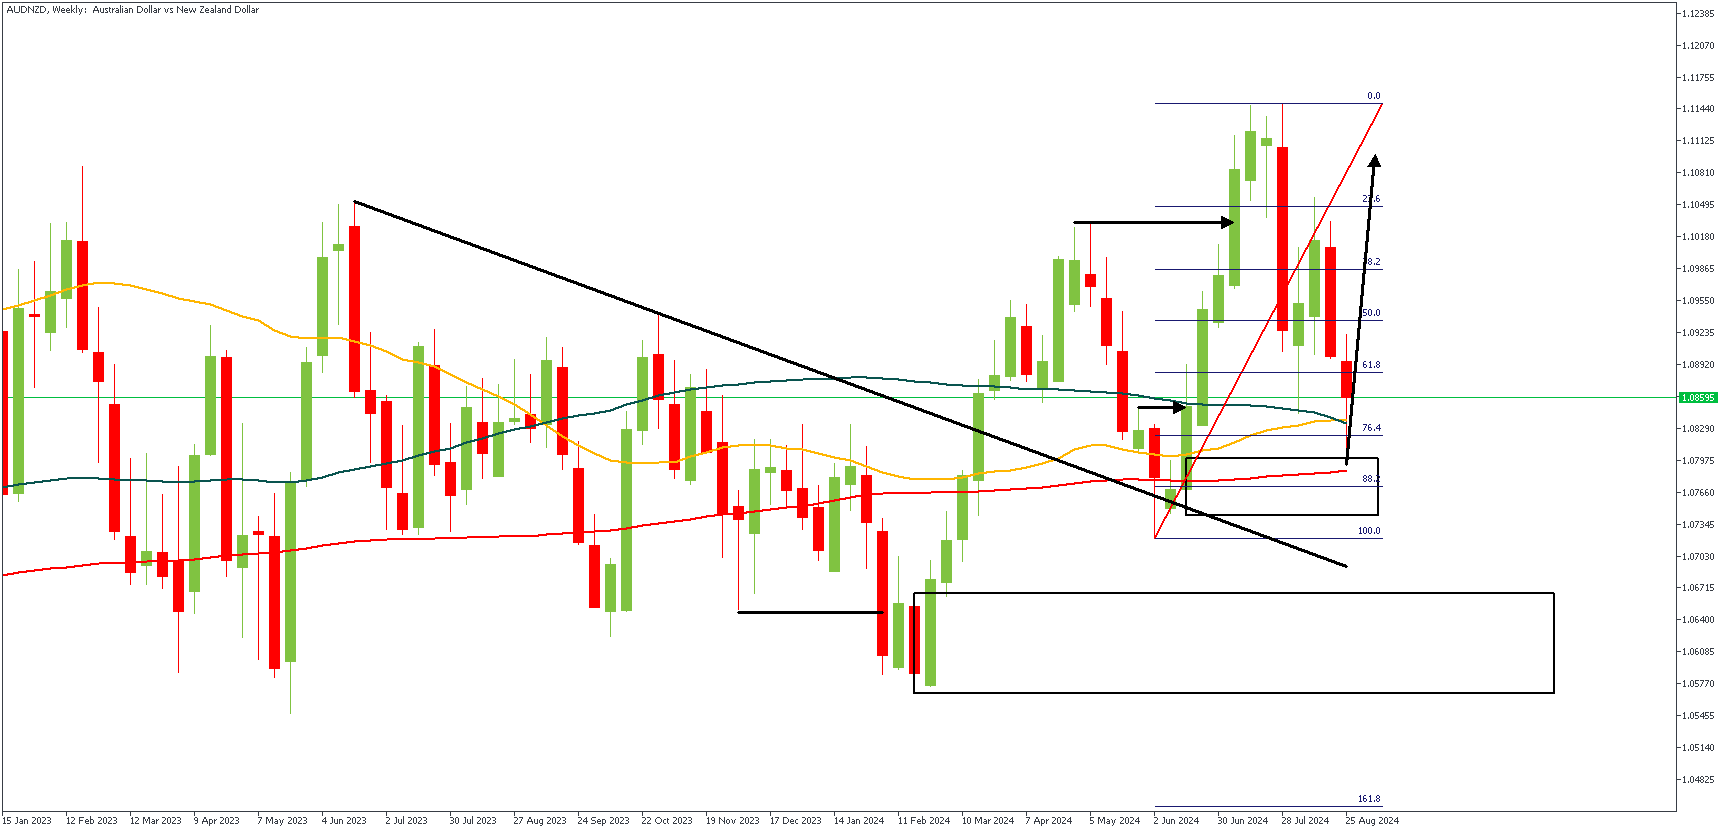
AUDNZD – W1 Timeframe
The weekly timeframe on AUDNZD has recently bounced off a critical area of support, leaving behind a considerably long wick near the 200-period moving average. The 76% Fibonacci retracement level also contributed to the bullish momentum. In line with this, I expect the lower timeframes to provide a proper entry confirmation over the first few days in the month of September.
Analyst’s Expectations:
- Direction: Bullish
- Target: 1.11055
- Invalidation: 1.06969
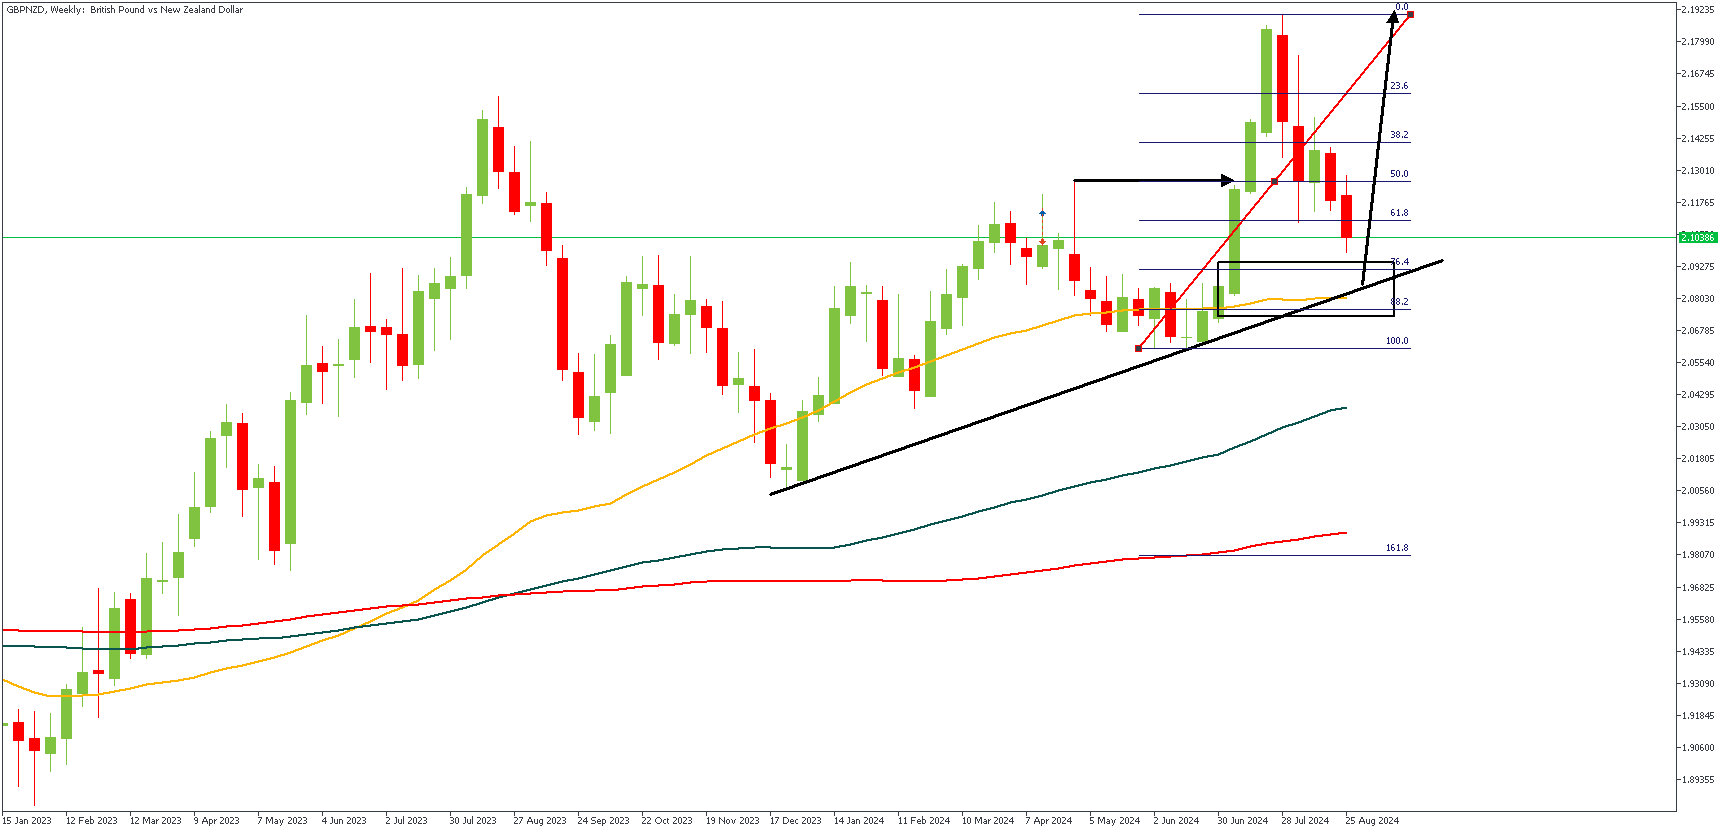
GBPNZD – W1 Timeframe
The weekly timeframe of GBPNZD broke above the previous high, and afterwards slipped downwards for a retest of the demand zone that originated the move. Notably, the demand zone overlays the 76% of the Fibonacci retracement, and aligns perfectly with the trendline support. The general outlook here is for a bullish outcome, since the 50-period moving average accents completely to this, lower timeframe confirmation for entries would be crucial nonetheless.
Analyst’s Expectations:
- Direction: Bullish
- Target: 2.19259
- Invalidation: 2.05199
Cliff Notes: Capacity is Paramount
Key insights from the week that was.
In Australia, the latest Monthly CPI Indicator reported an easing in both headline and underlying (trimmed mean) inflation, from 3.8%yr and 4.1%yr in June to 3.5%yr and 3.8%yr in July respectively, broadly in line with expectations. The onset of cost-of-living relief measures were crucial to the latest step-down, as the impact of Commonwealth energy rebates and various state-based measures start to emerge in Queensland, Western Australia and Tasmania. Household electricity prices fell 6.4% in the month, and with policy support to the rest of the states set to follow in August, further declines in electricity prices will be seen in ahead.
As these measures continue to supress headline inflation over the period ahead, the RBA’s focus, from a decision-making perspective, will remain centred on trimmed mean inflation. In a deep-dive earlier this week, we discussed the similarities between our own and the RBA’s view on the likely path for core inflation and the differences on perspectives around wages growth and its implications.
In the run-up to Q2 GDP next week, we also received two partial indicators of business investment.
Construction activity was broadly flat in Q2, lifting just 0.1% higher, although revisions have added roughly 1.3 percentage points to growth in construction of the year to March 2024. The slowdown in private construction activity is still clearly evident, having initially presented via residential construction to now capture non-residential and infrastructure works too. The public sector is providing somewhat of an offset as critical infrastructure projects move into development, following the boost to the pipeline from recent Federal and State Government budgets, seeing construction activity – albeit not growing – remain at a high level.
The Q2 CAPEX survey subsequently reported a significant downside surprise, declining 2.2% in Q2. The decline was centred on building and structures, down 3.8%, while spending on machinery and equipment fell 0.5%, the non-mining sector being the chief culprit behind the weakness across both segments. On spending intentions, the survey suggests that businesses are still certainly looking to invest in order to build capacity and alleviate constraints, but perhaps not to the same degree of absolute confidence that was seen over the past two years. The third estimate for 2024/25 CAPEX plans was up 8.2% compared to the third estimate a year ago which in our view, implies a 6.4% rise in nominal CAPEX spending over the financial year, or roughly 3.25% on an inflation-adjusted basis (versus 5.25% at the time of the second estimate).
Our Q2 GDP preview will be published later today on WestpacIQ.
Offshore, there were few releases during the week but conditions across the manufacturing sector signal weak activity ahead.
In July, durable goods orders rose 9.9%mth rebounding from a decline of –6.9% in June. However, this was driven by the often-volatile transportation category, with ex-transport orders falling –0.2%. Looking ahead to August, the regional Fed surveys point to further downside risks for activity.
The Dallas Fed Index rose to –9.7 index points, the highest since January 2023. That said, it remains around 13pts below its 10-year pre-prenademic average. In the details, the ‘number of employees’ component fell back into the red at –0.7, almost 9 points below the historic average. The sub-components concerning wages, prices paid and prices received all lifted to remain above their historic averages; the latter two, however, suggest some degree of ongoing margin squeeze in the sector.
The Richmond Fed Index fell to –19 index points marking three months of declines. The ‘number of employees’ component fell for both current and expected conditions. This is consistent with other indicators showing emerging softness in the labour market. Manufacturers' hiring decisions reflect the demure demand outlook.
Looking at the broader economy, Q2 GDP was revised up from 2.8% to 3.0% in annualised terms., driven by stronger consumption (2.9% from 2.3% annualised previously). Despite this, annualised Q2 core PCE inflation was revised down a touch from 2.9% to 2.8% annualised. While notable, the revision is unlikely to sway the FOMC from a cut in September. Forward-looking and more timely data still points to downside risks for the labour market and growth.
USD/JPY Retains Support: Can It Stage a Recovery?
Key Highlights
- USD/JPY found support near 143.50 and corrected some losses.
- It cleared a key bearish trend line with resistance at 144.85 on the 4-hour chart.
- EUR/USD started a downside correction below the 1.1150 level.
- Gold remained stable near $2,500 and might aim for more upsides.
USD/JPY Technical Analysis
The US Dollar remained well-bid near 143.50 against the Japanese Yen. USD/JPY seems to be forming a base for a fresh upward move.
Looking at the 4-hour chart, the pair was able to recover above the 144.00 and 144.20 resistance levels. It cleared a key bearish trend line with resistance at 144.85. The bulls pushed the pair above the 23.6% Fib retracement of the downward move from the 149.32 swing high to the 143.50 low.
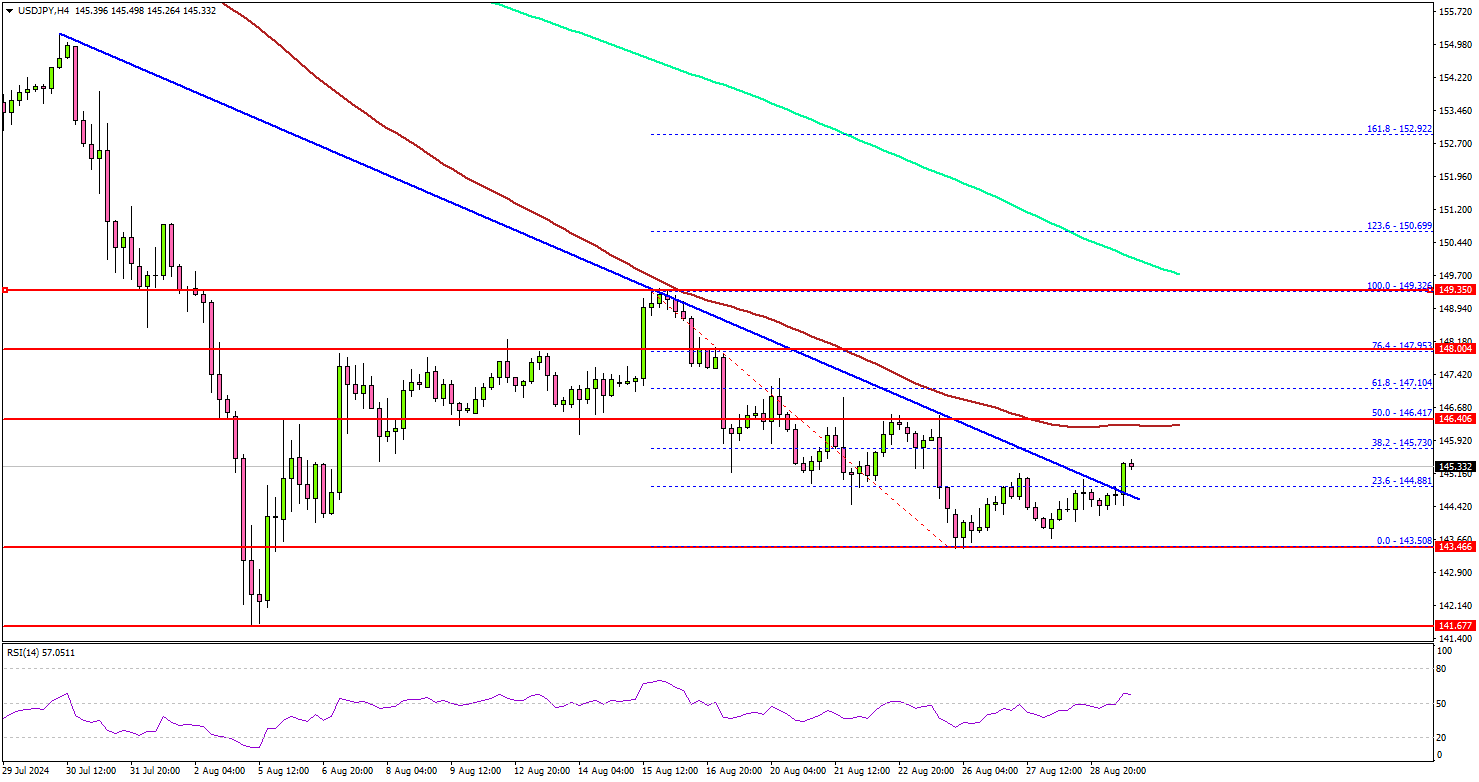
On the upside, the pair could face resistance near the 146.40 level and the 100 simple moving average (red, 4-hour). It is close to the 50% Fib retracement of the downward move from the 149.32 swing high to the 143.50 low.
The next key resistance sits near the 147.80 level. A clear move above the 147.80 level could set the pace for a move toward the 148.50 level. Any more gains might call for a test of the 200 simple moving average (green, 4-hour) at 149.80.
On the downside, immediate support sits near the 144.40 level. The next key support sits near the 143.80 level. The main support is now forming near 143.50. A downside break below the 143.50 level could set the pace for a larger decline.
The next major support is near the 141.65 level. Any more losses might send the pair toward the 140.00 support level.
Looking at EUR/USD, the pair failed to climb above 1.1200 and recently started a downside correction below the 1.1150 level.
Economic Releases
- US Personal Income for July 2024 (MoM) - Forecast +0.2%, versus +0.2% previous.
- US Core Personal Consumption Expenditure for July 2024 (MoM) - Forecast +0.2%, versus +0.2% previous.
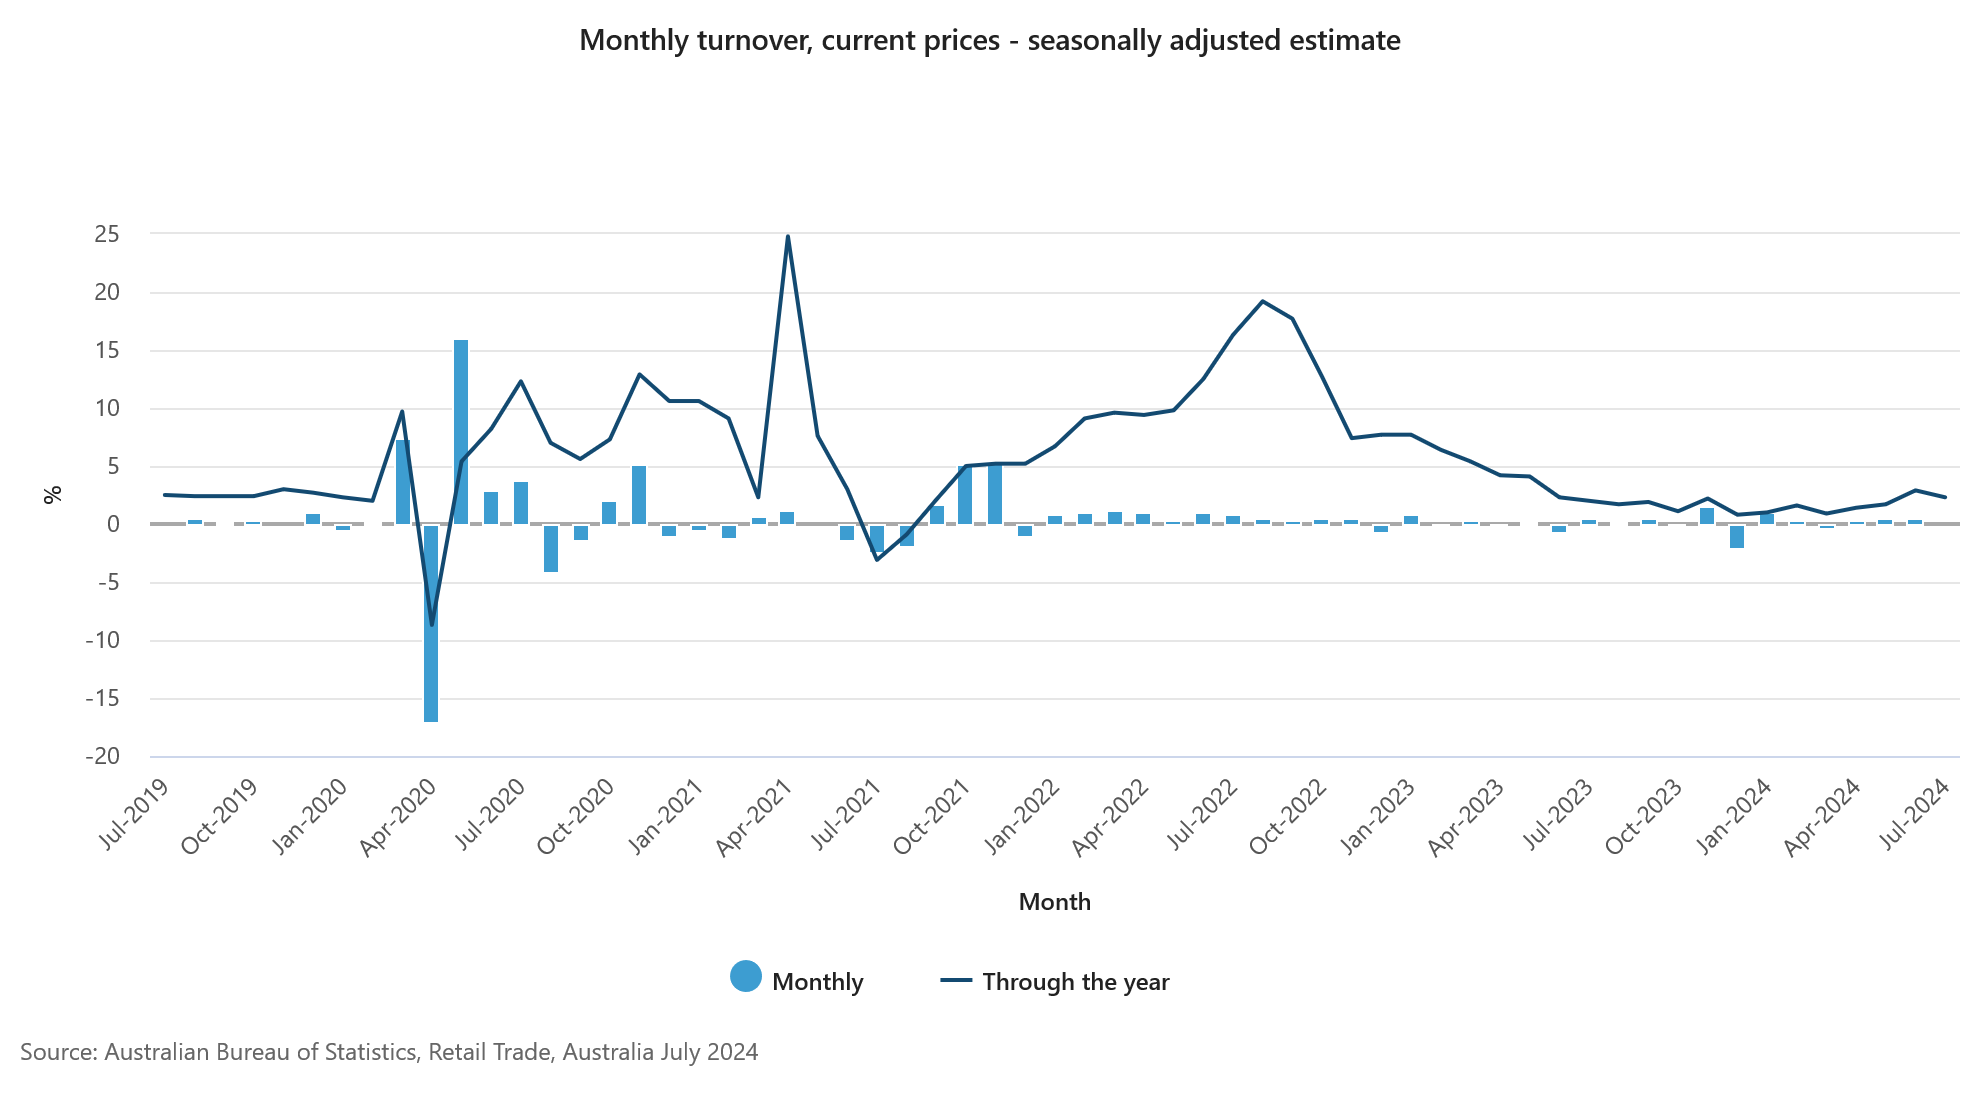
Australia’s retail sales stagnate in Jul as spending momentum stalls
Australia's retail sales turnover for July showed no growth on a monthly basis, falling short of the expected 0.2% mom increase. This flat result comes after consecutive 0.5% mom increases in both June and May, driven by mid-year sales events.
According to Ben Dorber, head of retail statistics at the Australian Bureau of Statistics, "After rises in the past two months boosted by mid-year sales activity, the higher level of retail turnover was maintained in July."
However, the detailed breakdown reveals a mixed picture across industries, with most sectors either seeing declines or remaining flat. The only industry to post an increase was food retailing, which managed a modest 0.2% rise.
Japan’s Tokyo inflation accelerates in Aug as production and retail sales miss estimates in Jul
Japan’s Tokyo CPI data for August shows further acceleration in inflation, with core inflation (excluding food) rising to 2.4% yoy, above the expected 2.2%. CPI core has been climbing steadily every month since hitting a bottom of 1.6% yoy in March.
Core-core CPI, which excludes both food and energy, also ticked up to 1.6% from 1.5%, while headline CPI surged to 2.6% from 2.2%.
These figures are often seen as a leading indicator for nationwide trends. Some economists noted that rise in prices growth was primarily driven by the phase-out of government subsidies on utility bills and a spike in rice prices. Underlying inflation trends may moderate in the coming months as these one-time factors dissipate.
Also released today, Japan’s industrial production rose by 2.8% mom in July, slightly below the expected 3.3%. Looking ahead, manufacturers surveyed by the Ministry of Economy, Trade, and Industry anticipate 2.2% increase in output for August, followed by -3.3% contraction in September.
Retail sales growth also slowed to 2.6% yoy in July, down from 3.7% in June, and below the expected 2.9%.
Additionally, the unemployment rate rose to 2.7% from 2.5%, surpassing expectations of it remaining steady at 2.5%. The jobs-to-applicants ratio, however, edged slightly higher to 1.24.
ECB’s Nagel warns against cutting rates too quickly
Bundesbank President Joachim Nagel delivered a strong message overnight, cautioning that a timely return to price stability cannot be taken for granted." He emphasized that ECB must tread carefully and "must not lower policy rates too quickly,"
"We are not there yet. While our 2% target is in sight, we have not reached it," he added.
Nagel highlighted concerns that inflation, although nearing 2% target in late summer, is likely to rebound and remain above target well into 2025 due to persistent increases in service costs.
Addressing the differing views within ECB's Governing Council, Nagel acknowledged the "intense" debates that typically accompany "turning points in the interest-rate cycle".
However, he sought to dispel any notion of broader disagreement, stating, "When making their decisions, monetary policymakers are always faced with some degree of uncertainty. That is why a certain diversity of opinion among them as well as scope for their own judgment are considered features, not bugs."
SNB’s Jordan: Strong Franc and weak European demand squeeze Swiss industry
SNB Chairman Thomas Jordan, who is set to step down at the end of September, highlighted the challenges facing Swiss industry due to the recent strength of the Swiss Franc and weak demand in Europe. Speaking at an event overnight, Jordan emphasized the difficulties these factors pose for Swiss industrial goods, particularly given that Germany and Europe are the primary markets for the country's industry.
"Germany and Europe are the main markets for industry. If the growth is weak there, this automatically affects demand for our industrial goods," Jordan stated. He also acknowledged that the strong exchange rate adds further pressure, noting, "The exchange rate ... does not make the situation easier. It makes it difficult for the industry."
Jordan reaffirmed SNB's commitment to maintaining price stability, defined as an inflation rate of 0-2%, which he described as a "crucial precondition for prosperity." He reiterated that interest rates remain SNB's main tool for achieving this stability, though interventions in currency markets are also on the table if needed.
Looking ahead, markets are currently pricing in a 70% chance of a 25bps rate cut by SNB at their next meeting on September 26, with a 30% probability of a more aggressive 50bps cut.
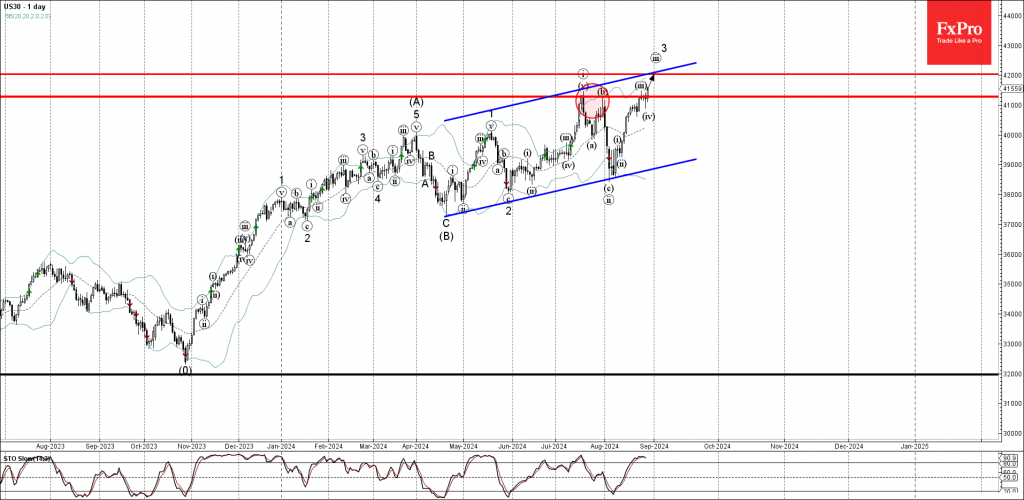
Dow Jones index Wave Analysis
- Dow Jones index broke resistance level 41280.00
- Likely to rise to resistance level 42000.00
Dow Jones index continues to rise after the earlier breakup of the pivotal resistance level 41280.00 (which stopped the previous waves I, b and iii, as can be seen below).
The breakout of the resistance level 41280.00 continues the active impulse wave iii of the higher impulse waves 3 and (C).
Given the predominant daily uptrend, Dow Jones index can then be expected to rise to the next resistance level 42000.00 (intersecting with the daily up channel from April).
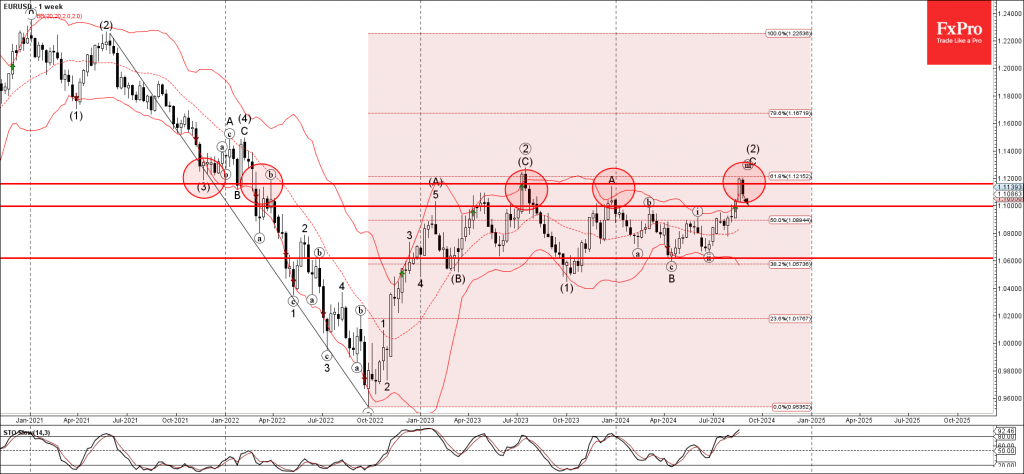
EURUSD Wave Analysis
- EURUSD reversed from long-term resistance level 1.1150
- Likely to fall to support level 1.1000
EURUSD currency pair recently reversed down from the major long-term resistance level 1.1150 (which has been reversing the price from the start of 2022).
The resistance level 1.1150 was strengthened by the upper weekly Bollinger Band and by the 61.8% Fibonacci correction of the downward impulse from the middle of 2021.
Given the strongly bearish euro sentiment and the overbought weekly Stochastic, EURUSD currency pair can then be expected to fall to the next support level 1.1000.