Sample Category Title
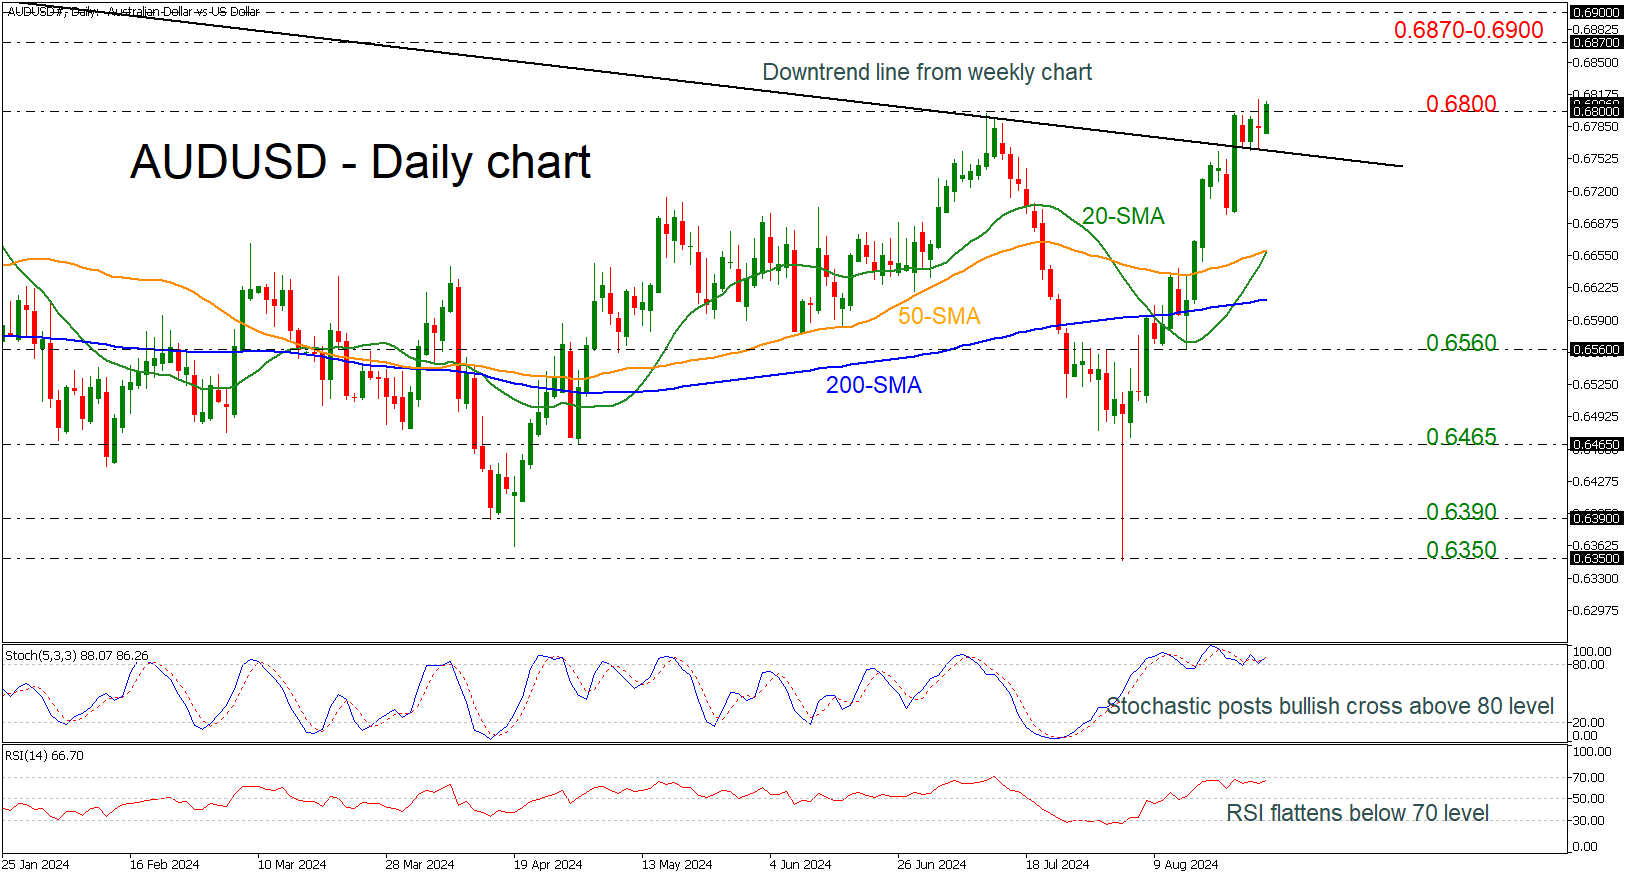
AUDUSD Unlocks New 8-Month High Above 0.6800
- AUDUSD increases 7% in August
- 20- and 50-day SMAs post bullish cross
- Stochastic in overbought region
- RSI still beneath 70 area
AUDUSD hit a new eight-month high above the 0.6800 round number, breaking the long-term descending trend line to the upside. Following the bearish spike on August 5, the pair gained over 7%.
Technically, the 20- and 50-day simple moving averages (SMAs) are ready for a bullish crossover. The stochastic oscillator is pointing north above the 80 level, whereas the RSI is moving horizontally near the 70 area.
More advances may drive the market towards the next resistance of 0.6870, which is taken from the high on December 28. If the bulls continue to buy the pair, then the market may challenge the 0.6900 round number, achieved in July 2023.
In the negative scenario, a drop beneath the diagonal line could indicate a retreat until the 20- and 50-day SMAs at 0.6660. Even lower, the 200-day SMA at 0.6610 could be a real struggle for traders.
Summarizing, AUDUSD has shown a significant improvement, but only a successful rally above 0.6800 could confirm a bullish retracement.
Dollar for Now Fails to Build on Yesterday’s Rebound
Markets
More technical, order driving trading for global markets yesterday. An almost empty eco calendar left investors counting down to upcoming data (EMU CPIs today and tomorrow, US PCE deflators on Friday, key early month data next week) and prevented clear directional moves. A $70 bln US Treasury auction was OK, but hardly left any traces on the charts. At the end of the day, US yields rose 1-2 bps across the curve (3.4 bps decline in 2-y yield was due to a benchmark change). German bunds outperformed with yields easing 1.9 bps (2-y) and 3.4 bps (30-y). (US) equities traded cautious ahead of Nvidia results after the close (Nasdaq -1.12%). Results mostly met analyst expectations, but investors apparently had hoped for a stronger forecast/guidance, triggering further (tech-driven) equity losses after the close. After a Fed-driven setback of late, the dollar tried to avoid further deterioration of the technical picture. DXY rebounded off the 100.52/62 area (YTD low/end 2023 low) to close at 101.09. EUR/USD for now also aborted the test of the 1.12 area (close 1.112). Sterling corrected against the overall USD comeback (cable 1.3191) but continued it outperformance against the euro as the BOE is expected to take longer to further join the ECB and Fed easing cycle (next step only seen at the November meeting, unchanged in September).
This morning, Asian equity markets mostly traded with in red, but the damage for the Nvidia setback yesterday on WS remains modest after all. US yields are little changed. Fed’s Bostic in a speech overnight admitted that there is a case for bringing forward the timing of rate cuts, but still wants more evidence as he wants to prevent a scenario where the Fed cut rates and then has to raise them again. The dollar for now fails to build on yesterday’s rebound (EUR/USD 1.1135, DXY 100.95). The yen slightly underperforms (USD/JPY 144.75). Today’s eco calendar is better filled with national August inflation data in Belgium, Spain and Germany. The EC also will release European confidence data. In the US, the second reading of the US Q2 GDP growth, pending home sales and jobless claims will be published. German and Spanish HICP inflation is expected to cool further to respectively 0.0% m/m and 2.0% y/y and 0.2% m/m and 2.5% y/y. ECB’s Lane is scheduled to speak. Easing of headline inflation will cement expectations for a next 25 bps ECB cut in September, but markets will keep a close eye at the underlying dynamics (core, services) to make up their mind on the timing for follow-up action. With the Fed focus now turning ever more to the labour market, jobless claims still might cause some intraday price jitters. In the run-up to next week key US data, we expect core yields to hold near recent bottom levels. We don’t anticipate a protracted USD comeback yet.
News & Views
ANZ New Zealand’s Business Outlook soared from 27.1 to 50.6 in August, the highest level in a decade. Especially the forward looking activity outlook improved, rising from 16.3 to 37.1. Experienced own activity rose only very marginally and remains at low levels, from -24.3 to -23.1. It implies that the hurdle for expecting better times ahead is very low. ANZ reported that 41% of firms intended to raise their prices in the next three months. The amount by which they intend to raise them rose from 1.4% to 1.6%. Inflation expectations on the other hand dived below 3% for the first time since July 2021 (2.9% from 3.2%). The survey specifically mentions that the large increases in confidence were already visible in the responses gathered ahead of the RBNZ’s first policy rate cut, though anticipation played as role as well of course. NZD swap rates rose 4 to 5 bps following the release. Kiwi dollar strength takes over from dollar weakness in this month’s NZD/USD surge with the pair approaching 0.63 (from <0.59 early August) for the first time since early January.
New EU car registrations were nearly flat in Y/Y-terms in July (+0.2%). Seven months into 2024, new car registrations increased by 3.9%, reaching more than 6.5mn units. This is the result of a low comparison base. Battery-electric (BEV) cars accounted for 12.1% of the EU car market, down from 13.5% the previous year. Hybrid-electric vehicles increased their market share, growing from 25.5% to 32%. The combined share of petrol and diesel cars fell to 46%, down from 50%. Registrations of BEV cars declined by 10.8% to 102.7k units with gains in Belgium (+44.2%!; 30% share), the Netherlands and France unable to offset a steep drop in Germany (-36.8%).
Graphs
GE 10y yield
The ECB cut policy rates by 25 bps in June. Stubborn inflation (core, services) make follow-up moves less evident. Markets nevertheless price in two to three more cuts for 2024 as disappointing US and unconvincing EMU activity data rolled in, dragging the long end of the curve down. The move accelerated during the early August market meltdown.
US 10y yield
The Fed in its July meeting paved the way for a first cut in September. It turned attentive to risks to the both sides of its dual mandate as the economy is moving to a better in to balance. Markets tend to err in favour of a 50 bps lift-off. The pivot weakened the technical picture in US yields with another batch of weak eco data pushing the 10-yr sub 4%. Powell at Jackson Hole didn’t challenge markets’ positioning.
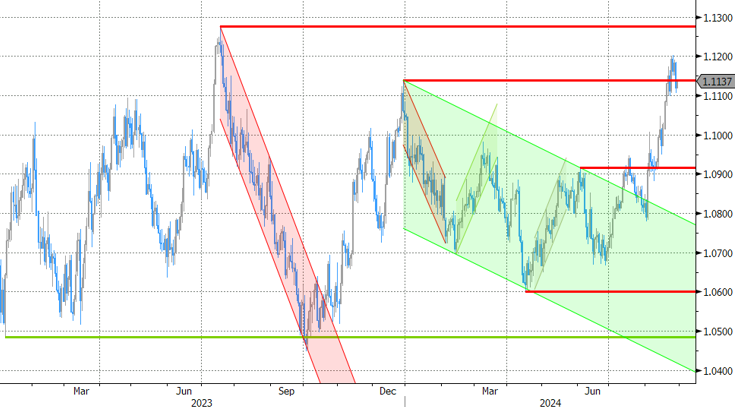
EUR/USD
EUR/USD moved above the 1.09 resistance area as the dollar lost interest rate support at stealth pace. US recession risks and bets on fast and large (50 bps) rate cuts trumped traditional safe haven flows into USD. EUR/USD 1 1.1276 (2023 top) serves as next technical reference.
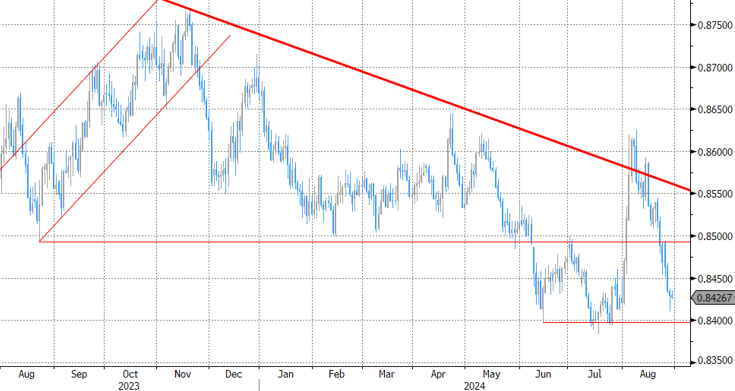
EUR/GBP
The BoE delivered a hawkish cut in August. Policy restrictiveness will be further unwound gradually on a pace determined by a broad range of data. The strategy similar to the ECB’s balances out EUR/GBP in a monetary perspective. Recent better UK activity data and a cautious assessment of BoE’s Bailey at Jackson Hole are pushing EUR/GBP lower in the 0.84/0.086 range.
Today and Tomorrow, Attention Shifts to Economic Data
Nvidia generated a record $30bn in sales in Q2 – up by 122%, the profits surged 166% to $16.6bn, the company said that they expect to sell $32.5bn in the current quarter (more than $31.9bn expected by analysts) and announced a $50bn share buyback program. It could hardly do better.
The actual results and the forecast beat the average market expectations by a great margin and there was nothing the company could do more to keep the enthusiasm going… but hey, they fell short of the highest estimates on Wall Street. And when I say ‘highest estimates’ I am talking about third quarter revenue forecast from some analysts of nearly $38bn, for example, which is off chart but which is also the reason why Nvidia’s stock price could challenge odds and rumours that it was maybe overvalued.
So guess what, investors were not impressed by the comfortable revenue beat that Nvidia announced last night – a 7th consecutive quarter beat and the 5th consecutive quarter beat of $2bn – and sent the stock price nearly 7% lower in the afterhours trading. The shiny results were clouded by the delay of the next-generation Blackwell chip and the rising worries that competition will soon arrive to tap into Nvidia’s monstrous market share – that stands near 80% for the advanced chips. Combined with the news that Nvidia is under the DoJ investigation regarding whether it has abused its dominant market position doesn’t make the Nasdaq futures look good this morning. They are down by around 0.62% at the time of talking.
Super Micro Computer dived another 20% yesterday after announcing that they will delay filing its annual financial disclosures – a day after Hindenburg threw mud on the company saying that they had ‘glaring accounting red flags, evidence of undisclosed related party transactions, sanctions and export control failures and customer issues’. The delaying of the report naturally raises the odds that they might be right.
All in all, mood in the Big Tech is not great this morning. But the British and European futures seem little affected by Nvidia news. The futures point at a positive start this morning, and the waning appetite in Big Tech could cause more rotation toward the non-tech sectors as the Fed is on course to start cutting its interest rates in a couple of weeks. As such, the S&P500’s equal weight index could continue to close its gap with the technology-heavy, normal-weight index, but the upside potential could only be lower provided that the remaining S&P493 could barely make investors dream more than the Federal Reserve (Fed) rate cuts’ benefits on their valuations.
FX and commodities
The US dollar index rebounded yesterday from ytd low levels, although the US 2-year yield – that best captures the Fed rate expectations – continued its descent below the 3.90% level.
Today and tomorrow, attention shifts to economic data. The US will reveal its latest GDP update today and the core PCE index tomorrow, and over in Europe, the Eurozone countries will start revealing their flash CPI figures for August and the aggregate number will fall tomorrow morning. The US economy is expected to have grown 2.8% in Q2, double the number printed in Q1, but the price pressures are expected to have eased. And despite the strong looking Q2 GDP figure, the growth in the Q3 has likely slowed to 2%, according to Atlanta Fed’s GDP Now forecast. Therefore, even a figure in line with expectations may not discourage the Fed doves, if the price pressures continue to show further progress. In Europe, tomorrow’s figures are expected to confirm a further slowdown in inflation – combined with the sluggish economic data from the old continent – could reinforce the expectations that the European Central Bank (ECB) could cut more than the 50bp cut baked in the market prices. The Fed on the other hand is expected to cut 100bp which looks overdone. The EURUSD is off the recent highs and has room for a further downside correction.
Across the Channel, Cable remains bid below the 1.32 mark on expectation that the Bank of England (BoE) is set for a less aggressive – but a more realistic - rate cut path than its American peer, but the warnings from Mr. Starmer earlier this week that October’s budget ‘will be painful’ could weigh on Britain’s growth outlook and limit sterling’s upside potential.
CPI from Spain and Germany to Give Direction for Tomorrow’s EA Print
In focus today
The focus in the Nordics for today will be the Q2 GDP report from Sweden due at 08.00 CET. The unofficial GDP indicator showed a 0.8% q/q drop in GDP, however, that seems a tad excessive to us and we would not be surprised if today's release indicates slightly less negative growth. We will also get retail sales and the August consumer confidence survey today.
Today, we also get August flash inflation prints for Spain and Germany, which will make us much wiser in terms of what to expect from the euro area figure tomorrow.
Overnight, we get a pile of Japanese data with July retail sales and August Tokyo inflation as the most interesting. We got the first uplifting data on private spending in a very long time with the Q2 national accounts. Whether wage growth has translated into spending growth is key for the reflation outlook in Japan.
Economic and market news
What happened overnight
The long-awaited Nvidia earnings beat expectations but not by as much as previously, and markets have been jittery overnight with Asian equities dragged down by tech stocks as investors cool expectations of AI demand.
What happened yesterday
In geopolitics, the Kremlin said it would continue its operations in Ukraine after President Zelenskiy said he was preparing to present a peace plan to the US government yesterday.
In Libya, more oil fields were reported to have halted production after the announcement two days ago by the East Libyan government that it would do so. Yet oil prices trended lower during the day as markets weighed the prospects of lower economic activity and, thus, demand.
Equities: Global equities were lower yesterday, primarily dragged down by the US and large-cap tech sectors ahead of Nvidia's results, which were posted after the cash close. With no significant catalyst and tech stocks having already had more than 25% p/e expansion this year based on 2024 earnings projections, some profit-taking should be expected. It is also important to recall that tech experienced the largest multiple expansion last year, which leaves very little room for companies in this sector to disappoint without experiencing a sharply negative share price reaction. In the US yesterday, Dow -0.4%, S&P 500 -0.6%, Nasdaq -1.1%, and Russell 2000 -0.7%. Asian markets are broadly lower this morning, with focus on US futures, particularly the tech-heavy futures in the US, which are lower as Nvidia's results failed to impress investors. European futures are mixed this morning.
FI: Yields were 2-3bp lower across jurisdictions with the outperformance in the long end of the curve, however the day was split into two segments. Yields were on a steady decline until late lunchtime from where rates sold off slightly when 5y Austria and 10y EIB syndication were priced, as well as the decision from Austria not to tap the ultra-long dated 2086-bond. After that it was more sideways trading. German Bund-asset swaps were trading close to the 28.5bp mark yesterday.
FX: Yesterday was yet another quiet day in FX markets where the most notable moves were the modest strengthening of the USD and the CEEs alongside the EUR trading heavy. Both SEK and NOK did better than the EUR but posted marginal declines vs the greenback.
EUR/USD Daily Outlook
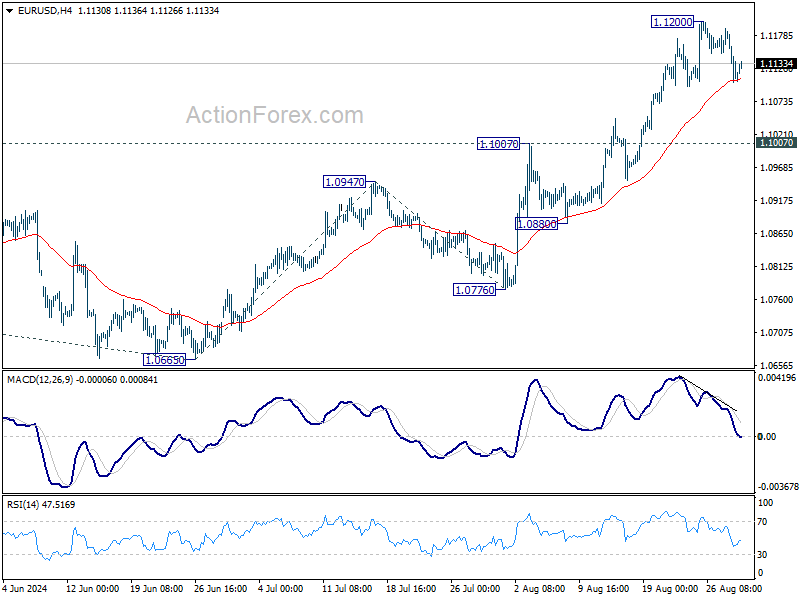
Daily Pivots: (S1) 1.1087; (P) 1.1138; (R1) 1.1170; More....
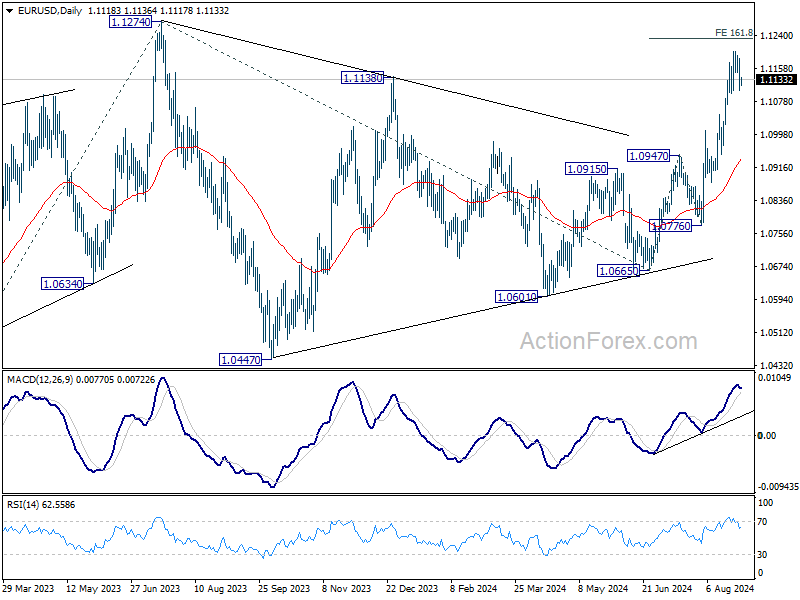
Intraday bias in EUR/USD remains neutral for consolidations below 1.1200. Downside of retreat should be contained above 1.1007 resistance turned support. On the upside, break of 1.1200 will resume recent rally to 161.8% projection of 1.0665 to 1.0947 from 1.0776 at 1.1232, and then 1.1274 high.
In the bigger picture, break of 1.1138 resistance indicates that corrective pattern from 1.1274 has completed at 1.0665 already. Decisive break of 1.1274 (2023 high) will confirm whole up trend from 0.9534 (2022 low). Next target will be 61.8% projection of 0.9534 to 1.1274 from 1.0665 at 1.1740. This will now be the favored case as long as 1.0947 resistance turned support holds.
GBP/USD Daily Outlook
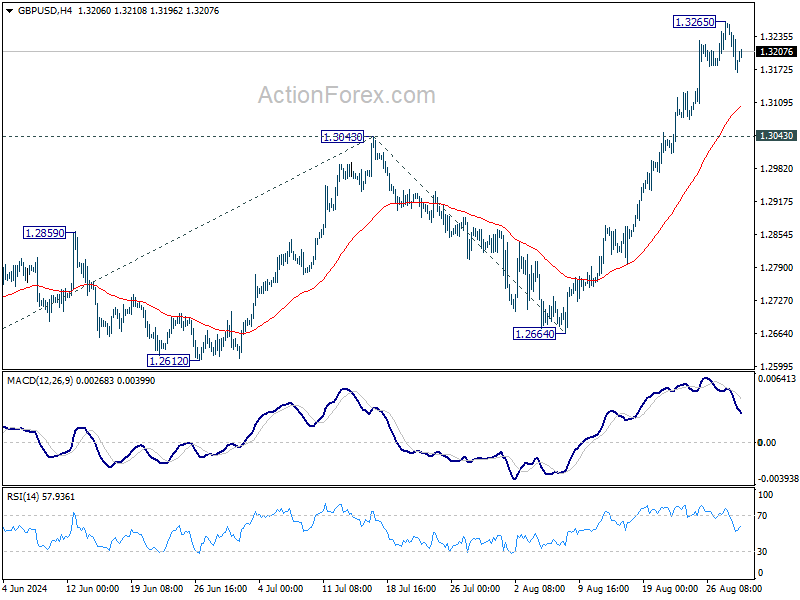
Daily Pivots: (S1) 1.3151; (P) 1.3208; (R1) 1.3249; More...
Intraday bias in GBP/USD remains neutral as consolidations continues below 1.3265. Downside of retreat should be contained well above 1.3043 resistance turned support to bring rebound. On the upside, above 1.3265 will resume larger up trend to 100% projection of 1.2298 to 1.3043 from 1.2664 at 1.3409.
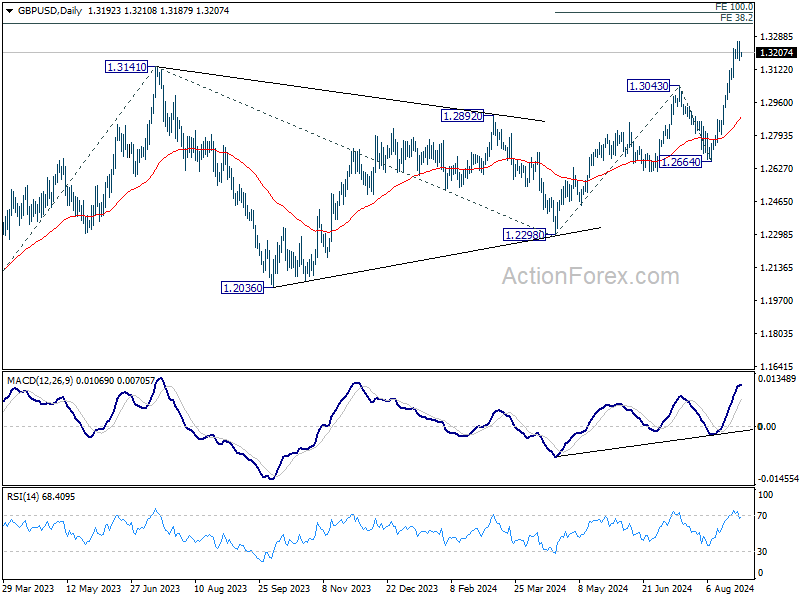
In the bigger picture, up trend from 1.0351 (2022 low) is resuming. Next target is 38.2% projection of 1.0351 to 1.3141 from 1.2298 at 1.3364. For now, outlook will stay bullish as long as 1.2664 support holds, even in case of deep pullback.
USD/CHF Daily Outlook
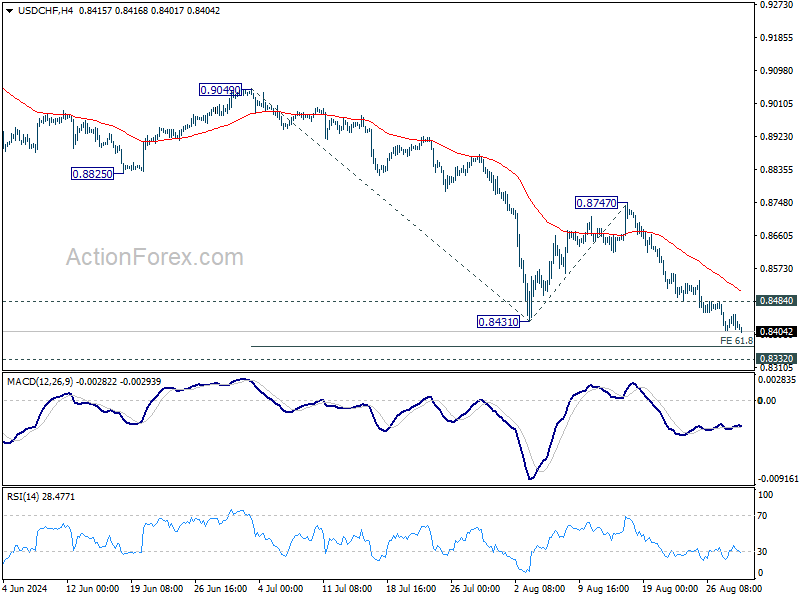
Daily Pivots: (S1) 0.8401; (P) 0.8431; (R1) 0.8452; More…..
USD/CHF's fall from 0.9223 is in progress. Intraday bias stays on the downside for 61.8% projection of 0.9049 to 0.8431 from 0.8747 at 0.8365, and then 0.8332 low. On the upside, above 0.8484 minor resistance will turn intraday bias neutral. But outlook will remain bearish as long as 0.8747 resistance holds, in case of recovery.
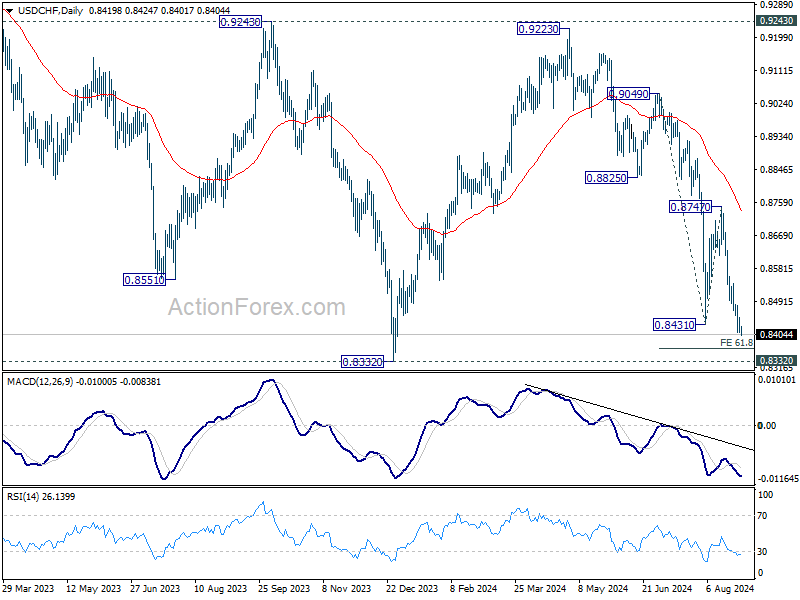
In the bigger picture, price actions from 0.8332 (2023 low) are currently seen as a medium term corrective pattern, with fall from 0.9223 as the second leg. Strong support could be seen from 0.8332 to bring rebound. Yet, overall outlook will continue to stay bearish as long as 0.9243 resistance holds. Firm break of 0.8332, however, will resume larger down trend from 1.0146 (2022 high).
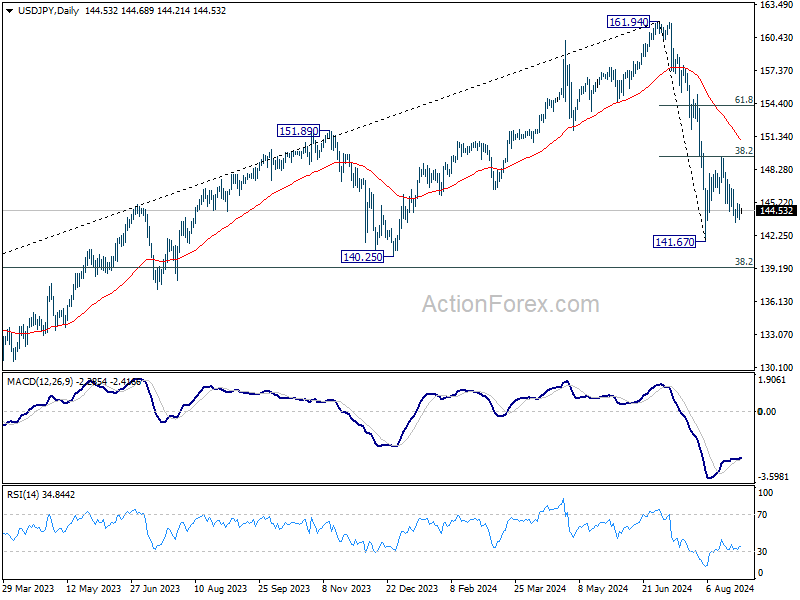
USD/JPY Daily Outlook
Daily Pivots: (S1) 143.84; (P) 144.44; (R1) 145.19; More...
No change in USD/JPY's outlook. Further decline is still in favor in USD/JPY with 146.47 resistance intact, to retest 141.67 low. Firm break there will resume the whole fall from 161.94 to 140.25 support next. On the upside, above 146.47 minor resistance will turn intraday bias back to the upside for 149.35 resistance instead.
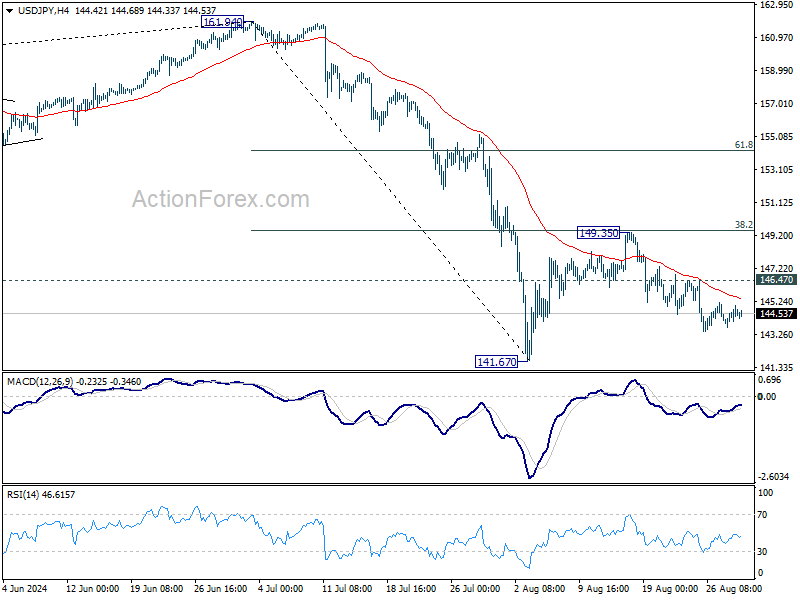
In the bigger picture, fall from 161.94 medium term top is seen as correcting whole up trend from 102.58 (2021 low). Deeper decline could be seen to 38.2% retracement of 102.58 to 161.94 at 139.26, which is close to 140.25 support. In any case, risk will stay on the downside as long as 55 W EMA (now at 149.38) holds. Nevertheless, firm break of 55 W EMA will suggest that the range for medium term corrective pattern is already set.
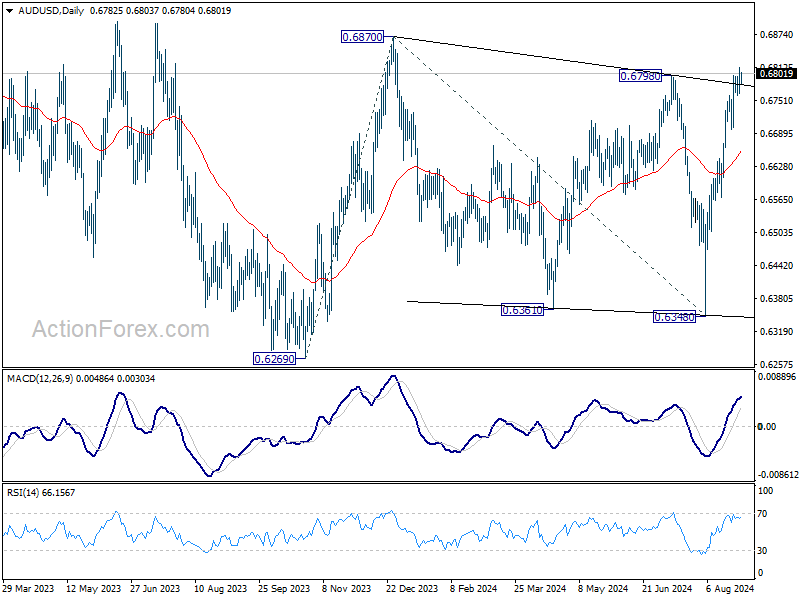
AUD/USD Daily Report
Daily Pivots: (S1) 0.6762; (P) 0.6788; (R1) 0.6810; More...
Intraday bias in AUD/USD stays on the upside at this point, despite some loss of momentum. Current rally should target 0.6870 resistance. Firm break there will target 100% projection of 0.6269 to 0.6870 from 0.6348 at 0.6949. Near term outlook will stay bullish as long as 0.6696 support holds, in case of retreat.
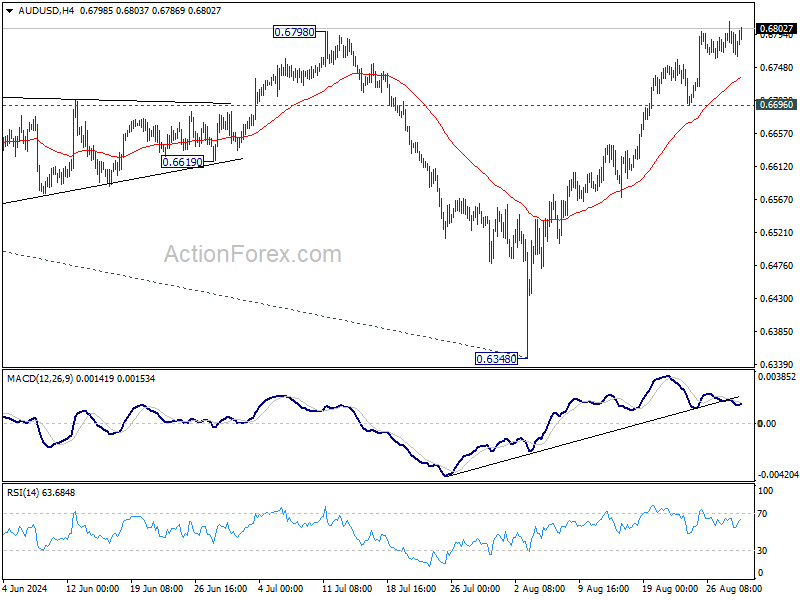
In the bigger picture, overall, price actions from 0.6169 (2022 low) are seen as a medium term corrective pattern, with rise from 0.6269 as the third leg. Firm break of 0.6798/6870 resistance zone will target 0.7156 resistance. In case of another fall, strong support should be seen from 0.6169/6361 to bring rebound.
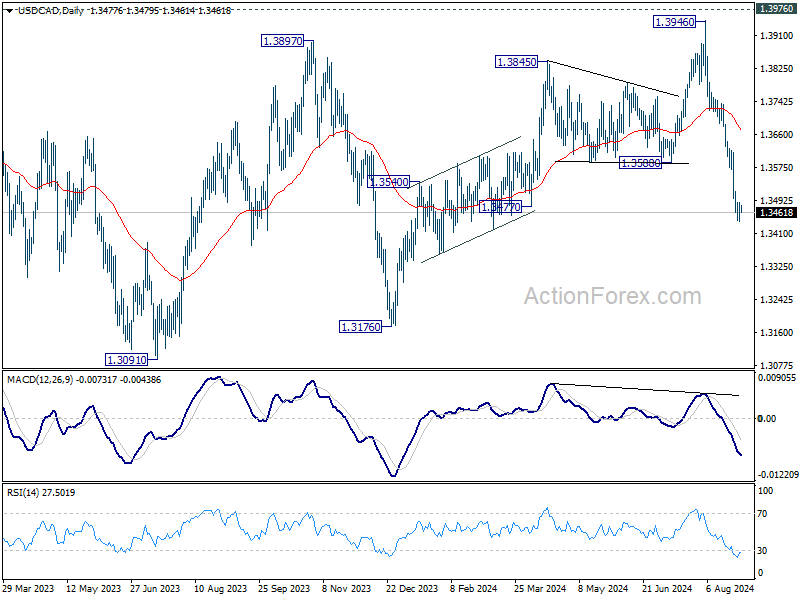
USD/CAD Daily Outlook
Daily Pivots: (S1) 1.3452; (P) 1.3470; (R1) 1.3499; More...
A temporary low is in place at 1.3439 with current recovery and intraday bias in USD/CAD is turned neutral first. Upside of recovery should be limited below 1.3617 resistance to bring another fall. On the downside, below 1.3439 will resume the decline from 1.3946 and target 1.3176 support next.
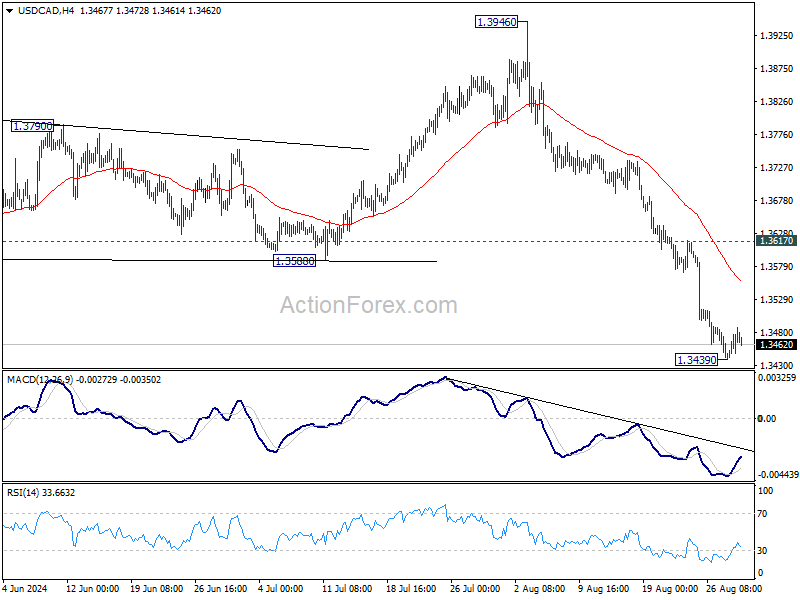
In the bigger picture, current development suggests that corrective pattern from 1.3976 (2022 high) is extending with another falling leg. While deeper decline could be seen, strong support should emerge above 1.2947 resistance turned support to bring rebound. Rise from 1.2005 (2021 low) is still in favor to resume at a later stage.