Sample Category Title
Fed’s Bostic signals readiness for rate cuts, but urges caution before September decision
Atlanta Fed President Raphael Bostic signaled that it "may be time to move" towards lowering interest rates, though he remains cautious about committing to a cut in September.
Speaking at an event overnight, Bostic emphasized the need for more data before making a definitive decision.
"I don't want us to be in a situation where we cut and then we have to raise rates again," he noted. "So, if I'm going to err on one side, it's going to be waiting longer just to make sure that we don't have that up and down."
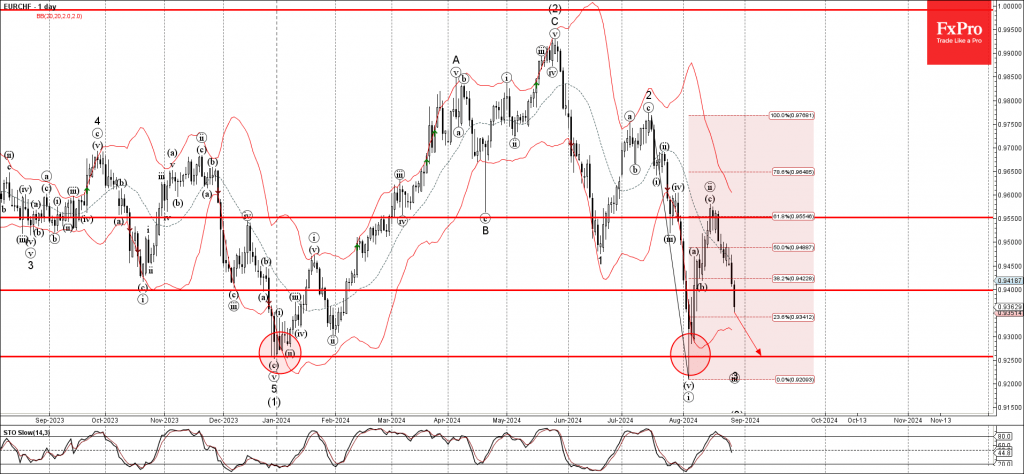
EURCHF Wave Analysis
- EURCHF broke support level 0.9400
- Likely to fall to support level 0.9250
EURCHF currency pair is falling inside the minor impulse wave iii which started earlier from the pivotal resistance level 0.9550 (former support from April).
The pair today broke the support level 0.9400 – which should add further pressure on this currency pair.
Given the clear daily downtrend and strongly bearish euro sentiment, EURCHF currency pair can then be expected to fall to the next support level 0.9250 (which stopped two sharp downward impulse waves in January and August).
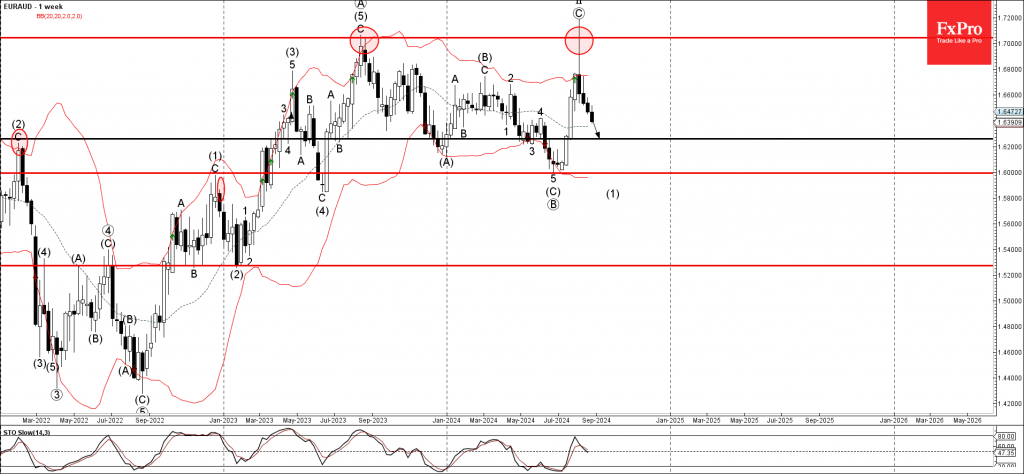
EURAUD Wave Analysis
- EURAUD falling inside impulse wave (1)
- Likely to reach support level 1.6260
EURAUD currency pair continues to fall inside the weekly downward impulse wave (1) which started earlier from the key resistance level 1.7000 (former yearly high from the middle of 2023).
The downward reversal from resistance level 1.7000 created the weekly Japanese candlestick reversal pattern, Shooting Star.
EURAUD currency pair can then be expected to fall to the next support level 1.6260 – the breakout of which can lead to further losses toward 1.60000.
Sunset Market Commentary
Markets
Markets spent most of their time awaiting corporate (Nvidia results after-market) and economic (European inflation numbers from tomorrow on and US PCE deflators on Friday) events today. Core bond yields drifted a few basis points lower in technically irrelevant trading during European trading hours, both in the US and Europe. They then fully recovered in the former. The 2-yr yield is nonetheless shedding 3.4 bps following a benchmark change after yesterday’s auction. The smooth sale bodes well for tonight’s $70bn 5-yr one. German yields were still down between 1.8 (2-yr) and 4.5 bps (30-yr) at the time of writing, slightly underperforming vs swaps. The ECB’s July lending survey showed that the drag of high interest rates on lending has eased somewhat further, implying no short-term need for swift monetary easing. The annual M3 growth rate stood at 2.3%, the same as in June. Among the borrowing sectors, loans to households picked up slightly from 0.3% to 0.5%. This uptick was partially offset by loan growth to companies easing from 0.7% to 0.6%.
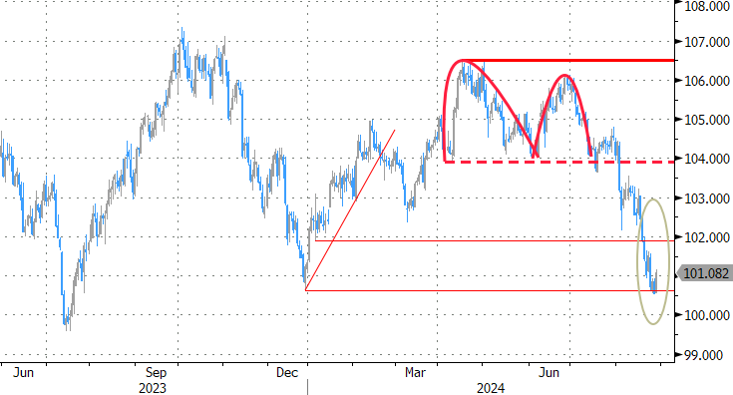
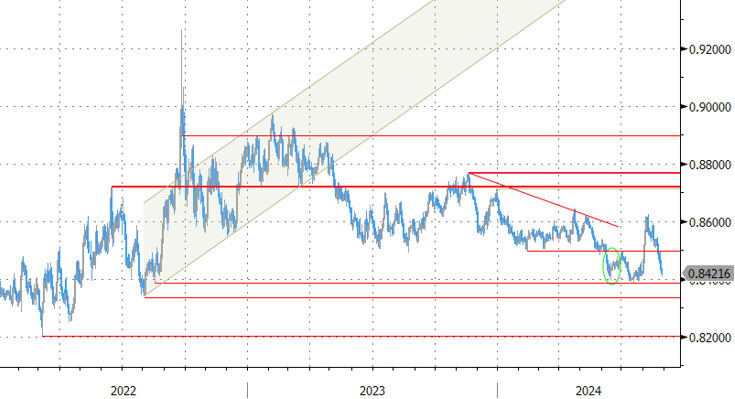
The dollar captures most of the attention on currency markets by showing some strength after a period of Fed-induced weakness. Nothing changed to the dire technical picture though. The trade-weighted index (DXY) narrowly escaped from a break below the end-2023 correction low by moving from 100.57 to 101.07. EUR/USD dipped from 1.1184 towards the 1.11 big figure. The EUR/GBP cross rate continues down the same path with the pair setting an intraday low of 0.841 before paring some losses to 0.842 currently. Governor Bailey’s “the job is not completed” speech at Jackson Hole put the BoE in stark contrast with the Fed and ECB and that’s clearly still leaving some marks on the British currency. European shares outperform (EuroStoxx50 +0.6%) those in the US with market tension building ahead of the Nvidia earnings. The single stock has the potential to lift the likes of the S&P500 towards new record highs.
News & Views
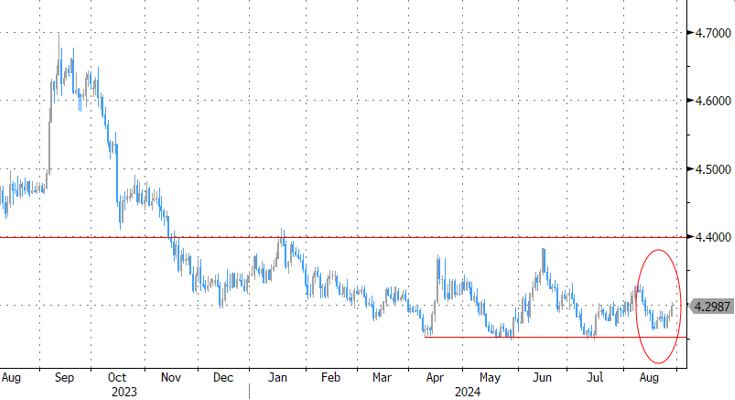
In an interview with Polish business newswire PAP, national bank of Poland MPC member Gabriela Maslowska was quoted that she didn’t exclude the possibility of an NBP rate cut in 2025. Currently there is still a long way to go for that to happen as the NBP continues to monitor changes in the inflation and macro-economic growth forecast. Keeping this caution into account, Maslowska indicated that the NBP still will reacted appropriately when GDP growth and inflation would be lowered at the same time. Aside from the domestic economic developments, a too large disparity with the eurozone and the US could cause large and unfavourable fluctuations in the zloty exchange rate. The comments of Maslowska come as other MPC members, including from governor Glapinski, recently had a less hawkish tone suggesting that the debate on rate cuts might be looming on the horizon. The NBP shifted to a prolonged pause after cutting the policy rate in September (75 bps) and October (25 bps) last year. The zloty recently met resistance in the EUR/PLN 4.25 area and today weakens further to test the EUR/PLN 4.30 area.
The monthly German IFO employment barometer in August declined for the third consecutive month, indicating that German companies are turning more cautious on hiring. The index declined from 95.3 to 94.8. According to IFO’s head of survey’s “The lack of orders is causing companies to put the brakes on hiring.” Especially in manufacturing the barometer fell noticeably as more companies are considering cutting jobs. The same applies to trade. In the construction industry employees are to be retained despite the severe crisis. A positive hiring trend only remains in place among service providers, in particular in the IT sector and in tourism.
Graphs
Trade-weighted dollar index (for now) narrowly escaped from a technical break lower.
EUR/PLN: zloty takes note of increasing amount of MPC members raising possibility of a 2025 cut
EUR/PLN: zloty takes note of increasing amount of MPC members raising possibility of a 2025 cut
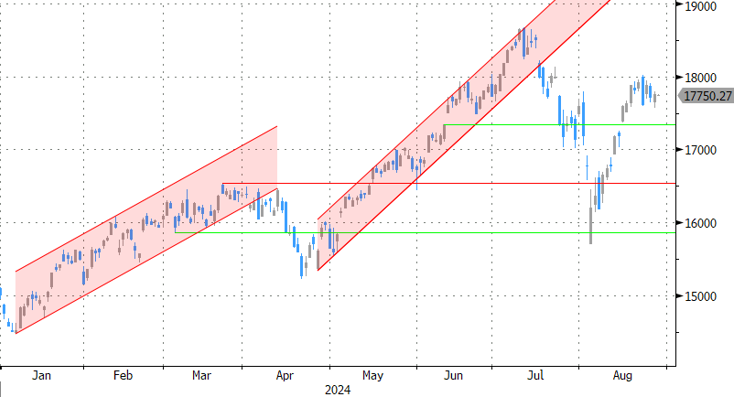
Nasdaq (and other US indices) anxiously awaiting the results of a single, market-moving stock: Nvidia
Euro Declines Ahead of German Inflation, US GDP
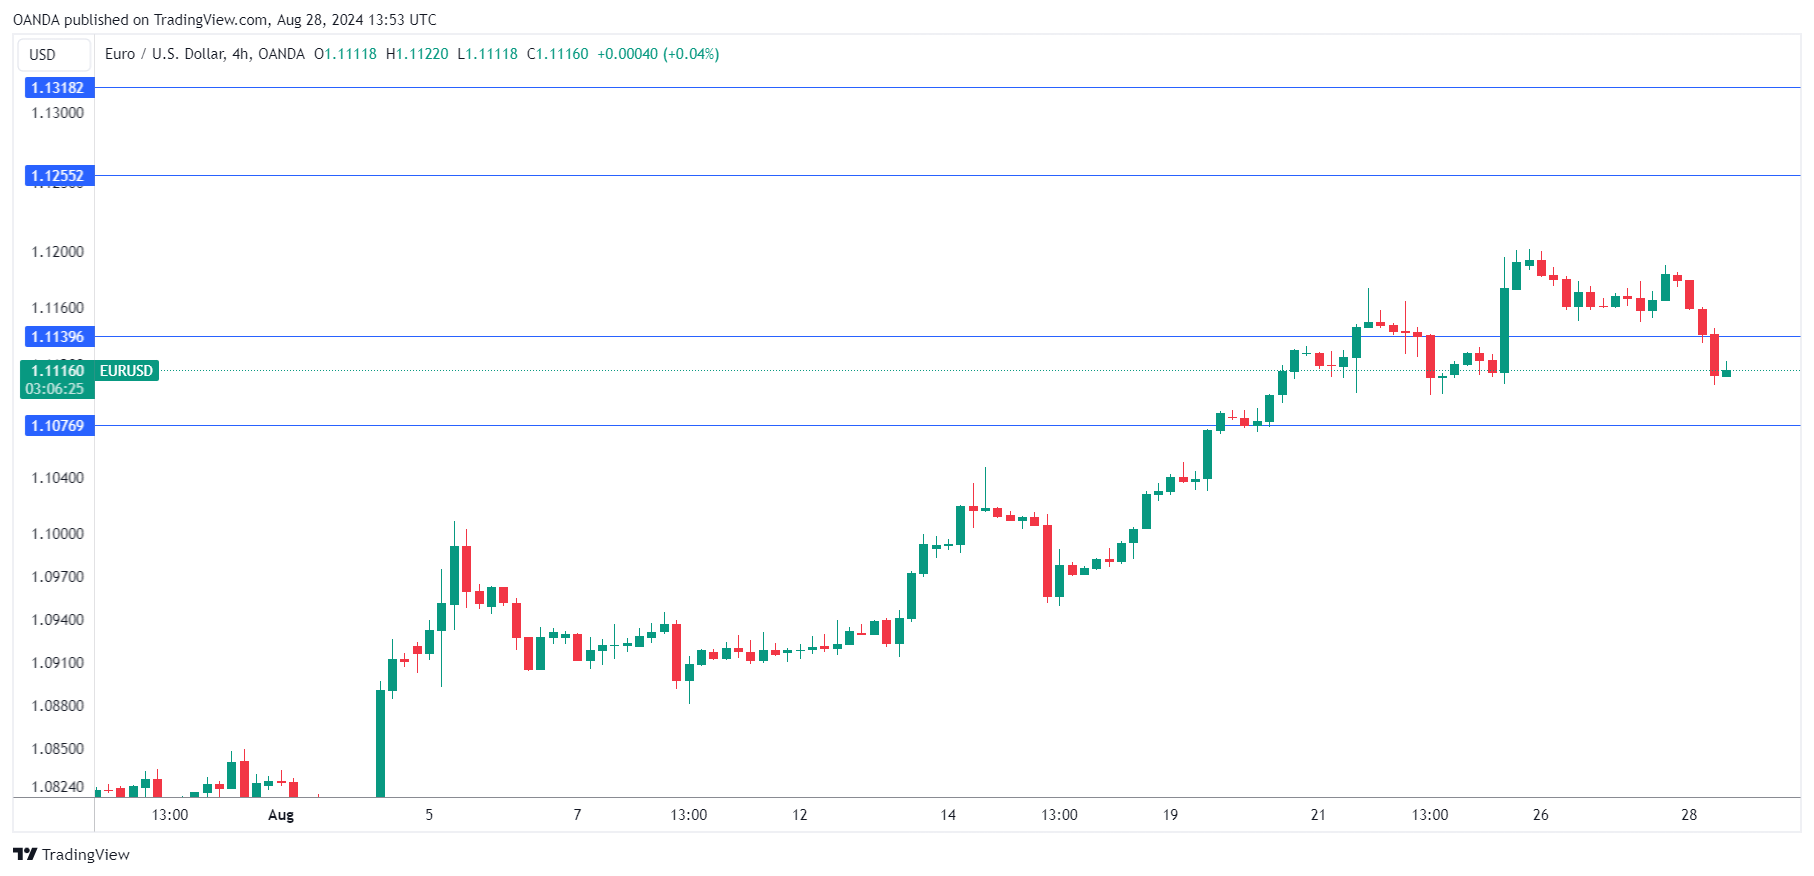
The euro is sharply lower on Wednesday. In the European session, EUR/USD is trading at 1.1116 at the time of writing, down 0.60% on the day. There are no tier-1 events on today’s data calendar but Thursday will be busy, with German CPI and US GDP.
German CPI expected to ease
Germany, the largest economy in the eurozone has lost its status as the locomotive of Europe and is yet to find its footing. GDP was flat in the second quarter after a 0.1% contraction in Q1, as the weak economy narrowly averted a technical recession. The German consumer remains deeply pessimistic about economic conditions and that likely will dampen consumer spending, a key driver of the economy.
The eurozone follows on Friday with the August inflation report. CPI is expected to ease to 2.2% y/y, down from 2.6% in August. The core CPI rate is projected to tick lower to 2.8% versus 2.9% in July. The data could offer clues about the ECB’s rate decision on Sept. 12. The ECB delivered its first rate cut of the new cycle in June and could trim again as early as next month if ECB policy makers are confident that inflation is moving in the right direction.
The US will release second estimate GDP for the second quarter on Thursday. The initial estimate showed the economy powering ahead with a 2.8% gain, double the 1.4% pace in Q1. The second estimate is expected to confirm the initial reading and confirm that the economy remains in solid shape, despite concerns about a weak employment labor which led to a global market meltdown earlier this month.
EUR/USD Technical
- EUR/USD has pushed below support at 1.1139. Next, there is support at 1.1076
- There is resistance at 1.1255 and 1.1318
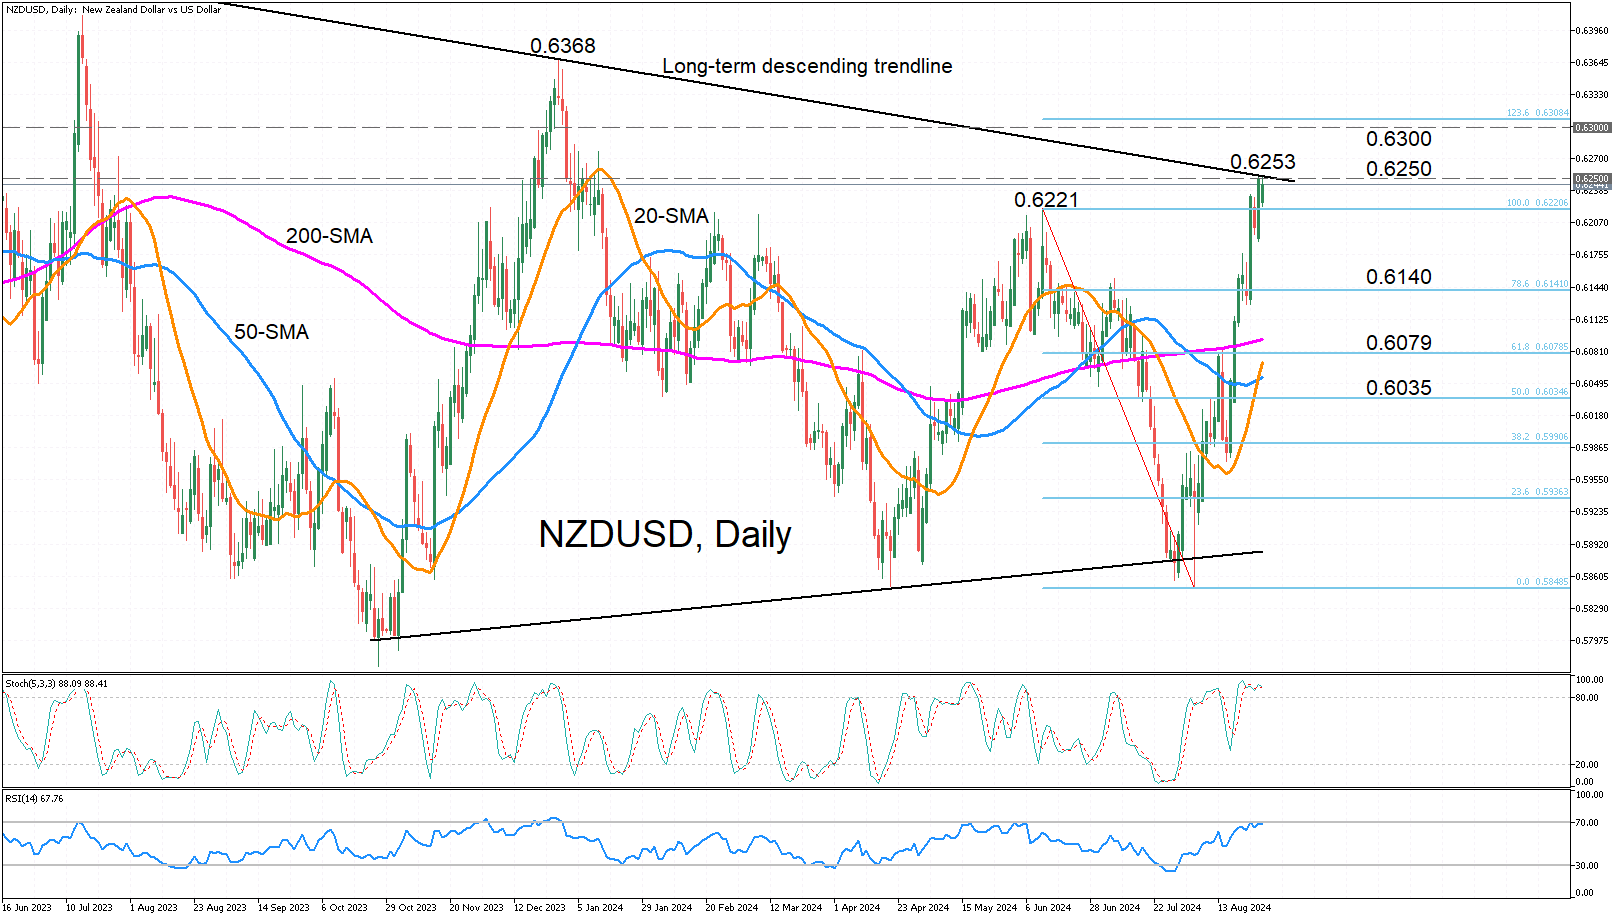
NZDUSD Still Bullish But Rally Looks Overstretched
- NZDUSD is up almost 5% so far in August
- Further gains are likely, but risk of near-term correction is high
NZDUSD is trading near seven-month highs on Wednesday, as the pair continues its August bull charge. However, there appears to be some resistance in the 0.6250 area where the intersecting long-term descending trendline is providing additional friction.
The technical indicators remain bullish but point to fading positive momentum in the near term. The stochastic oscillator has flatlined in the overbought region, while the RSI is hovering just beneath the 70-overbought mark.
Should the pause in the rally turn into a selloff, NZDUSD could initially slip towards the 78.6% Fibonacci retracement of the June-August downleg at 0.6141. A drop lower would bring the 61.8% Fibonacci of 0.6079 into view. Both the 200- and 20-day simple moving averages (SMA) are also in the vicinity, potentially, making it difficult for the bears to make much progress from hereon.
However, a successful break lower towards the 50% Fibonacci of 0.6035 could mark a shift to a more neutral outlook in the short-to-medium term.
On the other hand, if the price is able to overcome the 0.6250 resistance, the next stop could be the 123.6% Fibonacci extension slightly above 0.6300. Even higher, attention is likely to turn to the December 28, 2023 high of 0.6368.
In brief, NZDUSD’s uptrend has gone from strength-to-strength, but conquering the 0.6250 level will be key to extending the winning streak.
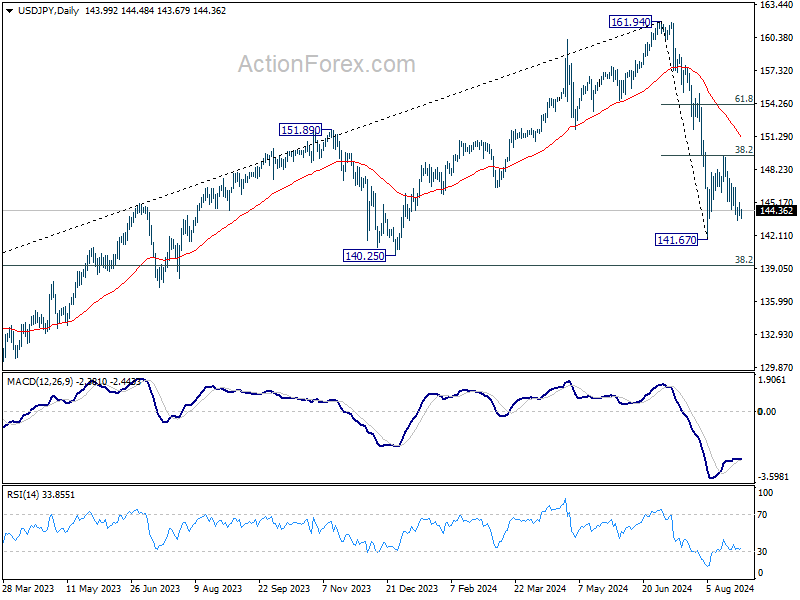
USD/JPY Mid-Day Outlook
Daily Pivots: (S1) 143.52; (P) 144.35; (R1) 144.78; More...
For now, further decline is still in favor in USD/JPY with 146.47 resistance intact, to retest 141.67 low. Firm break there will resume the whole fall from 161.94 to 140.25 support next. On the upside, above 146.47 minor resistance will turn intraday bias back to the upside for 149.35 resistance instead.
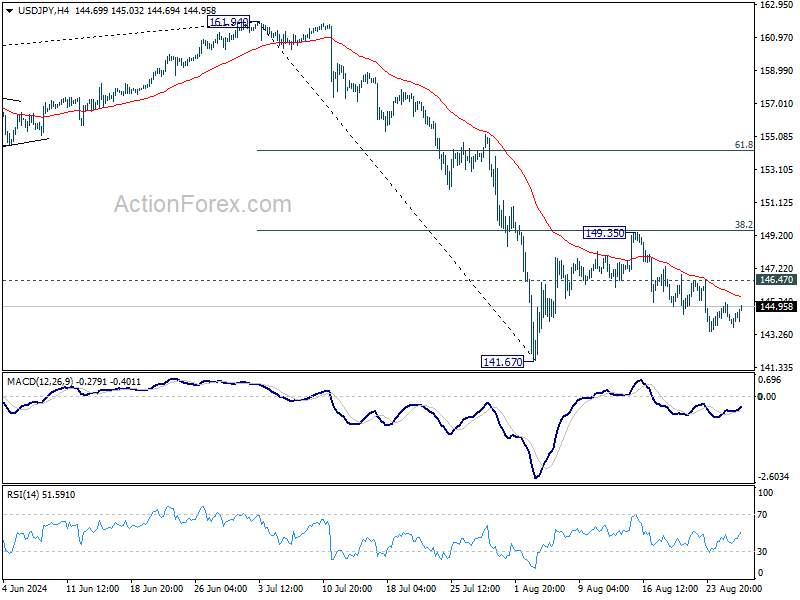
In the bigger picture, fall from 161.94 medium term top is seen as correcting whole up trend from 102.58 (2021 low). Deeper decline could be seen to 38.2% retracement of 102.58 to 161.94 at 139.26, which is close to 140.25 support. In any case, risk will stay on the downside as long as 55 W EMA (now at 149.38) holds. Nevertheless, firm break of 55 W EMA will suggest that the range for medium term corrective pattern is already set.
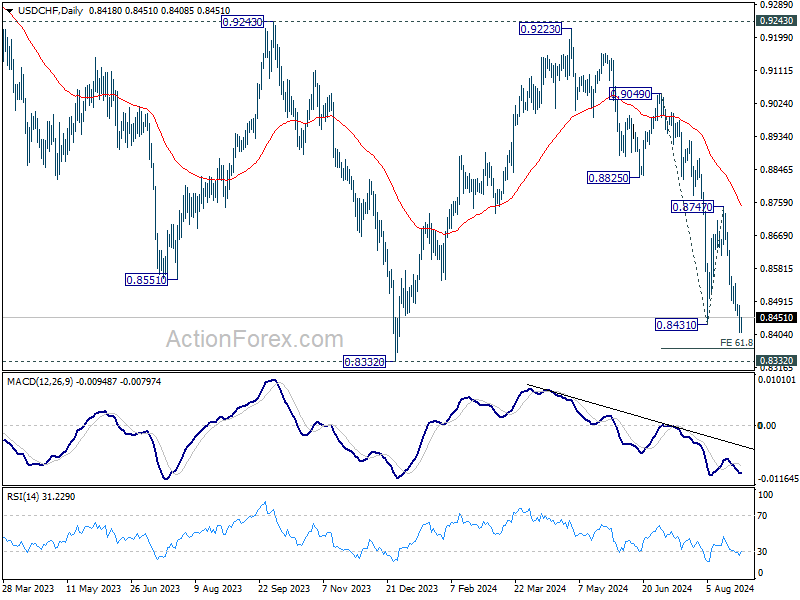
USD/CHF Mid-Day Outlook
Daily Pivots: (S1) 0.8388; (P) 0.8437; (R1) 0.8464; More…..
Intraday bias in USD/CHF remains on the downside for the moment. Fall from 0.9223 is resuming and should target 61.8% projection of 0.9049 to 0.8431 from 0.8747 at 0.8365, and then 0.8332 low. On the upside, above 0.8484 minor resistance will turn intraday bias neutral. But outlook will remain bearish as long as 0.8747 resistance holds, in case of recovery.
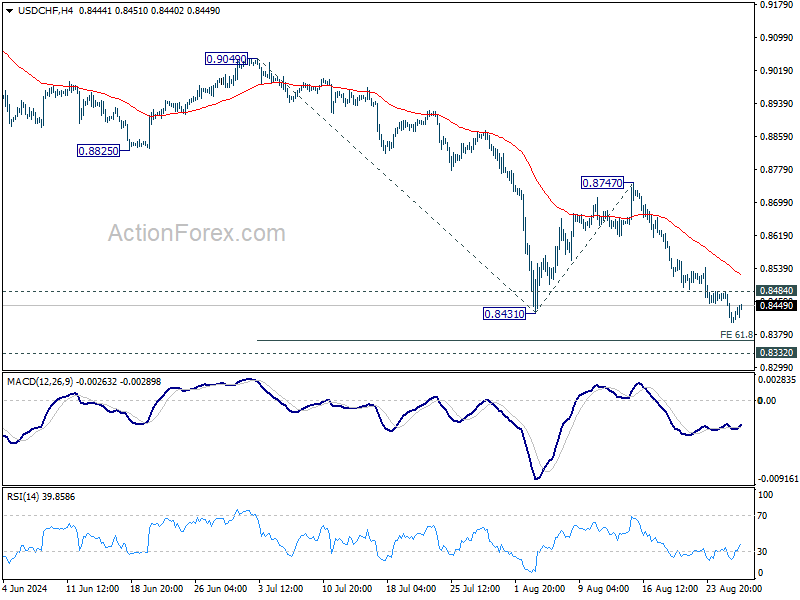
In the bigger picture, price actions from 0.8332 (2023 low) are currently seen as a medium term corrective pattern, with fall from 0.9223 as the second leg. Strong support could be seen from 0.8332 to bring rebound. Yet, overall outlook will continue to stay bearish as long as 0.9243 resistance holds. Firm break of 0.8332, however, will resume larger down trend from 1.0146 (2022 high).
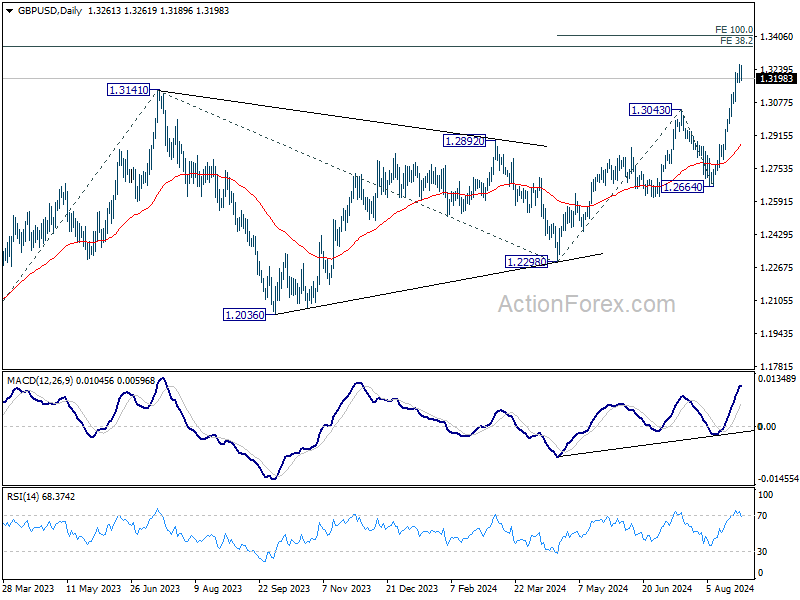
GBP/USD Mid-Day Outlook
Daily Pivots: (S1) 1.3205; (P) 1.3236; (R1) 1.3291; More...
A temporary top is formed at 1.3265 in GBP/USD with current retreat. Intraday bias is turned neutral for consolidations first. Downside of retreat should be contained well above 1.3043 resistance turned support to bring rebound. On the upside, above 1.3265 will resume larger up trend to 100% projection of 1.2298 to 1.3043 from 1.2664 at 1.3409.
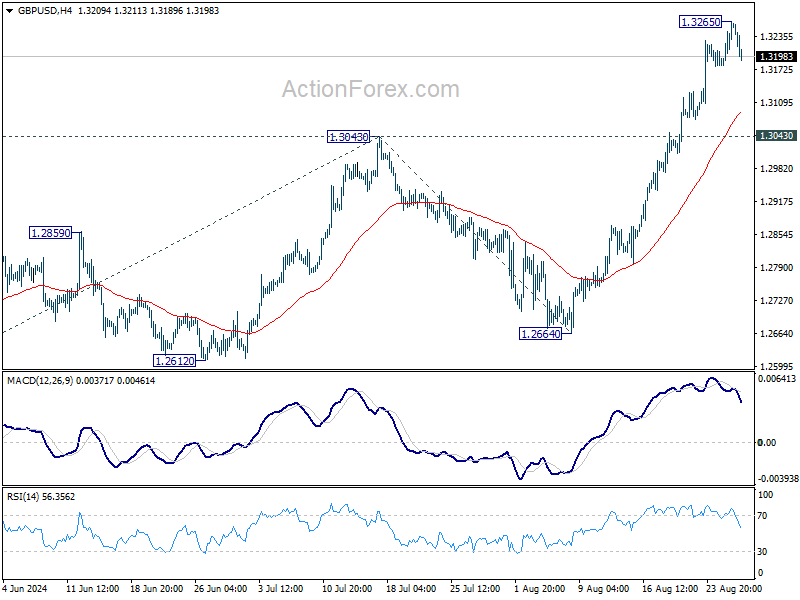
In the bigger picture, up trend from 1.0351 (2022 low) is resuming. Next target is 38.2% projection of 1.0351 to 1.3141 from 1.2298 at 1.3364. For now, outlook will stay bullish as long as 1.2664 support holds, even in case of deep pullback.