Sample Category Title
Gold: Long-Term Bullish, Short-Term Correction
The Federal Reserve is widely expected to cut interest rates soon, which has boosted the appeal of gold. However, Daniel Ghali, a Senior Commodity Strategist at TDS, warns that a potential correction in gold prices is becoming more likely. Current investor positioning in gold has reached levels last seen during the pandemic, which often signals a market peak. Additionally, traders in silver are heavily positioned for gains, making both metals vulnerable to a sell-off if prices don’t break higher. Ghali cautions that the crowded market is a risk, hinting that a downturn could be on the horizon.
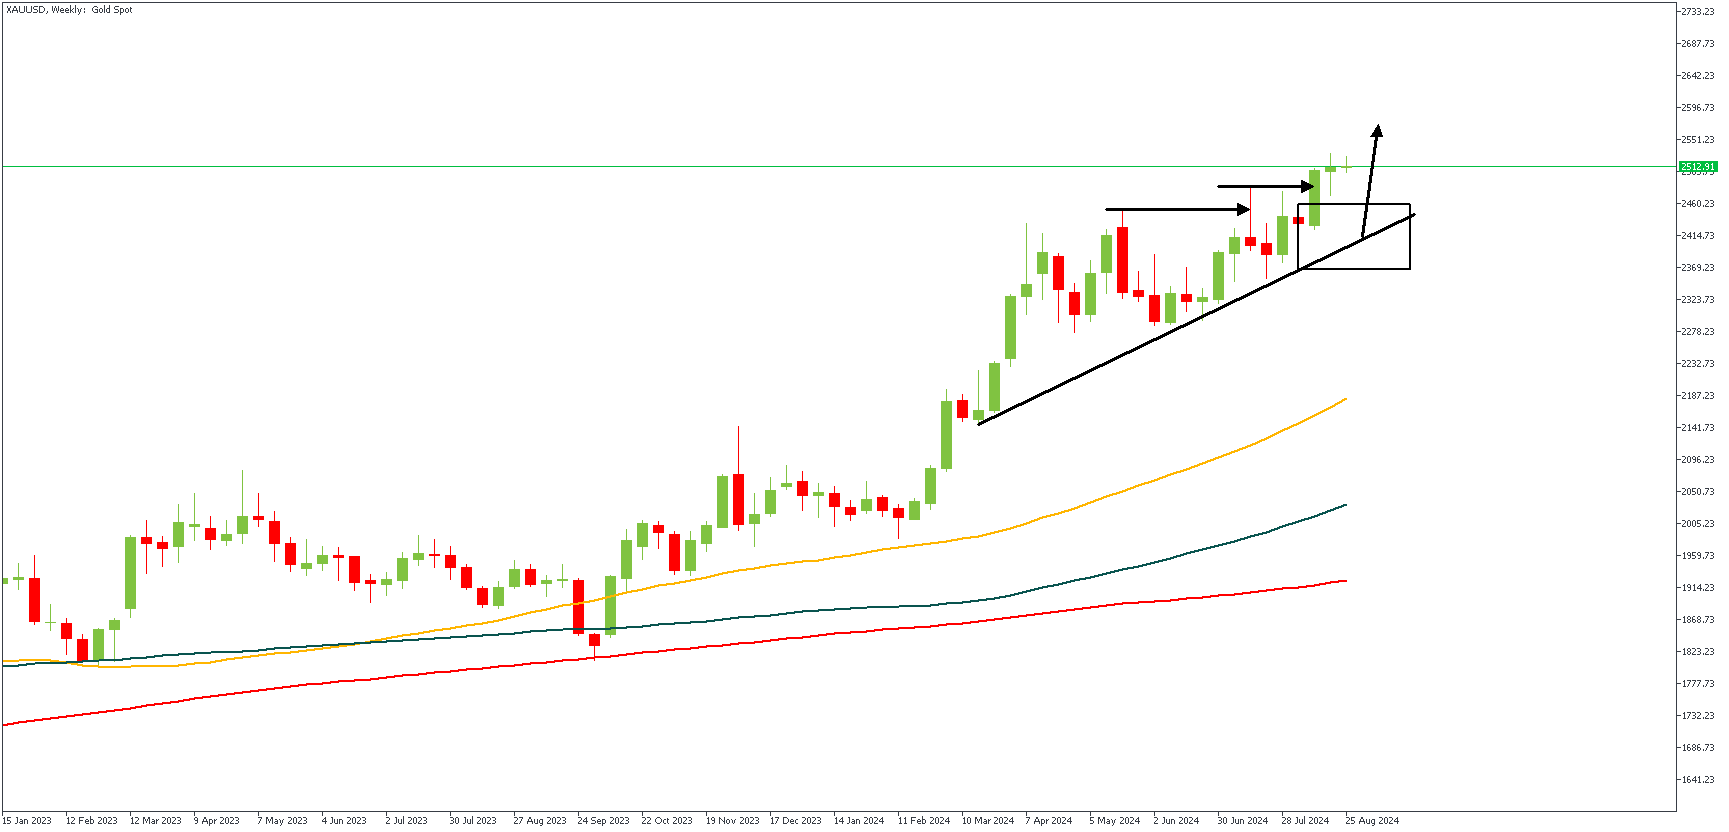
XAUUSD – W1 Timeframe
The weekly timeframe chart of XAUUSD presents a very interesting price action. The previous break of structure to create the new high left behind a demand zone, which I very much expect price to retest in the coming days. The presence of a trendline support provides a much-needed confluence in favor of the bullish sentiment.
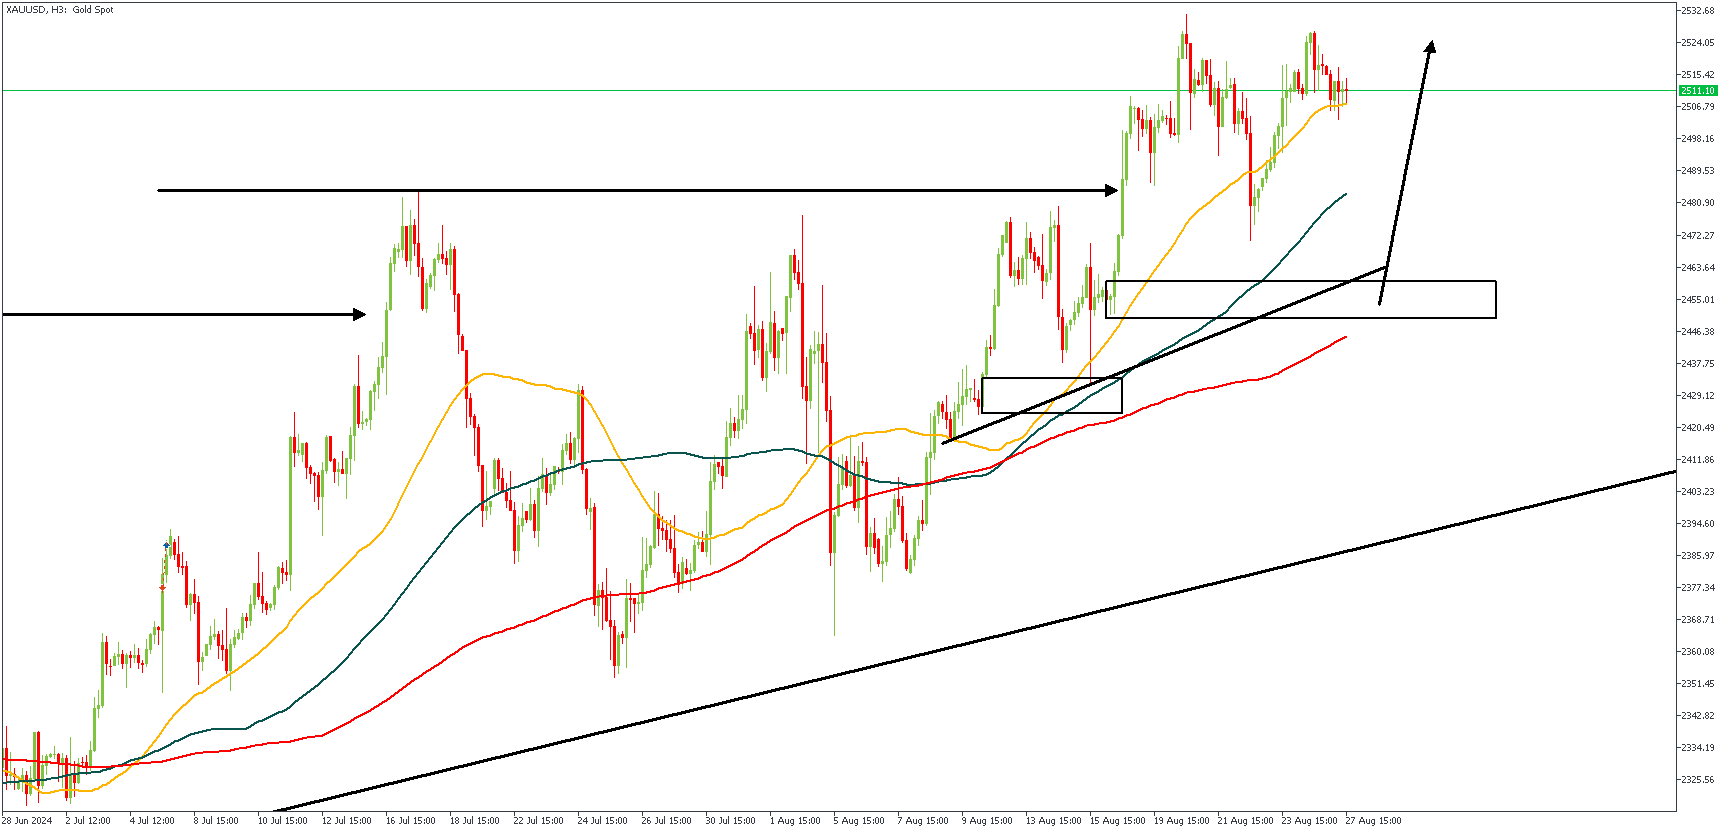
XAUUSD – H3 Timeframe
In spite of the long-term sentiment being bullish, the price action on the 3-hour timeframe suggests that Gold price is likely to retrace over the next few days, in order to bring price into the demand zone. The trendline support, demand zone, bullish array of the moving averages, and the 200-period moving average all align in favor of the long-term bullish sentiment.
Analyst’s Expectations:
- Direction: Bullish
- Target: $ 2,532.68
- Invalidation: $ 2,415
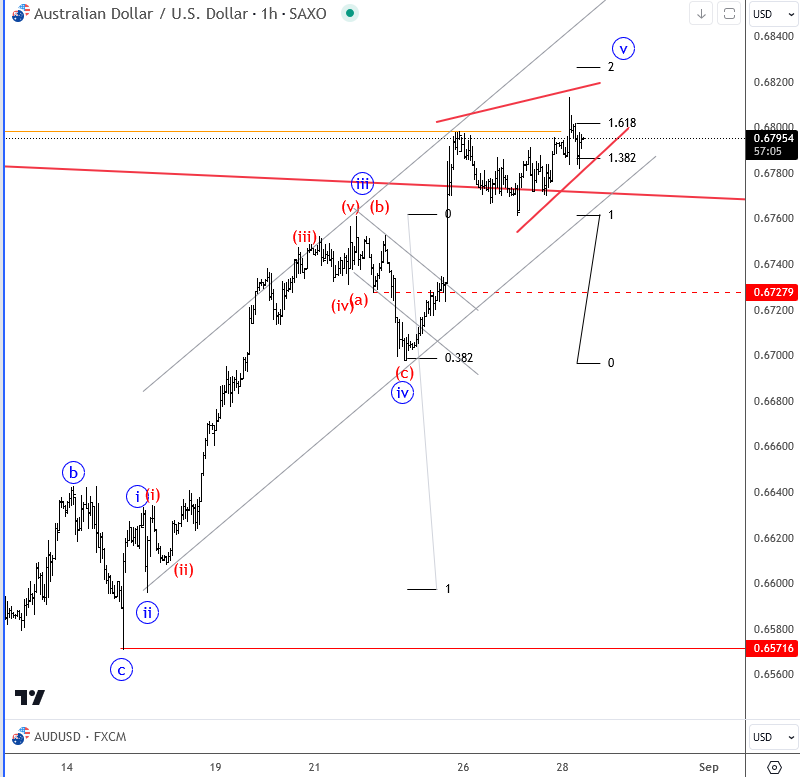
Elliott Wave Analysis: Aussie Testing Resistance After AUD CPI Data
The Aussie jumped to a new high versus the US dollar during the session after the Australian CPI came in at 3.5%, down from 3.8%. However, this was worse than expected, as expectations were at 3.4%. This discrepancy caused a spike to the upside in the Aussie, but it's important to note that inflation is still cooling down, which is the most important, and this cooling trend could suggest that the RBA might consider another rate cut in the coming months if inflation continues heading towards 3%. This expectation might limit the upside then in the near term.
Looking at the wave count, we can see five waves up, which could be in their late stages as we approach the 0.6820 level.
AUD/USD Outlook: Lacks Strength to Hold Gains on Above Forecast Australian CPI
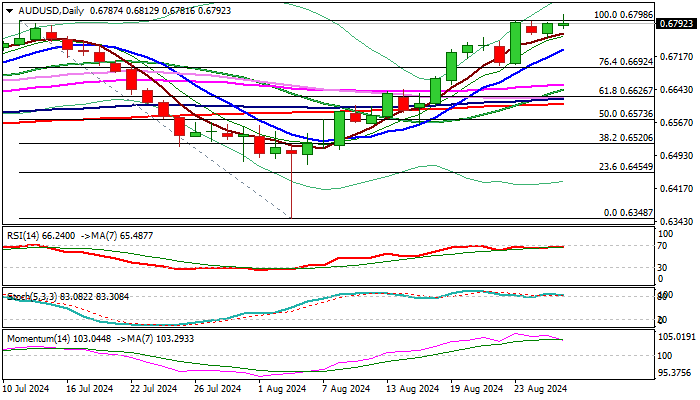
AUDUSD hit new 8-month high in Asian session on Wednesday, lifted by higher than expected Australian July CPI, but was so far unable to hold gains above 0.6800 mark.
Although subsequent dip was shallow, it sends initial warning that larger rally from 0.6348 (Aug 5 spike low) might be running out of steam.
Triple consecutive failure to clear previous top at 0.6798 (July 11) and today’s (so far) false break, contribute to such scenario in addition to initial negative signals from fading positive momentum and Stochastics’ bearish divergence on daily chart, as well as Thursday’s twist of daily cloud.
Immediate bias is expected to remain firmly bullish as long as the price stays above 0.6761 (Aug 21 former top/Aug 27 low/upper 20-d Bollinger band), while break here to generate initial bearish signal and risk dip towards 0.6734/00 (rising 10DMA / Aug 22/23 higher base) which guards more significant supports (a cluster of daily MA’s at 0.6655/10 zone / Fibo 38.2% of 0.6348/0.6812 rally).
Res: 0.6812; 0.6839; 0.6871; 0.6904.
Sup: 0.6761; 0.6734; 0.6700; 0.6655.
USDJPY Gets Assistance from 143.40 Support
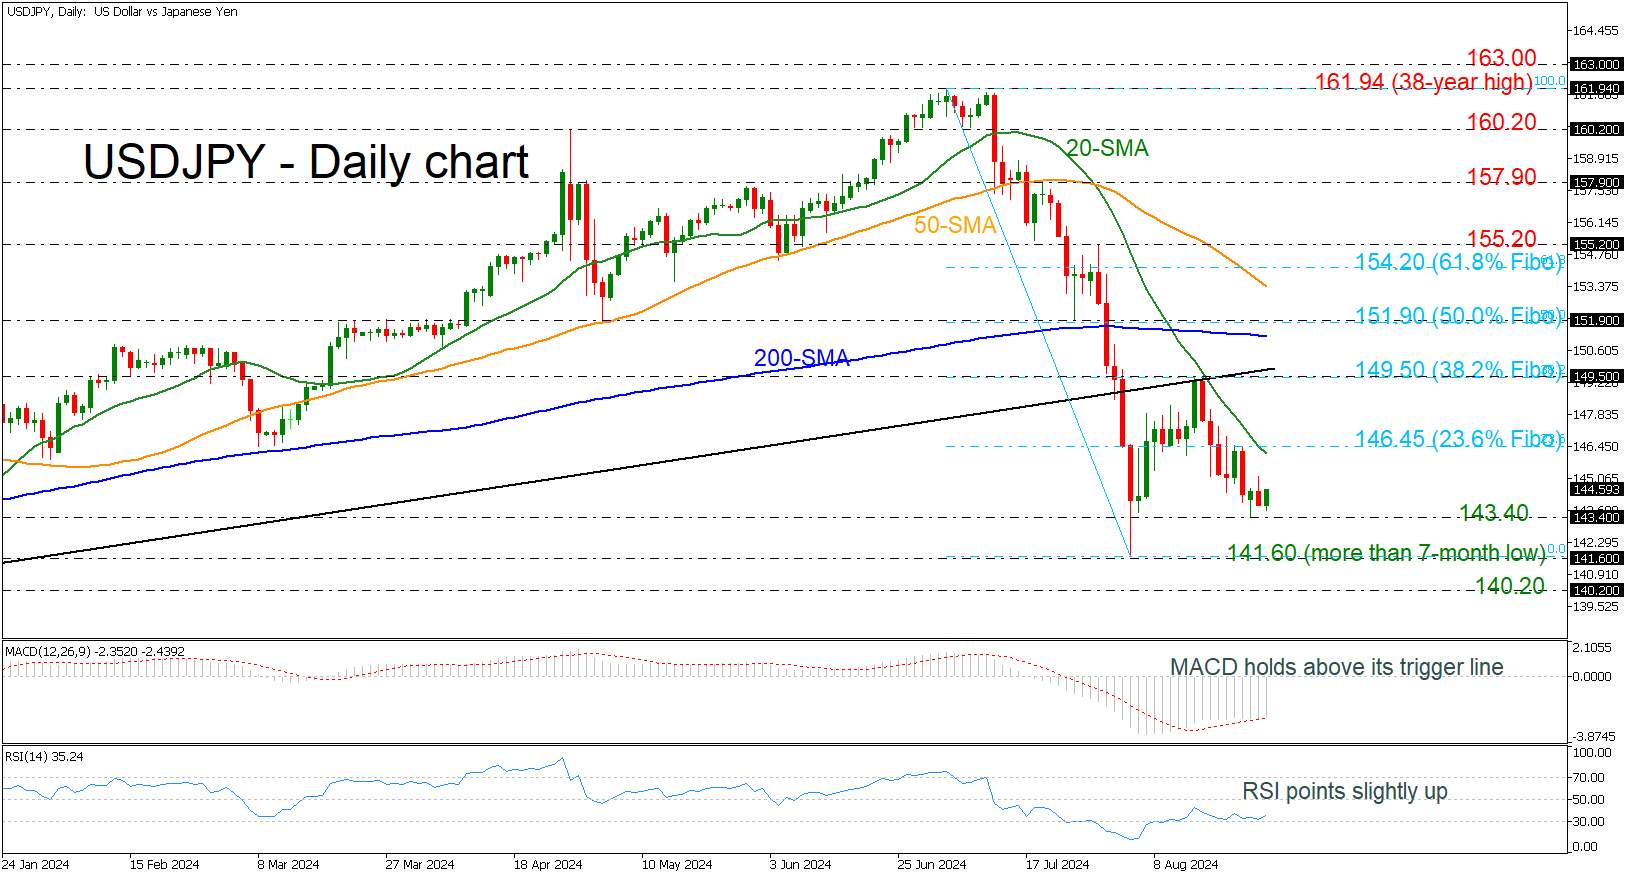
- USDJPY retains bearish bias
- MACD and RSI try to gain some momentum
- 23.6% Fibonacci acts as strong resistance
USDJPY is continuing its descending movement, especially after the failed attempt to jump above the uptrend line and the 38.2% Fibonacci retracement level of the down leg from 161.94 to 141.60 at 149.50. As the market remains beneath the 23.6% Fibonacci of 146.45 and the 20-day simple moving average (SMA), there is no notable sign for an upside retracement.
However, the technical oscillators indicate a weak bearish structure. The MACD is still in the negative territory but above its trigger line, while the RSI is sloping marginally up near the 30 level.
More downside movements could find immediate support at the 143.40 level, which is ahead of the more than seven-month low of 141.60, before posting a lower low at 140.20, which was registered on December 24.
If the bulls take control, then the 23.6% Fibonacci of 146.45 and the 38.2% Fibonacci of 149.50 are the next obstacles. Even higher, a penetration of the 200-day SMA at 151.30 could be a signal for an upside correction.
In brief, USDJPY retains the bearish structure that started after it topped at 161.94, but in the bigger picture, the pair is bullish, holding well above the 200-week SMA.
For Yields and Dollar Some Further Consolidation on the Cards
Markets
Core interest rate markets yesterday tried to further build on a tentative pause/bottoming out process that started on Monday. With 100 bps Fed cuts discounted for this year and another 125 bps of reduction priced in for next year, markets for now apparently feel themselves as trading in line even with the new Fed guidance of a genuine scaling back of policy restriction. However, US data were inconclusive and didn’t really help to kickstart a real directional countermove. US house price data were close to expectations. Consumer confidence (Conference Board) for the second consecutive month beat market expectations (103.3 from 101.9) with both the current situation assessment and expectations adding to the improvement. At the same time, Richmond Fed business surveys suggest a further cooling in activity both in manufacturing and services. With markets still more sensitive to soft rather than strong data, the latter to some extent capped an intraday rebound in yields. Later in the session, (US) bonds were also supported by a strong investor buying interest at a $69 bln 2-y Treasury auction. US yields at the end of the day finished little changed in a tentative steepening move (2-y 3.7 bps; 30-y +0.8 bp). German Bunds outperformed with yields rising between 0.6 bp (2-y) and 5.4 bps (30-y). First August EMU inflation data to be released tomorrow and on Friday might help to clarify whether the ECB might have room to step up the pace of easing beyond an expected 25 bps step in September. The unconvincing intraday picture in US yields also capped any upside momentum in the dollar. DXY closed at a YTD low (100.55). EUR/USD finished at 1.1184. Sterling continued its outperformance, both against the euro and the dollar despite mixed CBI retail data (cable 1.326, EUR/GBP 0.8434). Equities didn’t go anywhere with investors looking forward to the Nvidia results to be published after the close in the US this evening. Oil reversed Monday’s jump higher to close near $ 79.55 p/b (Brent).
This morning, Asian equities mostly trade lower, with China underperforming. US yields show no clear trend. The dollar tries to regain some ground (EUR/USD 1.1145; USD/JPY 144.45, DXY 100.85). The eco data calendar is extremely thin in both side soft the Atlantic. The US Treasury will sell $70 bln 5-year Notes. Nvidia results (after the close) might help to investors to make up their mind whether there is further upside momentum in equities even as US indices are nearing record levels. For yields and the dollar some further consolidation near/slightly above recent lows might be on the cards today.
News & Views
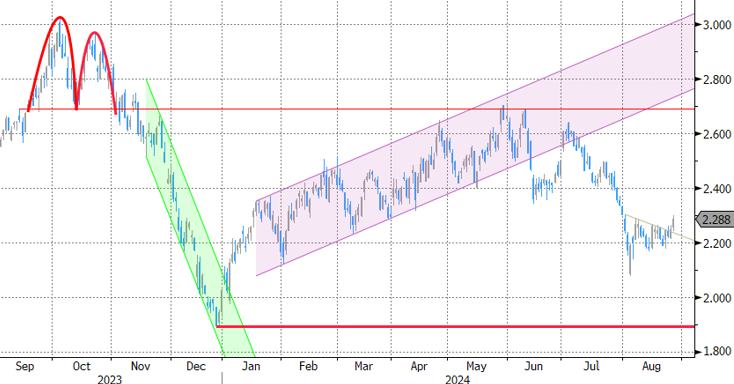
The Financial Times runs an article on China’s plans to issue billions of dollars of government bonds before the end of the year. People close to the central bank warned that they have the potential to burst the bubble in the country’s bond market. Official data show that as of July the government had yet to issue about Rmb 2.68tn ($376bn) from its full-year quota of special local government bonds (Rmb 3.9tn) and ultra-long central government treasuries (Rmb 1tn). Proceeds of the former are used by lower authorities for projects and investments while the latter serve to help stimulate the overall, slowing, economy. The wall of supply threatens a bullish Chinese bond market which push yields at 10-yr tenors to as low as 2.2%. Other agencies working close with the PBOC warned earlier this month as well that LT government bond yields have deviated from a reasonable range and show a tendency towards some degree of bubble.
Czech National Bank governor Michl yesterday indicated that it’s better to have a more consistent, but overall more restrictive monetary policy. The economy should be based on savings, not on debt. If we remain strict, one day we will prevent a repeat of high inflation. His comments came in the wake of his visit to Jackson Hole. He also warned against making rushed, ad-hoc monetary policy steps and experiments. The CNB cut its policy rate by 250 bps in total since December, to 4.5%. They meet next on September 25 where we expect a 25 bps rate cut.
Graphs
GE 10y yield
The ECB cut policy rates by 25 bps in June. Stubborn inflation (core, services) make follow-up moves less evident. Markets nevertheless price in two to three more cuts for 2024 as disappointing US and unconvincing EMU activity data rolled in, dragging the long end of the curve down. The move accelerated during the early August market meltdown.
US 10y yield
The Fed in its July meeting paved the way for a first cut in September. It turned attentive to risks to the both sides of its dual mandate as the economy is moving to a better in to balance. Markets tend to err in favour of a 50 bps lift-off. The pivot weakened the technical picture in US yields with another batch of weak eco data pushing the 10-yr sub 4%. Powell at Jackson Hole didn’t challenge markets’ positioning.
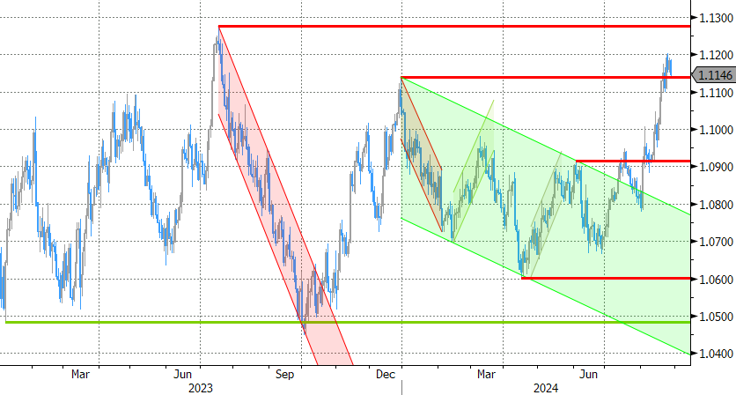
EUR/USD
EUR/USD moved above the 1.09 resistance area as the dollar lost interest rate support at stealth pace. US recession risks and bets on fast and large (50 bps) rate cuts trumped traditional safe haven flows into USD. EUR/USD 1 1.1276 (2023 top) serves as next technical reference.
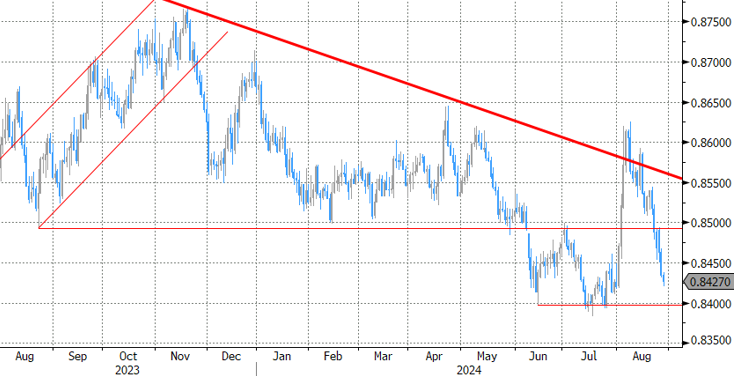
EUR/GBP
The BoE delivered a hawkish cut in August. Policy restrictiveness will be further unwound gradually on a pace determined by a broad range of data. The strategy similar to the ECB’s balances out EUR/GBP in a monetary perspective. Risk-off proved a more important driver of GBP recently, triggering a brief return from 0.84 towards 0.86.
Markets Poised for Nvidia Earnings
In focus today
In Sweden, today's foreign trade data for July will give some preliminary insight into Q3 activity. Riksbank vice governor Anna Breman gives a speech on climate and monetary policy at 13:00 CET.
NVIDIA quarterly earnings are due tonight. The company, which moves up and down in the top 3 most valuable listed US stocks, has become the face of the AI tech boom and markets have used its earnings calls to assess the status of AI capex spending. Thus, it has the potential to move global markets despite being scheduled after US market close.
Economic and market news
What happened overnight
Australian inflation came in a bit higher than expected at 3.5% in July (cons.: 3.4%), which prompted Asian shares to slip and sent Australian yields slightly up as markets lowered the odds of a November cut from the RBA.
What happened yesterday
In the US, the Conference Board consumer survey improved more than expected with the overall index at 103.3 (cons.: 100.7). The details revealed that consumers see lower odds of a recession, expect substantially lower inflation (4.9% from 5.3%), and a weaker labour market; all in line with the prevailing market narrative post-Jackson Hole, which currently sees a 25bp cut fully priced in for the September meeting. As such the market impact was muted.
Oil nearly reversed Monday's gains with Brent at 79.66 USD/bbl. as of this morning. The move seems to be driven in part by expectations of lower growth following the Fed's dovish comments, and in part by reports that the risk of further escalation between Israel and Hezbollah seems to have diminished.
In geopolitics, Ukrainian President Zelenskiy is ready to present a peace plan to the US government and potentially the presidential candidates in September, with recent Ukrainian incursions into Russian territory being part of this plan.
ECB Governing Council member Knot was slightly hawkish stating a September cut was not a done deal, contrary to what markets are pricing, citing lack of data.
Equities: Global equities were marginally higher yesterday, showcasing a very mixed sector and regional performance. However, large-cap cyclicals continued to outperform, with US tech performing well and implied volatility slightly decreasing. As we approach the end of the week, we anticipate more intriguing micro and macro news that will likely spur greater activity, especially in the equity markets. In the US yesterday, Dow +0.02%, S&P 500 +0.2%, Nasdaq +0.2%, and Russell 2000 -0.7%. Asian markets are lower this morning, and the same trend is observed in most US markets. European futures are higher again today, despite the headwinds from a stronger euro.
FI: Long-end EGB yields edged higher throughout yesterday's session, with the 10Y Bund yield settling just shy of the 2.30% threshold. In contrast, short-end yields remained relatively stable, as markets continue to anticipate approximately 65bp in ECB rate cuts by year-end. The 5y5y EUR inflation swap rate climbed by about 4bp to 2.575%, reflecting recent increases in commodity prices. Concurrently, the Bund ASW spread has tightened, now trading at 28.7bp, amid diminishing risk premiums and sustained high activity in the primary market.
FX: After the big moves last week this week has failed to bring any bigger moves in G10 FX. The CHF and the NOK were an unusual set of outperformers yesterday, but the gains were still limited to less than 1 standard deviation from a historical perspective.
Happy Nvidia day
The markets were calm yesterday, the European stocks extended gains, while the S&P500 and Nasdaq consolidated a bit lower than their ATH levels. A $69bn sale of US 2-year debt went well, the US 2-year yield extended losses and the US dollar rebounded from the lowest levels of the year. Crude oil, which rallied to its 200-DMA on mounting tensions in Middle East and Libya, failed to break offers at this level and fell nearly 2% as most traders brought the global growth concerns and the sluggish Chinese recovery back on the table. The barrel of US crude eased to $76pb level and is consolidating near this level this morning. We will probably have another calm trading session today, as investors will not be willing to move mountains before they see the latest results from Nvidia, that are due to be released today, after the closing bell.
Happy Nvidia day
Today is probably the most important day of the week, and of the earnings season, because it’s Nvidia’s earnings announcement day! Nvidia has a weight of around 6% in the S&P500 and it accounted for a third if its gains of the index this year. So the company’s earnings announcement day is naturally a big day for the market.
The expectations for Nvidia’s Q2 results are sky-high, of course. In numbers, Nvidia’s own revenue forecast is a whopping $28bn of sales in the Q2 of this year. That’s more than the double of the money the company made a year ago And the market expectations are even more than that: they range between $27 and $32bn. The LSE Group data for example suggests that sales at Nvidia’s sales may have grown by 75% in the Q2 to $31.69bn on persistently high spending from the Big Tech companies – that make up to 40% of the Nvidia’s revenue. The strong TSM earnings reported earlier in this earnings season also hints that we could see another blowout quarter from Nvidia. And given that the company has consistently printed a $2bn beat on its own forecast for the last four quarters, there is reason to think that the $30bn of sales is definitely within reach.
But there are risks, too. First, higher expectations are harder to beat, and a number below the $30bn mark could disappoint more than one. Second, Nvidia had to delay the launch of its next generation Blackwell chip due to issues in design and manufacturing, and even though the company has enough popular chips to sell, the delay of the Blackwell chips could alter their own predictions for the quarters ahead and discourage investors. Third, Nvidia faces rising competition from the likes of AMD, Qualcomm and Intel. and the rising competition will start eating into the profit margins sooner rather than later. And finally, we can’t ignore the mounting worries regarding the Big Tech companies’ massive AI spending that has not improved these companies’ profitability just yet. Except at Meta, where Zuckerberg managed to convince investors that AI is having a positive impact on the ad revenue, other companies’ investors are frustrated regarding the return on AI investments, both regarding the timing and the size of the benefits on profitability. Even though Big Tech companies have enough cash on hand to increase their capex spending on AI—and they insist they would rather overspend than risk jeopardizing their dominance—if investors start pulling out, they may be forced to scale back their spending plans, which poses a risk for AI enablers like Nvidia.
Anyway, after the year and a half that we spent, and based on the data and numbers available to us today, it’s very hard to give a bad call for Nvidia. But everything from numbers to the guidance should look fantastic to send the stock’s price to new records. And bad news arrives when you least expect it; if there is a correction, it could be a sizeable one. We expect decent post-earnings volatility. Based on options pricing, the stock could move around 10% up and down after the results.
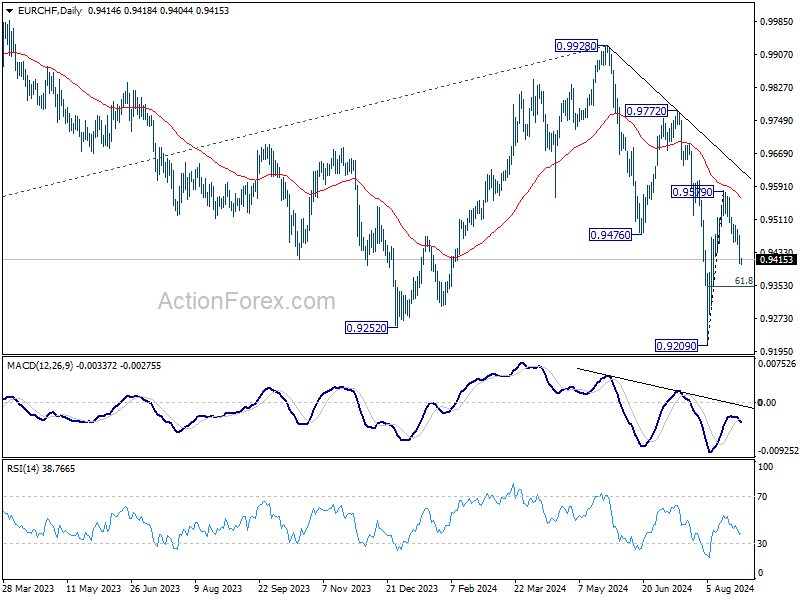
EUR/CHF Daily Outlook
Daily Pivots: (S1) 0.9389; (P) 0.9431; (R1) 0.9456; More....
Intraday bias in EUR/CHF remains on the downside for the moment. Corrective rebound from 0.9209 should have completed at 0.9579 after rejection by 55 D EMA. Deeper fall should be seen to 61.8% retracement of 0.9209 to 0.9579 at 0.9350. Firm break there will bring retest of 0.9209 low. On the upside, however, break of 0.9497 minor resistance will turn bias back to the upside for 0.9579 resistance instead.
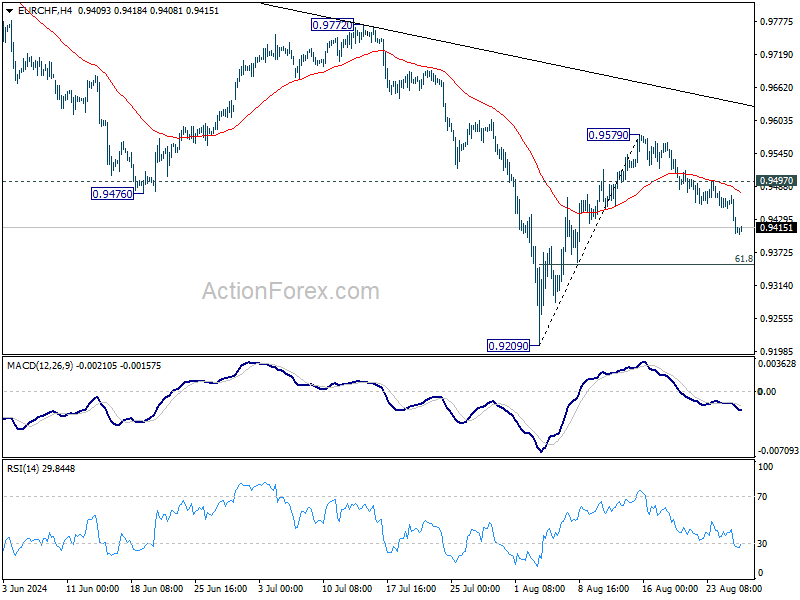
In the bigger picture, medium term corrective pattern from 0.9407 (2022 low) might have completed with three waves to 0.9928. Decisive break of 0.9252 (2023 low) will confirm long term down trend resumption. Next target will be 61.8% projection of 1.1149 to 0.9407 from 0.9928 at 0.8851. For now, outlook will stay bearish as long as 0.9928 resistance holds, even in case of strong rebound.
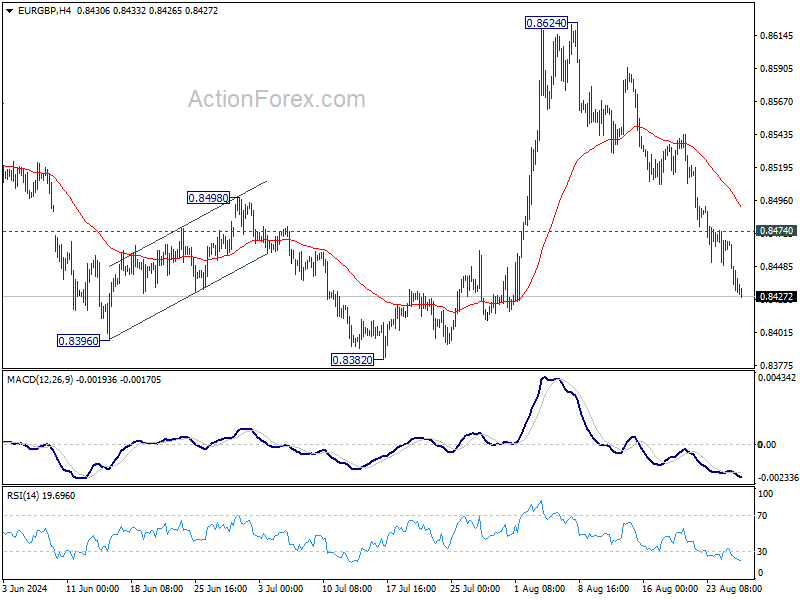
EUR/GBP Daily Outlook
Daily Pivots: (S1) 0.8421; (P) 0.8444; (R1) 0.8457; More....
EUR/GBP's fall from 0.8624 is still in progress, and intraday bias stays on the downside for retesting 0.8382 low. Strong support could be seen from there to bring rebound on first attempt. Above 0.8474 minor resistance will turn intraday bias neutral first. But risk will stay on the downside as long as 55 D EMA (now at 0.8492) holds. Firm break of 0.8382 will confirm larger down trend resumption.
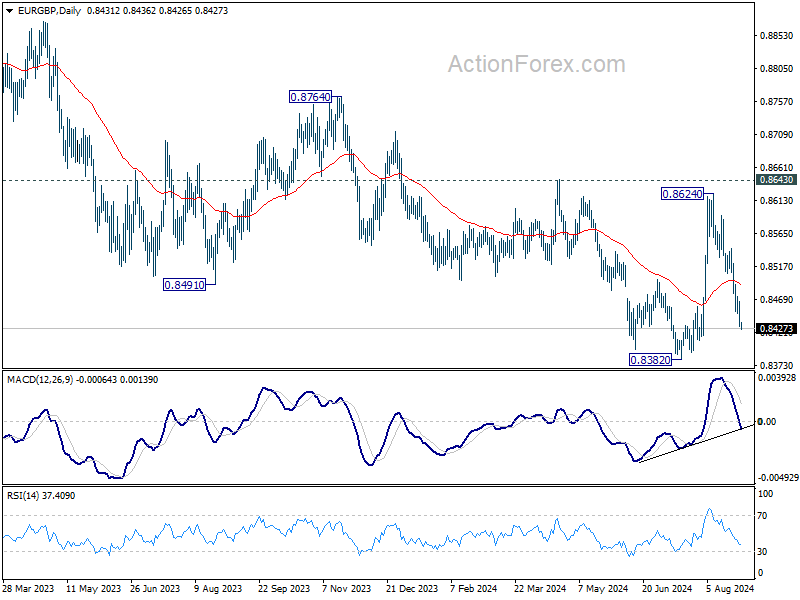
In the bigger picture, while the rebound from 0.8382 is strong, there is no confirmation of trend reversal yet. As long as 0.8643 resistance holds, down trend from 0.9267 could still resume through 0.8382 at a later stage towards 0.8201 (2022 low). However, firm break of 0.8643 will indicate that such down trend has completed, and turn outlook bullish for 0.8764 resistance next.
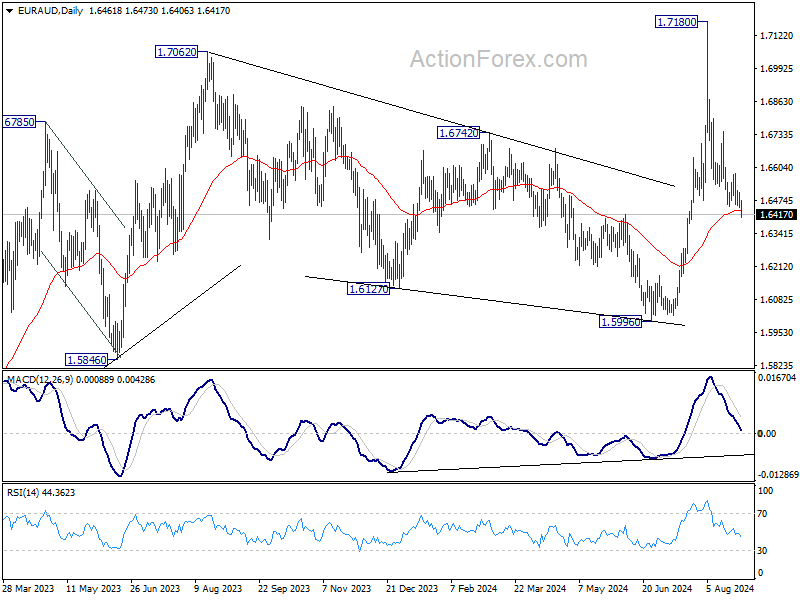
EUR/AUD Daily Outlook
Daily Pivots: (S1) 1.6440; (P) 1.6473; (R1) 1.6499; More...
Intraday bias in EUR/AUD is back on the downside as fall from 1.7180 resumes today. Sustained trading below 55 D EMA (now at 1.6435) will argue that rise from 1.5996 has completed at 1.7180. Deeper fall would then be seen back to this support. ON the upside, though, above 1.6580 resistance will turn bias back to the upside for stronger rebound.
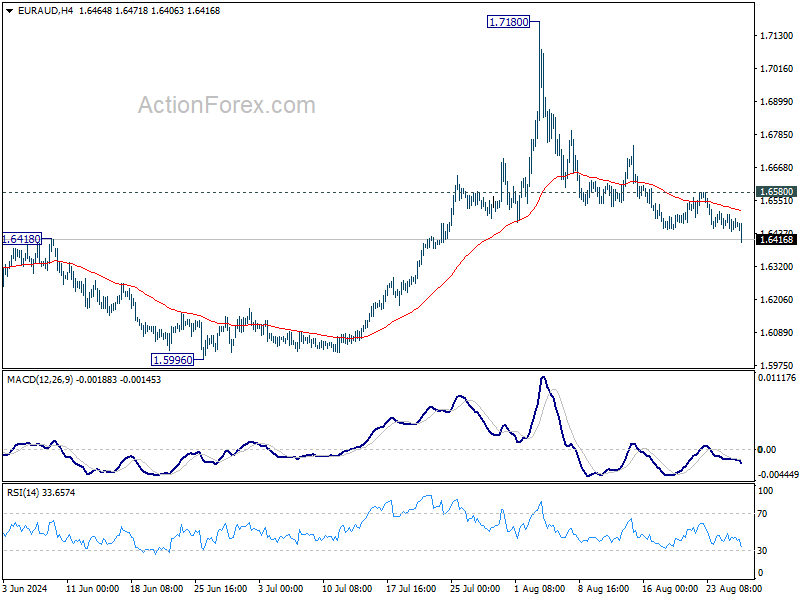
In the bigger picture, corrective fall from 1.7062 medium term top should have completed at 1.5996. Larger up trend from 1.4281 (2022 low) is resuming. Next target is 61.8% projection of 1.4281 to 1.7062 from 1.5996 at 1.7715. However, sustained break of 55 D EMA will dampen this bullish view and extend medium term range trading.