Sample Category Title
EUR/AUD Daily Outlook
Daily Pivots: (S1) 1.6453; (P) 1.6485; (R1) 1.6514; More...
Intraday bias in EUR/AUD remains neutral and outlook is unchanged. On the downside, sustained trading below 55 D EMA (now at 1.6435) will argue that rise from 1.5996 has completed at 1.7180 Deeper fall would then be seen back to this support. Nevertheless, strong rebound from current levels, followed by break of 1.6580 resistance, will argue that pullback from 1.7180 has completed already. Intraday bias will then be back on the upside for stronger rebound.
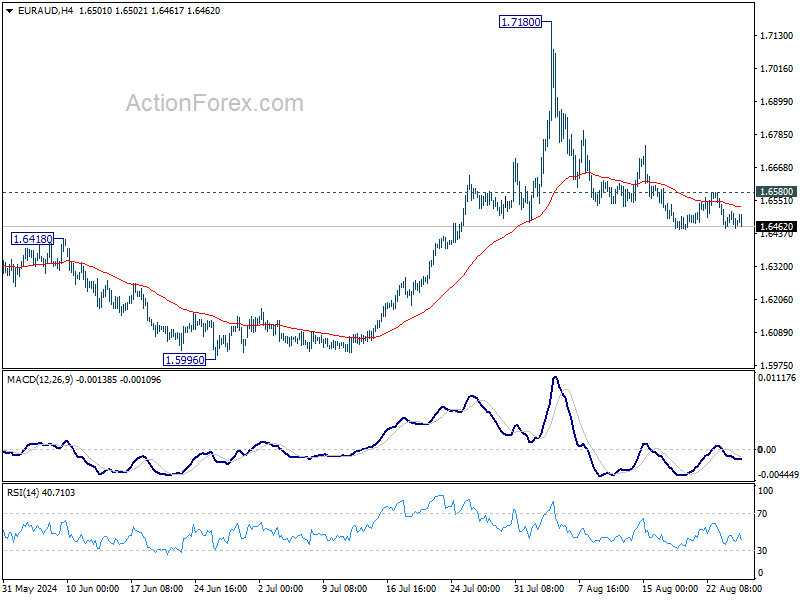
In the bigger picture, corrective fall from 1.7062 medium term top should have completed at 1.5996. Larger up trend from 1.4281 (2022 low) is resuming. Next target is 61.8% projection of 1.4281 to 1.7062 from 1.5996 at 1.7715. However, sustained break of 55 D EMA will dampen this bullish view and extend medium term range trading.
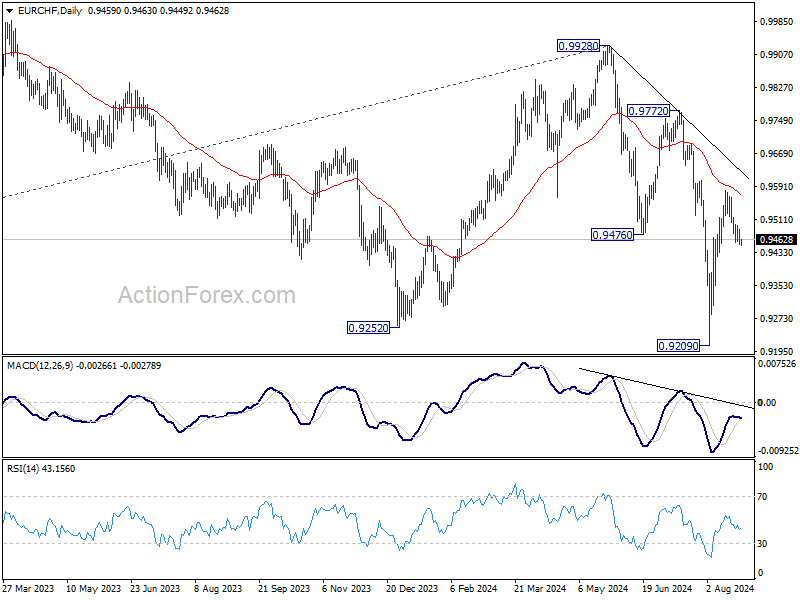
EUR/CHF Daily Outlook
Daily Pivots: (S1) 0.9442; (P) 0.9467; (R1) 0.9482; More....
Intraday bias in EUR/CHF stays neutral and outlook is unchanged. On the upside, sustained break of 55 D EMA (now at 0.9569) will pave the way back to 0.9972/0.9928 resistance zone. However, decisive break of 0.9448 will suggest rejection by 55 D EMA, and turn bias back to the downside for 0.9209 low.
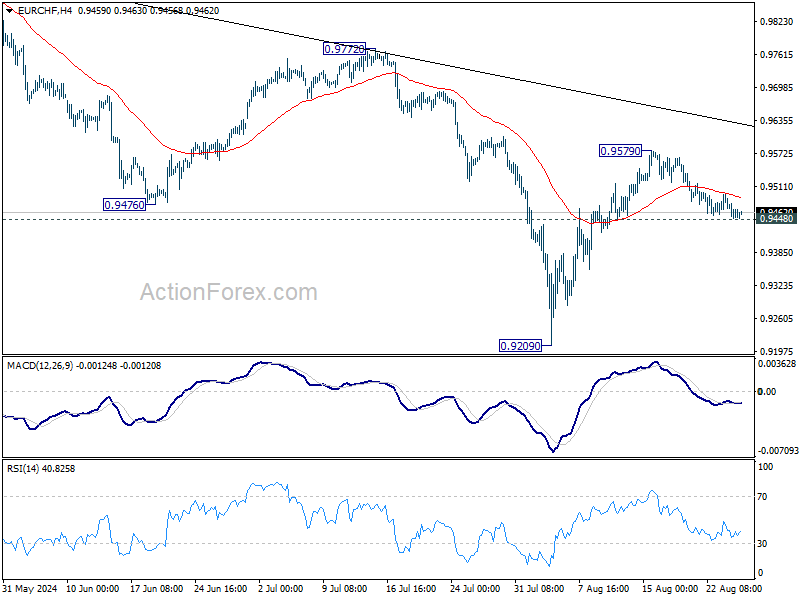
In the bigger picture, medium term corrective pattern from 0.9407 (2022 low) might have completed with three waves to 0.9928. Decisive break of 0.9252 (2023 low) will confirm long term down trend resumption. Next target will be 61.8% projection of 1.1149 to 0.9407 from 0.9928 at 0.8851. For now, outlook will stay bearish as long as 0.9928 resistance holds, even in case of strong rebound.
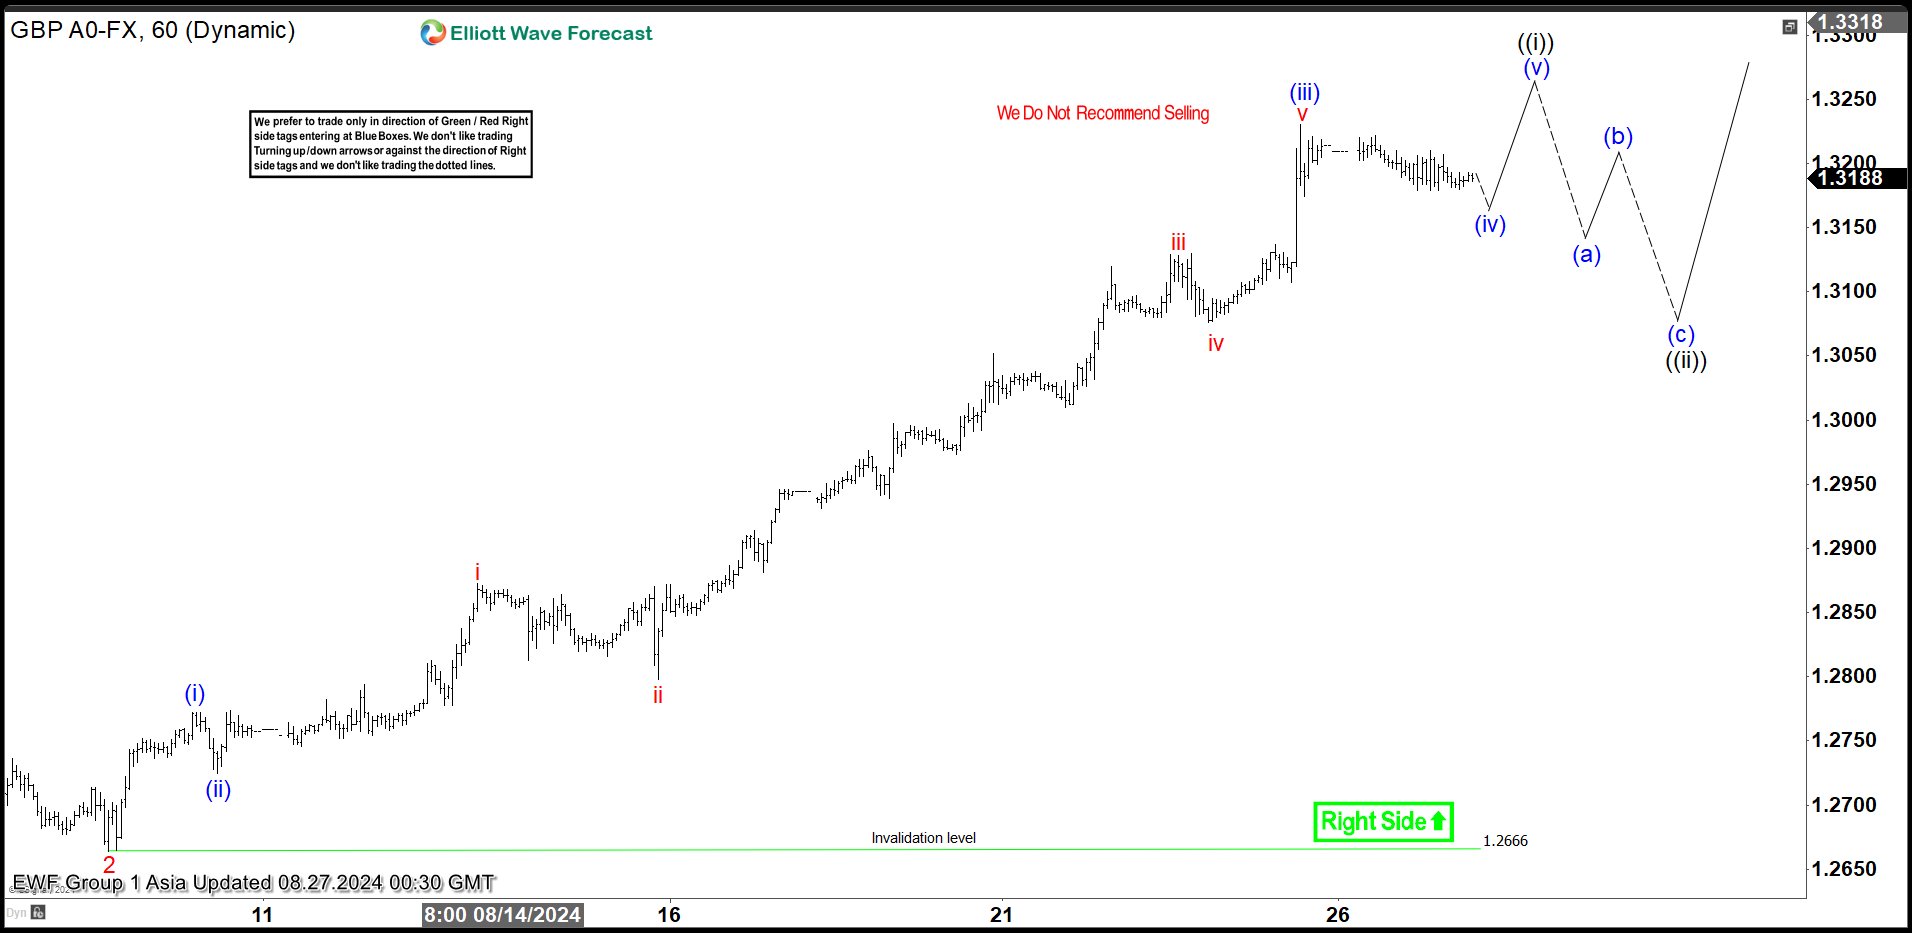
Elliott Wave Intraday Shows Bullish Sequence in GBPUSD
GBPUSD recently broke above previous peak on 7.14.2023 high at 1.3143 and shows a higher high bullish sequence from 9.26.2022 low. This leaves no doubt about the right side and direction of the pair which is higher. Near term, rally from 4.22.2024 low is ongoing as a 5 waves impulse Elliott Wave structure. Up from 4.22.2024 low, wave 1 ended at 1.3045 and pullback in wave 2 ended at 1.266. Pair has turned higher and broken above wave 1 suggesting wave 3 is in progress.
Up from wave 2, wave (i) ended at 1.277 and dips in wave (ii) ended at 1.272. Pair extended higher again from there. Up from wave (ii), wave i ended at 1.287 and pullback in wave ii ended at 1.2798. Pair extended higher in wave iii towards 1.313 and wave iv pullback ended at 1.307. Final leg wave v ended at 1.323 which completed wave (iii). Expect pair to end wave (iv) and rally 1 more leg to end wave (v) which should complete wave ((i)). Then it should pullback in wave ((ii)) to correct cycle from 8.8.2024 low in 3, 7, 11 swing before the rally resumes. Near term, as far as pivot at 1.266 low stays intact, expect dips to find support in 3, 7, 11 swing for further upside.
GBPUSD 60 Minutes Elliott Wave Chart
GBPUSD Elliott Wave Video
https://www.youtube.com/watch?v=ot68QeGDPvo
EUR/USD Rally Seems Unstoppable, Can It Continue?
Key Highlights
- EUR/USD rallied above the 1.1050 and 1.1120 resistance levels.
- A major bullish trend line is forming with support at 1.1120 on the 4-hour chart.
- Oil prices started a steady increase above the $76.00 resistance.
- GBP/USD surpassed the 1.3050 and 1.3080 resistance levels.
EUR/USD Technical Analysis
The Euro remained strong and climbed above the 1.1050 resistance against the US Dollar. EUR/USD bulls took control and pushed the pair above the 1.1120 pivot level.
Looking at the 4-hour chart, the pair settled above the 1.1100 level, the 100 simple moving average (red, 4-hour), and the 200 simple moving average (green, 4-hour). It even surpassed the 1.1150 level and tested 1.1200.
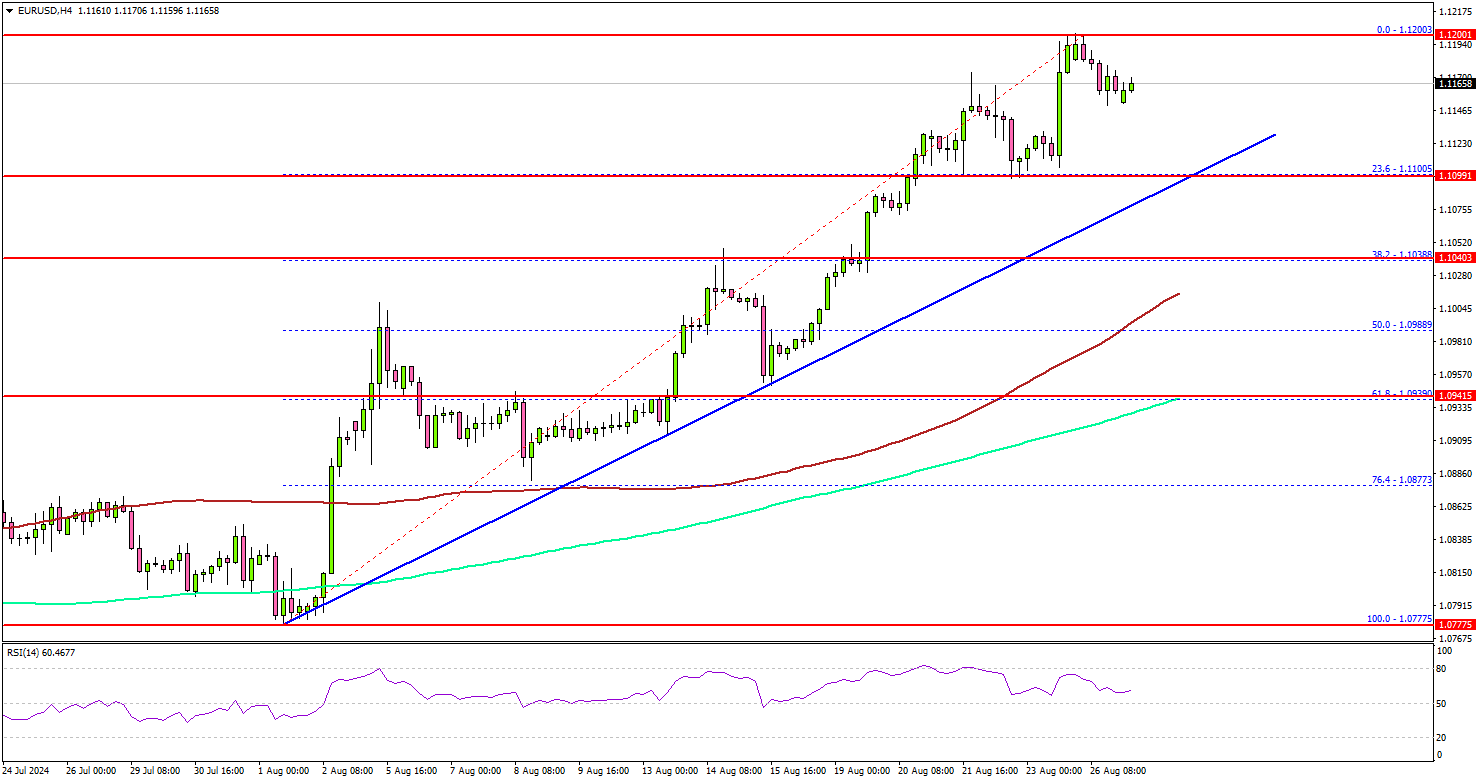
The pair is now consolidating gains below 1.1200. Immediate support is near the 1.1120 level or the 23.6% Fib retracement of the upward move from the 1.0775 swing low to the 1.1200 high.
There is also a major bullish trend line forming with support at 1.1120 on the same chart. The next major support sits near the 1.1040 level. A downside break below the 1.1040 level could set the pace for a larger decline.
The next major support is near the 1.0980 level or the 100 simple moving average (red, 4-hour). It is close to the 50% Fib retracement of the upward move from the 1.0775 swing low to the 1.1200 high. Any more losses might send the pair toward the 1.0920 support level.
On the upside, the pair could face resistance near the 1.1185 level. The first key resistance sits near the 1.1200 level. A clear move above the 1.1200 level could set the pace for a move toward the 1.1250 level.
Looking at GBP/USD, the pair rallied above the 1.3000 level and now seems to be consolidating gains for more upsides.
Economic Releases
- US Housing Price Index for June 2024 (MoM) - Forecast +0.2%, versus 0% previous.
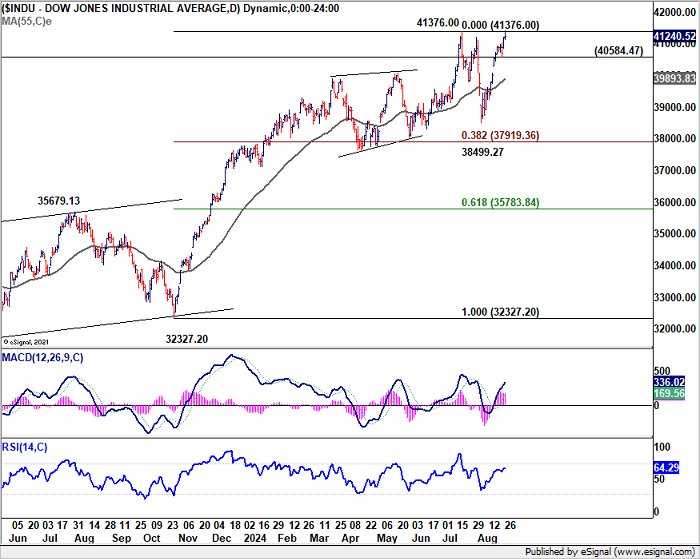
DOW hits new record, but Nvidia’s earnings could be the decider
DOW managed to break into new intraday record overnight before pulling back slightly, but it was enough to secure a fresh record close. The excitement around the index's performance is palpable, yet the overall market sentiment might hinge on Nvidia's upcoming earnings report on Wednesday. Investors are keen to see the second-quarter results to assess the ongoing strength of the AI trade, which has been a significant driver of market gains.
Technically, doubts persist regarding the Dow's ability to sustain its record-breaking momentum. Firm break below 40584.47 support would indicate that a short term top was formed, and set up deeper pull back to 55 D EMA (now at 39893.83), or around 40k psychological level, before DOW decides on its next move.
Fed’s Daly sees regular, normal cadence as path for rate cuts
San Francisco Fed President Mary Daly said in a Bloomberg TV interview that "the time is upon us" to cut interest rates, strongly suggesting that a rate reduction in September is highly likely.
Daly expressed concerns about maintaining "highly restrictive into a slowing economy", and stated that it is "hard to imagine" not easing rates soon.
Daly outlined her most probable outlook, which involves inflation gradually slowing and the labor market continuing to add jobs at a "steady, sustainable" pace. If this scenario holds, she noted, adjusting policy at a "regular, normal cadence" would be reasonable.
However, Daly also indicated that if the labor market shows any signs of deterioration or weakness, "being more aggressive" in policy adjustments would be appropriate to avoid further economic strain.
Gold Continuing To Find Support Into The Pullbacks
In this technical blog, we will look at the past performance of the 1-hour Elliott Wave Charts of the Gold. The rally from the 25 July 2024 low showed a higher high sequence & provided a short-term extreme trading opportunity. In this case, the pullback managed to reach the equal legs area & provided a perfect reaction higher. So, we advised members not to sell Gold but to buy the equal legs area for a minimum reaction higher to happen. We will explain the structure & forecast below:
Gold 1-Hour Elliott Wave Chart From 8.22.2024
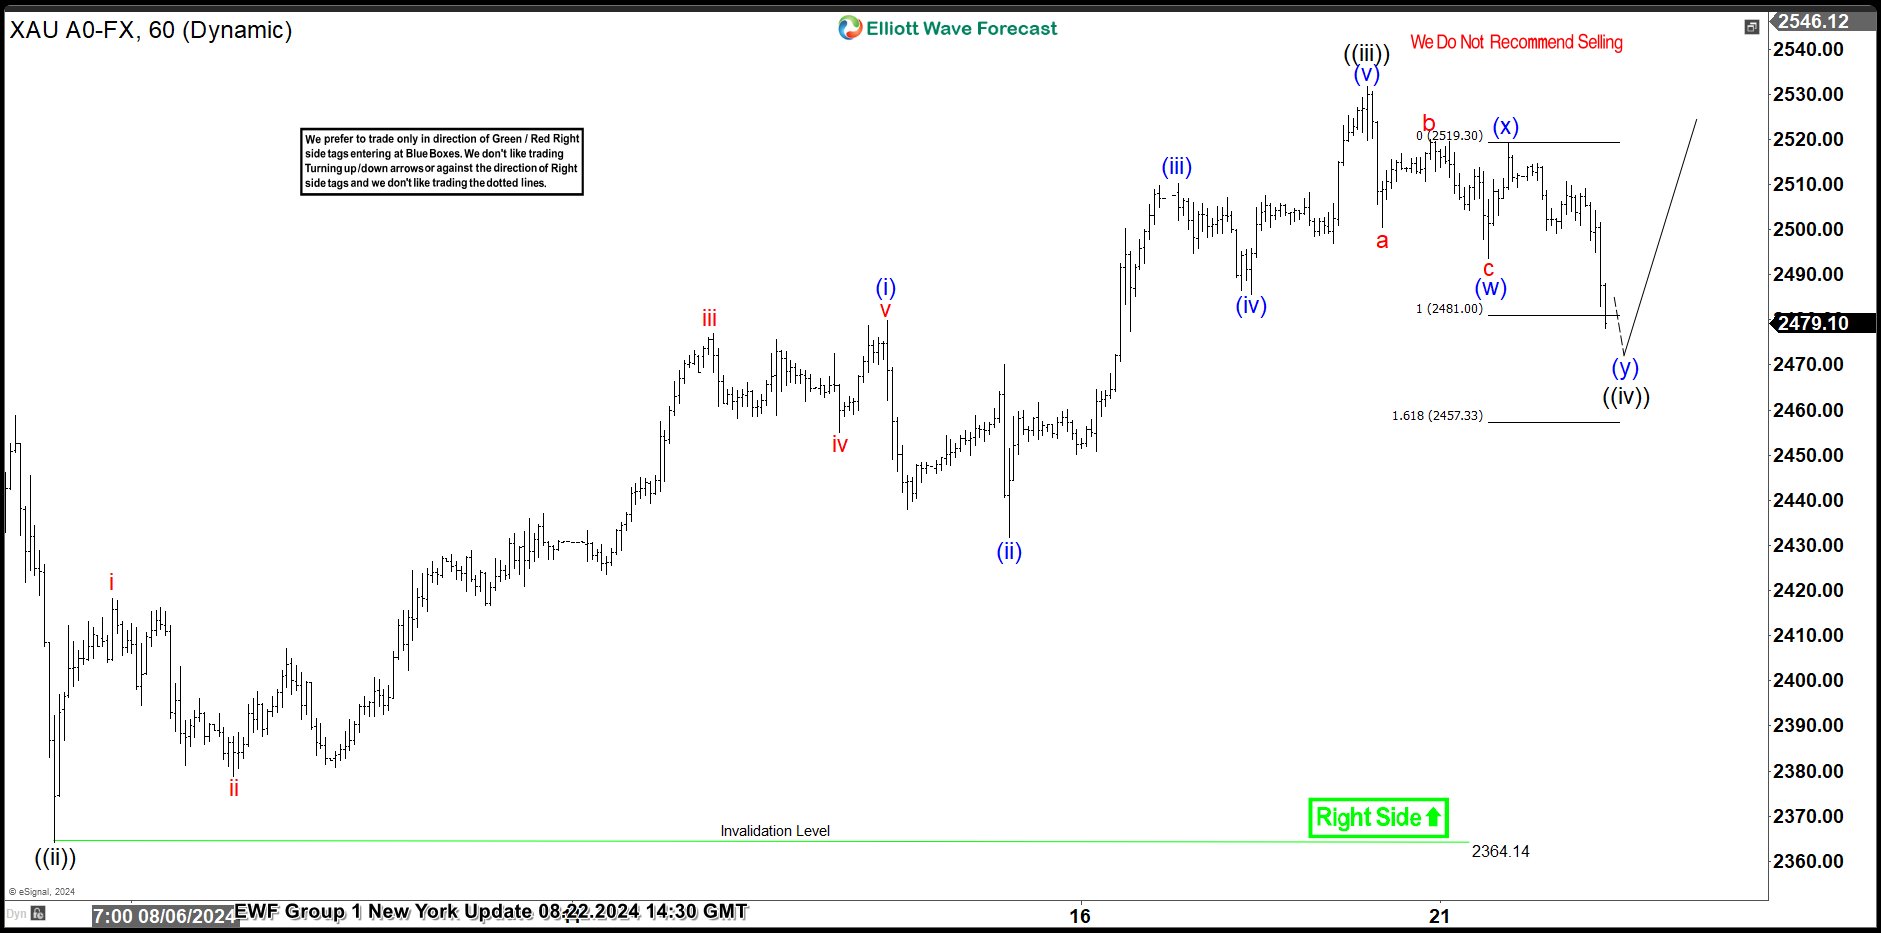
Here’s the 1-hour Elliott wave Chart from the 08/22/2024 NY update. In which, the rally to $2531.67 high ended wave ((iii)) & made a pullback in wave ((iv)). The internals of that pullback unfolded as Elliott wave double three structure where wave (w) ended at $2493.70 low. Then a short-term bounce to $2519.11 high-ended wave (x) & started the next leg lower in wave (y) towards $2481- $2457 equal legs area. From there, buyers were expected to appear looking for new highs ideally or for a 3-wave bounce minimum.
Gold Latest 1-Hour Elliott Wave Chart From 8.26.2024
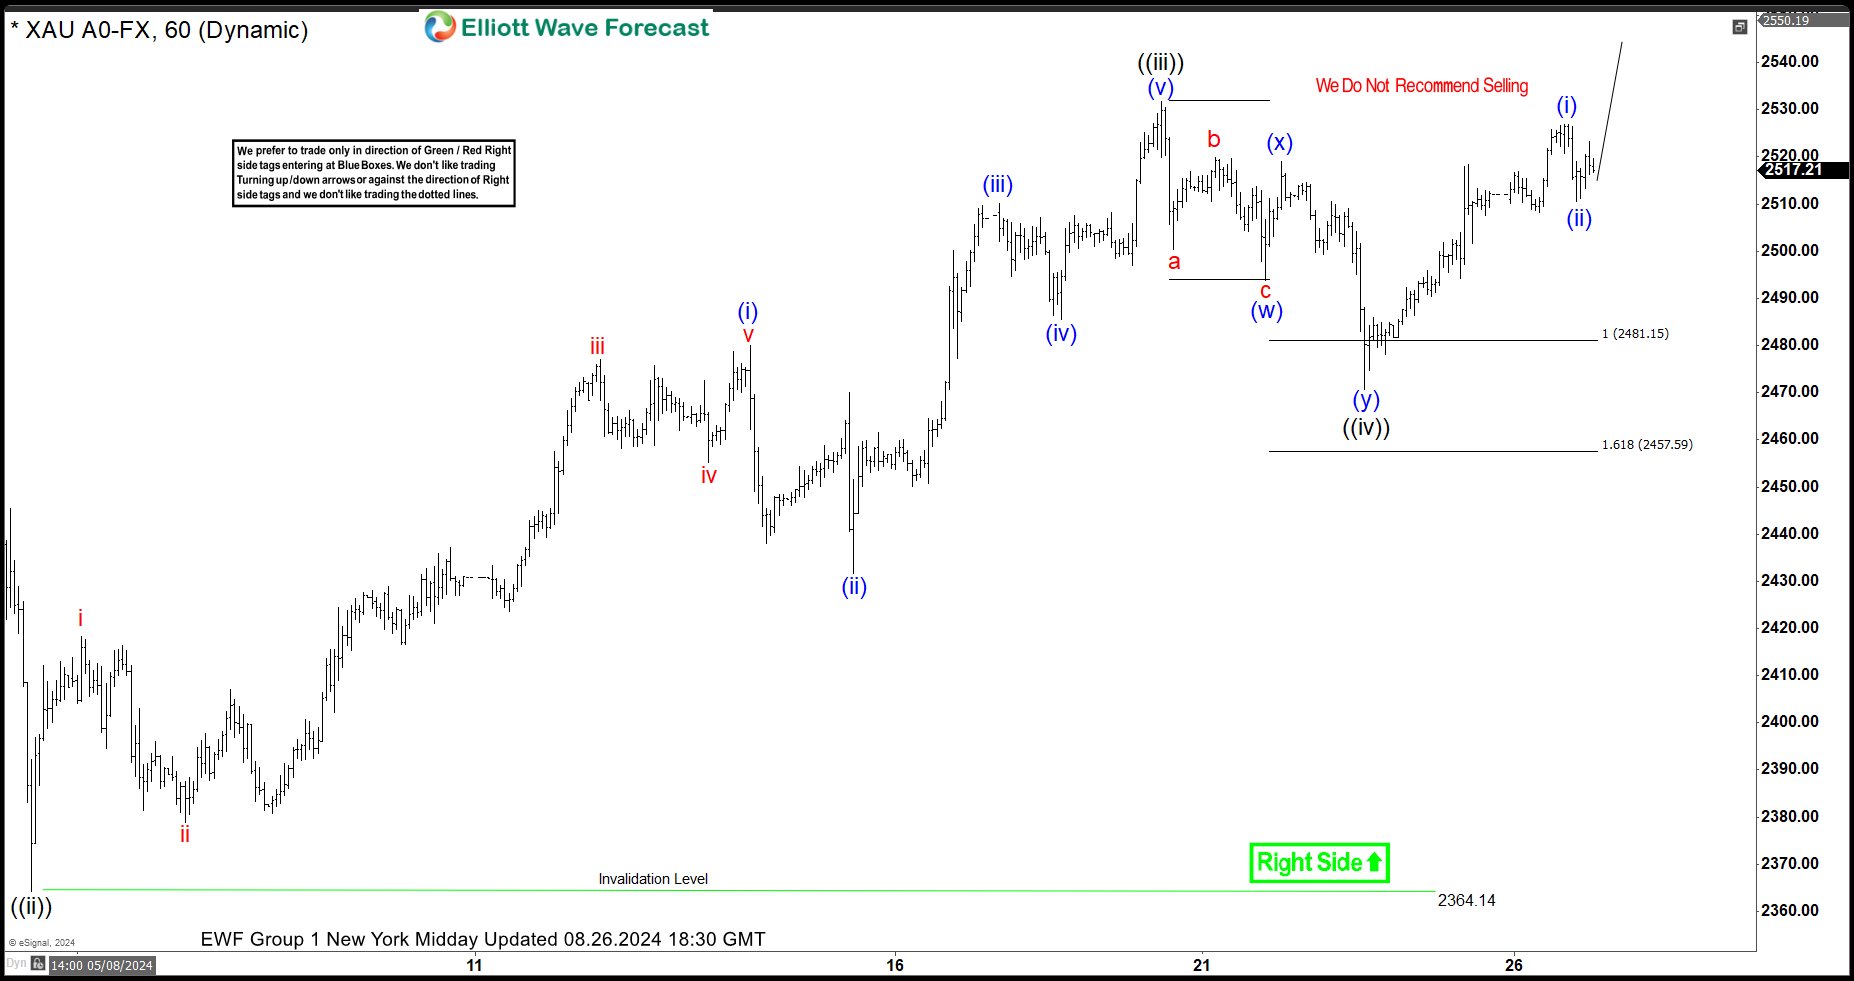
Above is the Latest 1-hour Elliott Wave Chart from the 8.26.2024 NY Midday update. In which the metal is showing a perfect reaction higher taking place from the equal legs area. Right after ending the correction. Allowed members to create a risk-free position shortly after taking a long position. But a break above $2531.67 high would still be needed to confirm the next leg higher minimum towards the $2546.49- 2569.93 area before the next pullback takes place.
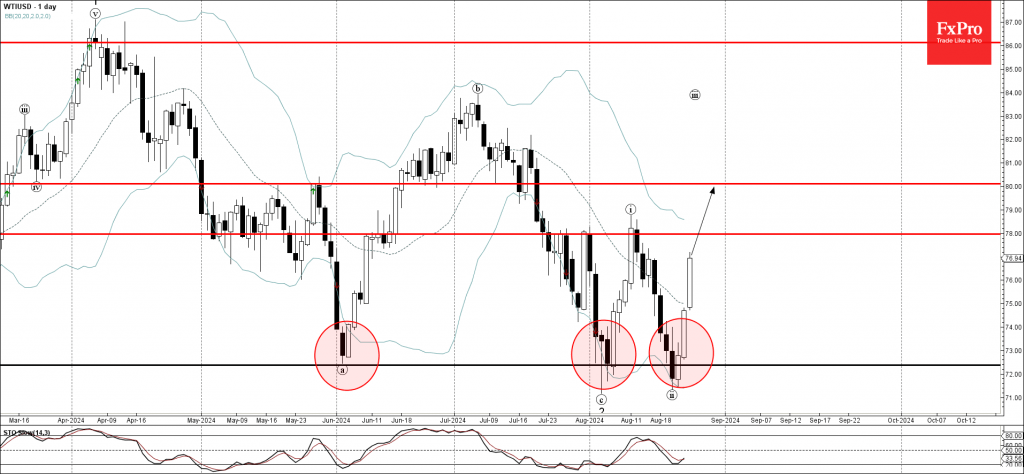
WTI Crude Oil Wave Analysis
- WTI crude oil reversed from a strong support level 72.40
- Likely to rise to resistance level 78.00
WTI crude oil recently reversed up from the strong support level 72.40 (which has been reversing the price from the start of June) coinciding with the lower daily Bollinger Band.
The upward reversal from the support level 72.40 created the daily candlesticks reversal pattern Piercing Line which started the active impulse wave iii.
Given the strength of the active impulse wave iii, WTI crude oil can then be expected to rise to the next resistance level 78.00 – followed by 80.00.
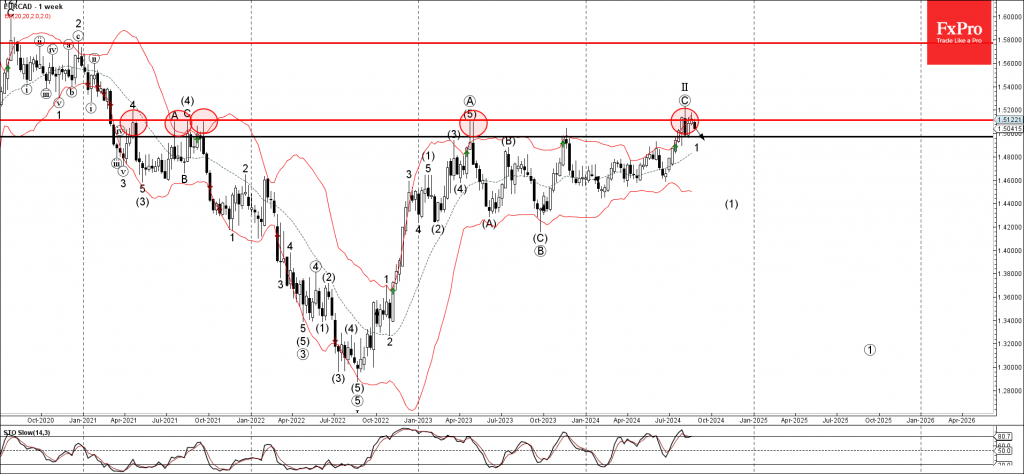
EURCAD Wave Analysis
- EURCAD reversed from the long-term resistance level 1.5115
- Likely to test support level 1.5000
EURCAD currency pair recently reversed down from the long-term resistance level 1.5115 (which has been reversing the price from the start of 2021) coinciding with the upper weekly Bollinger Band.
The downward reversal from the resistance level 1.5115 started the active impulse wave 1 of the higher impulse sequence (1).
Given the strength of the resistance level 1.5115 and the bullish Canadian Dollar sentiment, EURCAD currency pair can then be expected to fall to the next round support level 1.5000.