
Sample Category Title
XNG/USD: Natural Gas Price Hits 2.5-Week Low
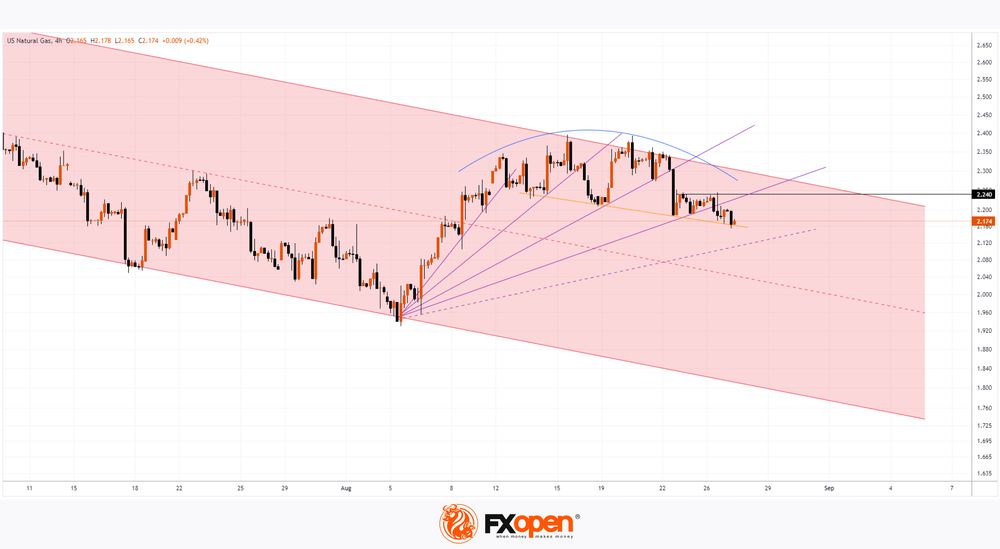
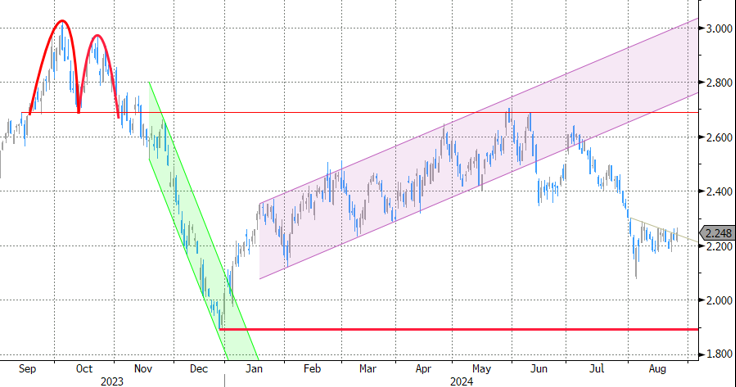
As shown on the XNG/USD chart, today, the price of natural gas fell below $2.16 for the first time since 8 August.
Bearish sentiment is being driven by the fact that: → This is the last week of summer. Gas consumption typically decreases in mid-September as the use of air conditioning declines; → Gas storage levels are abundant. According to Reuters, current stock levels exceed the seasonal average by 12%.
A technical analysis of the XNG/USD chart provides several arguments suggesting that bears hold the upper hand in the market:
→ Price action is forming a descending channel, shown in red. The upper boundary of the channel acted as resistance, with the price forming a bearish rounding reversal pattern (as indicated in blue).
→ After a large bearish candle on 22 August, the resistance level at $2.24 became more significant.
→ Support lines, forming a fan shape, are being broken one by one, with increasingly shallow angles indicating weakening demand.
Nevertheless, bulls have an opportunity to turn the situation around by using support from the trendline (shown in yellow) at least in the short term.
However, in the longer term, if the supply-demand balance remains unchanged, there is reason to believe that the price of natural gas on the XNG/USD chart may continue its downward trend within the red channel.
Start trading commodity CFDs with tight spreads. Open your trading account now or learn more about trading commodity CFDs with FXOpen.
This article represents the opinion of the Companies operating under the FXOpen brand only. It is not to be construed as an offer, solicitation, or recommendation with respect to products and services provided by the Companies operating under the FXOpen brand, nor is it to be considered financial advice.
Gold’s Price Prospects Amid Middle East Tensions and Fed Policies
Gold prices have recently dipped to 2507 USD per troy ounce but are poised for a potential rebound due to increased demand for safe-haven assets amid escalating conflict in the Middle East. Additionally, anticipations of monetary policy easing by the US Federal Reserve in September further bolster gold's outlook.
Monetary Policy and Market Dynamics
Last week, Fed Chair Jerome Powell indicated a likely rate cut as US inflation approaches the target of 2%, with a particular focus on the softening employment market impacted by prolonged high interest rates. Mary Daly of the FRB San Francisco echoed Powell's sentiment, advocating for policy adjustments which support a favourable environment for gold as lower interest rates typically decrease the opportunity cost of holding non-yielding assets like gold.
Geopolitical Influences
The situation in the Middle East, particularly between Israel and the Gaza Strip, remains volatile. Despite initial hopes for a peace agreement facilitated by US diplomatic efforts, the conflict has reignited, driving up demand for gold. Such geopolitical uncertainties typically enhance gold's appeal as a protective investment during times of crisis.
Technical Analysis of XAU/USD
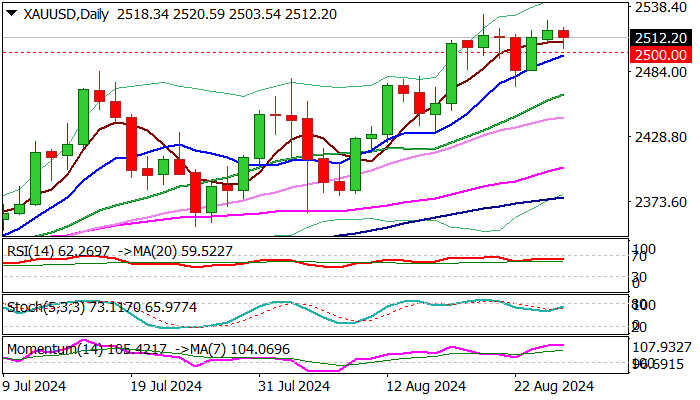
Gold exhibited a downward impulse to 2470.77 USD, followed by a correction to 2526.00 USD. It is forming another downward wave targeting 2480.20 USD, expecting to break this level and potentially move towards 2435.55 USD. The MACD indicator, with its signal line positioned above zero but pointing downward, supports this bearish scenario.
After completing a corrective structure to 2526.00 USD, gold is expected to form a downward wave to 2500.00 USD. Upon reaching this target, a brief rise to 2513.33 USD might occur before continuing downward to 2480.20 USD. This pattern suggests only half of the anticipated downward trend. The Stochastic oscillator, near 50 and expected to rise to 80, indicates potential short-term gains before resuming the downward movement.
Summary
The interplay of easing monetary policies by the Fed and increasing geopolitical risks in the Middle East creates a complex but potentially favourable backdrop for gold prices. Investors might see gold as an attractive investment, a safe-haven asset and a hedge against potential currency devaluation and inflation uncertainties. These factors and technical indicators suggest a volatile but upward potential trajectory for gold prices in the near term.
XAU/USD Outlook: Extended Consolidation Likely to Precede Fresh Acceleration Higher
Gold edges lower on Tuesday morning after rally in past two days reaching levels ticks away from new record high ($2531).
Traders show hesitation, keeping the price in extended consolidation, but demand for yellow metal remains strong, mainly due to weaker dollar on Fed rate cut signals and growing geopolitical tensions in the Middle East.
Although September rate cut has been confirmed, the size of cut is still unclear with 70% expectations for 25 basis points cut and 30% for 50 basis points, which keeps traders at a slower pace and awaiting next economic data from the US to get more details.
Immediate bias to remain firmly with bulls while the price stays above $2500 support zone (psychological / rising 10 DMA).
Deeper pullback below $2500 should be contained above $2470/64 (Aug 22 higher low / ascending 20DMA) to keep bulls intact and offer better levels to re-join bullish market.
US Aug Consumer Confidence will be in focus as a top economic release from the US today.
Res: 2520; 2526; 2531; 2547.
Sup: 2500; 2494; 2470; 2464.
Crypto Market Has Cooled Slightly
Market picture
The crypto market failed to grow steadily, with total capitalisation falling 1.6% to $2.21 trillion. This is a slight correction following the unimpressive performance of the equity market. The Sentiment Index fell back into neutral territory, losing 7 points on the day to 48.
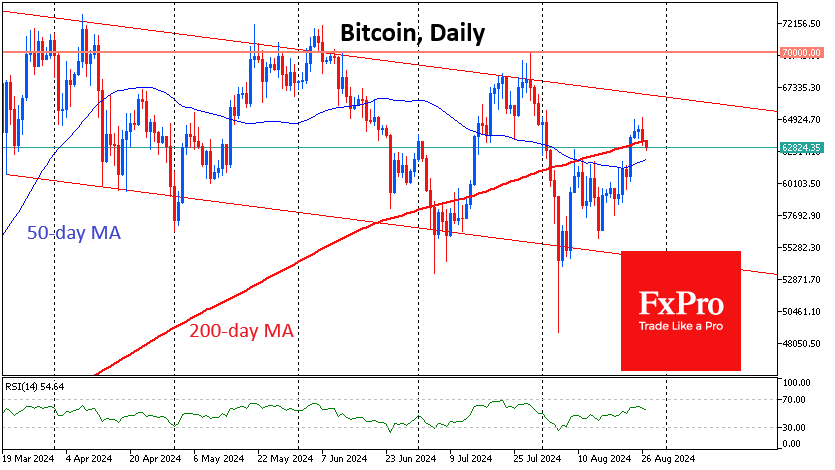
Bitcoin fell below $63K, losing 1.4% in 24 hours and dropping below its 200-day moving average. It’s too early to tell if this line has become resistance.
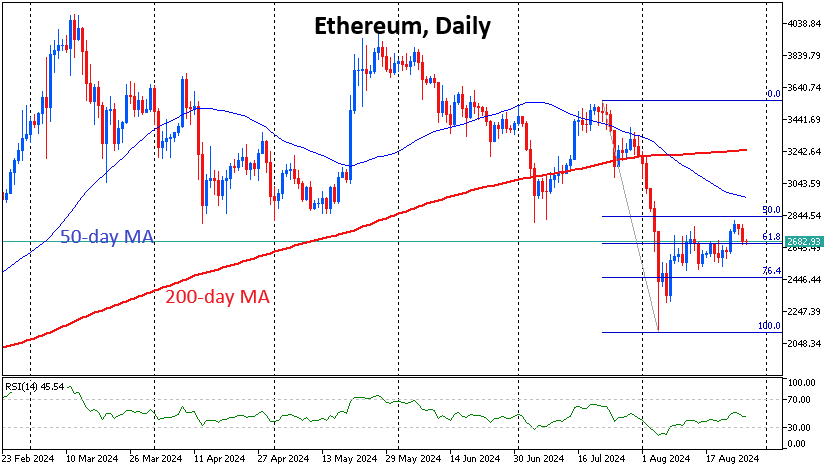
Ethereum fell 1.7% to $2690, remaining in the lower half of the range from the July highs to the August lows. The $2800 area served as strong support on the dips from April to July this year and now provides important resistance.
Toncoin overnight approached the $5 level, which was the turning point for the early August and May sell-offs. Although impressive bounces have accompanied the decline, the high volume means that we must remain negative on the coin’s near-term prospects.
News background
According to CoinShares, investment in crypto funds rose by $533 million last week, the largest inflow in five weeks and the third consecutive week of growth. Meanwhile, new Ethereum ETF issuers continue to see inflows, with $3.1 billion in new money for the month, partially offset by a $2.5 billion outflow from Grayscale Trust.
A federal court in the Northern District of California rejected the SEC’s request to recognise digital assets traded on the US crypto exchange Kraken as investment contracts. This is a significant victory for Kraken and cryptocurrency users. The exchange’s general counsel said the SEC will no longer be able to rely on its theory that cryptocurrencies are securities.
The combined market value of stablecoins has reached a new all-time high of $168 billion, a figure that has risen for 11 consecutive months. Dynamo DeFi interprets the trend as a sign of an influx of ‘new money into cryptocurrency’.
Tether has helped 145 law enforcement agencies in 40 jurisdictions recover more than $108.8m in USDT since its launch in 2014, the company said. The USDT issuer has also ‘voluntarily’ blocked more than 1,900 wallets linked to illegal activity.
Luke Dashjr said the decentralised nature of the first cryptocurrency has come under threat. Just two companies now control more than 55% of the BTC network’s global hash rate.
GBPUSD: Is the Next Downturn Approaching?
- GBPUSD’s bull run slows down near a familiar resistance area
- Some stability is likely; sellers need a close below 1.3188 to gain control
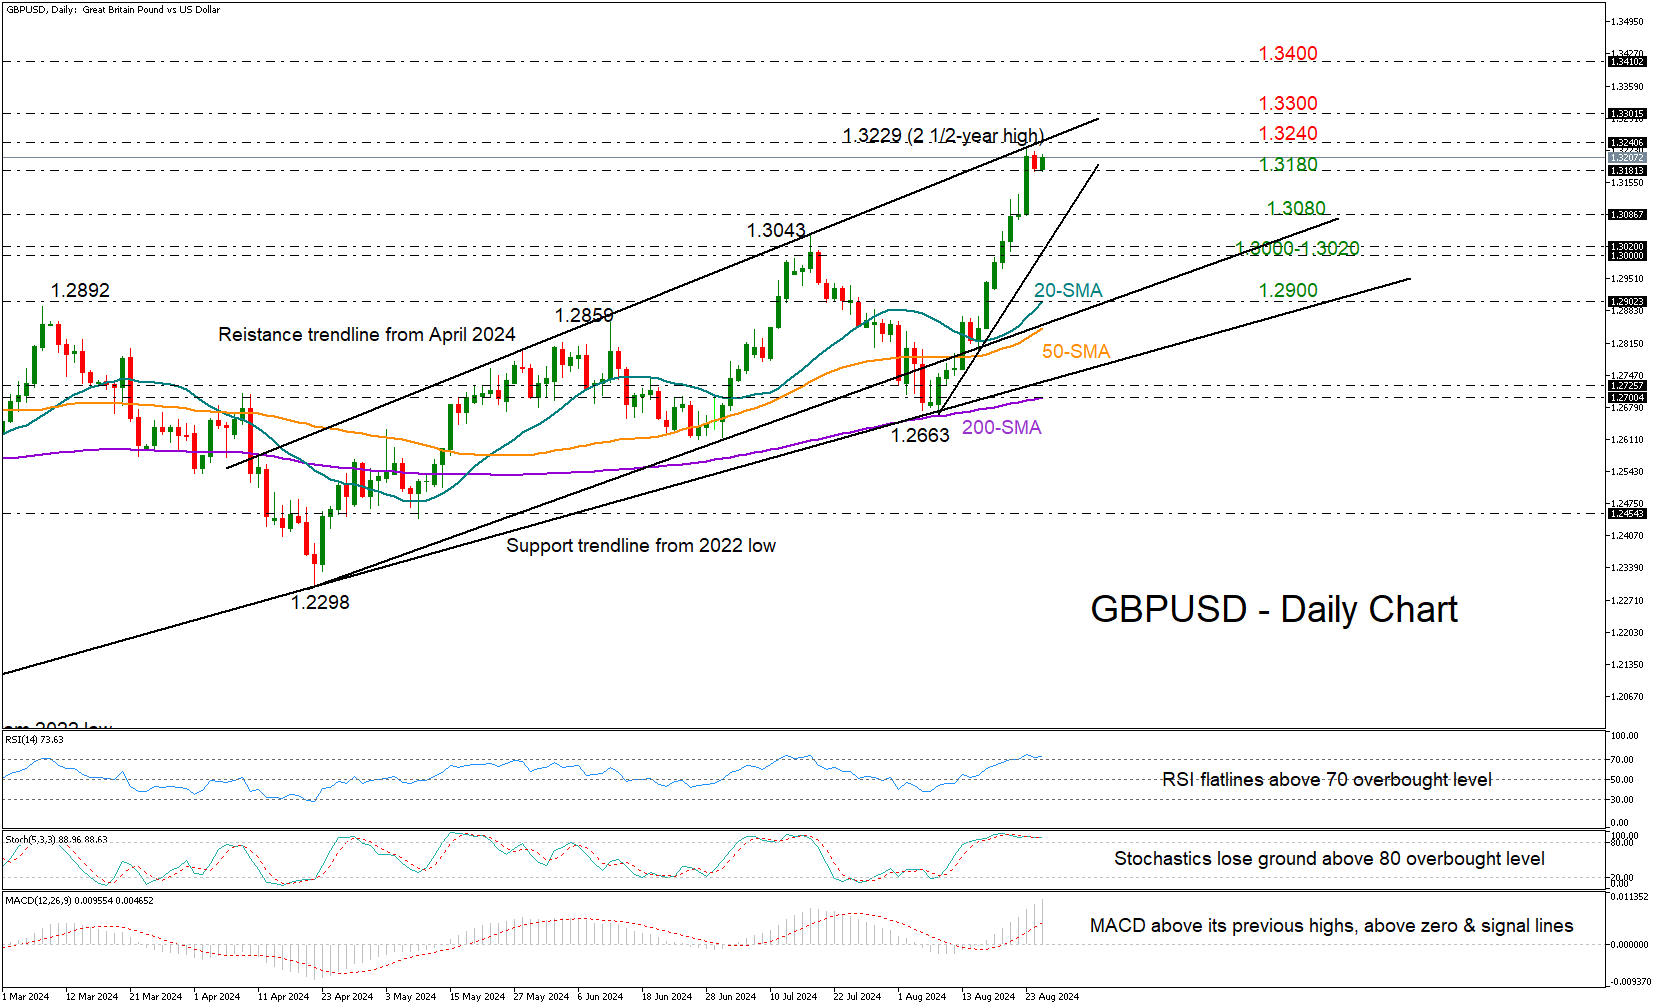
GBPUSD opened the week with marginal losses after its almost uninterrupted two-week rally was rejected near the key resistance trendline at 1.3229 for the third time.
While the bulls are trying to make a comeback today, the RSI and Stochastic oscillator are both flatlining in the overbought zone, indicating a high risk of a downside correction.
Perhaps, a step below the 1.3180 area, which has been acting as support for the second consecutive day, could confirm additional losses towards the 1.3025-1.3085 zone. If the steep ascending trendline from August’s lows is broken along with the 1.3000 psychological mark too, it could lead to a rapid decline towards the 20- and 50-day simple moving averages (SMA) found between 1.2890-1.2900.
Regarding resistance levels, the ascending trendline from April will be closely watched near 1.3240. A move above it could reach the 1.3300 round level, while higher, the bulls will set their sights near the 1.3400 mark last seen in March 2022.
Overall, following its recent swift appreciation, GBPUSD could undergo profit-taking. However, as long as the pair continues its upward trend in the medium-term picture, investors won’t be concerned unless the price falls below 1.2700-1.2730.
EURJPY Develops Beneath 200-Day SMA
- EURJPY lost 12% from multi-year high
- Short-term bias skewed to the upside, but caution needed
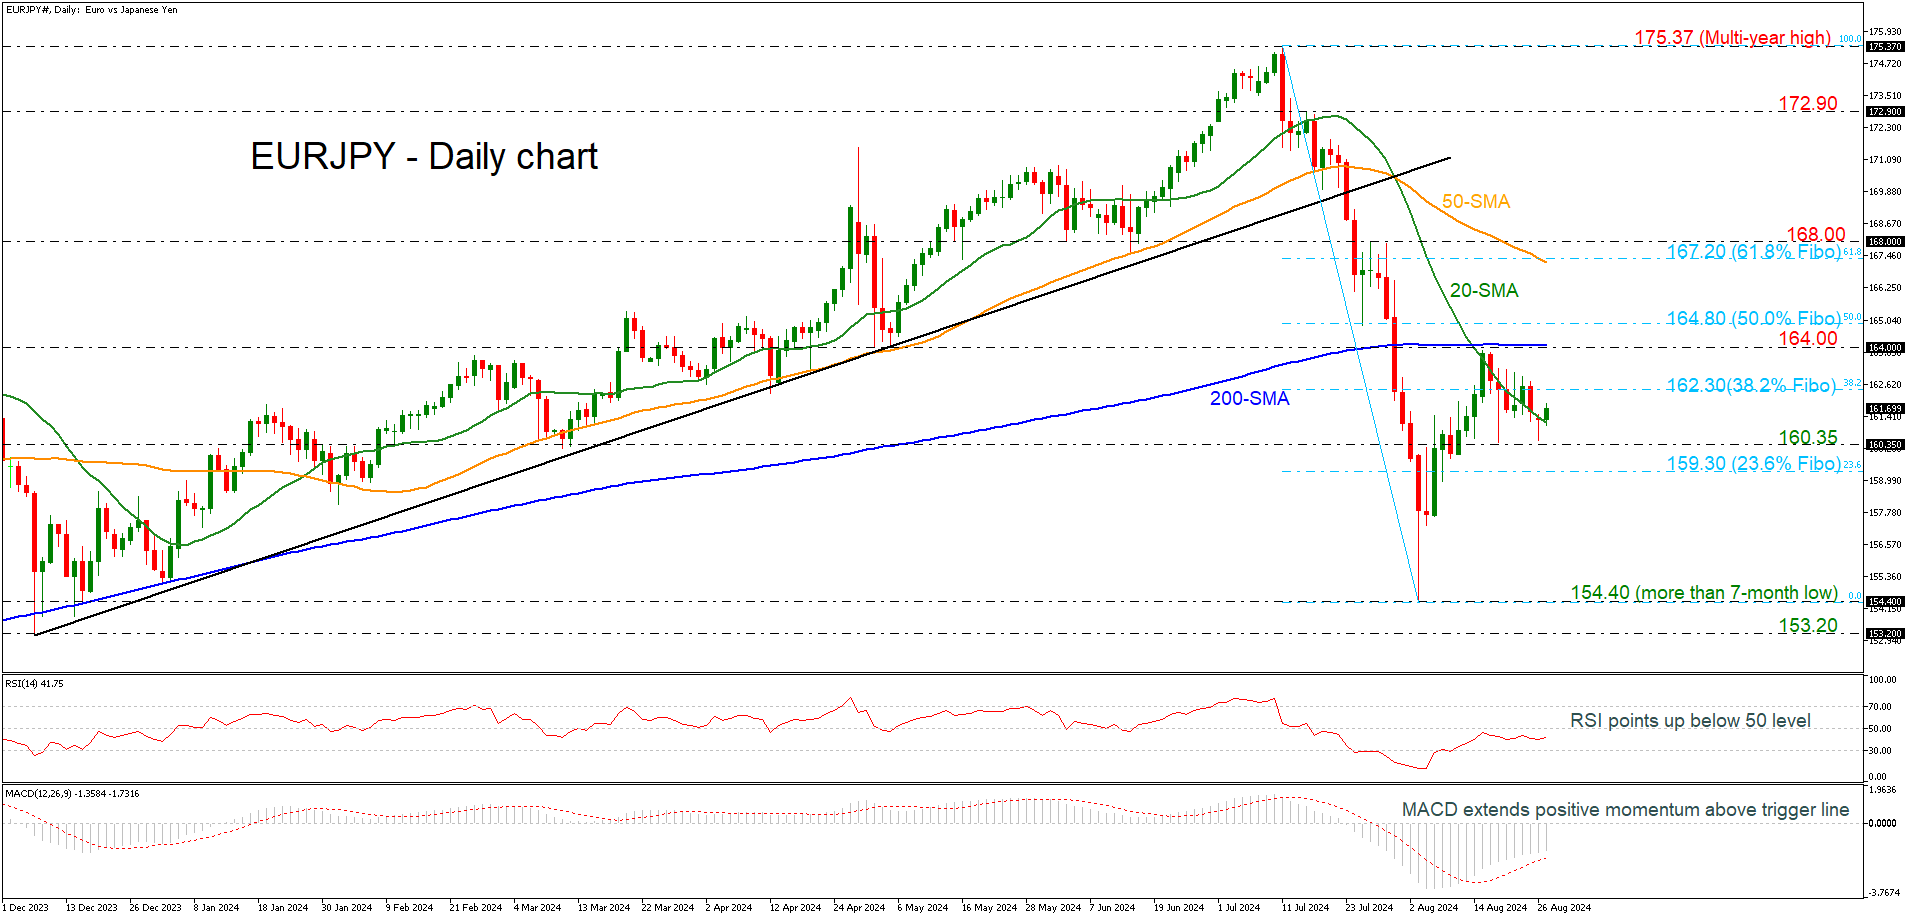
EURJPY remains under pressure, and risk is still on the downside as prices continue to drift lower after the failure attempt to climb beyond the 200-day simple moving average (SMA) at 164.00. In the bigger picture, EURJPY has lost around 12% from the multi-year high of 157.37 to the seven-month low of 154.40.
Prices rebounded off the 160.35 support level, but based on technical oscillators, momentum is still too weak to provide a sustained move higher. The RSI is sloping marginally up below the neutral threshold of 50, while the MACD is standing above its trigger line in negative territory.
Upside moves are likely to find immediate resistance at the 38.2% Fibonacci retracement level of the downward wave from 175.37 to 154.40 at 162.30. There is an important resistance zone between 164.00 and 164.80 (50.0% Fibonacci level). Rising above this area would help shift the focus to the upside towards the 50-day SMA, which overlaps with the 61.8% Fibonacci at 167.20.
To the downside, the latest bottom at 160.35 could be a key level for traders before hitting the 23.6% Fibonacci at 159.30. Steeper decreases could take the pair towards the more-than-seven-month low of 154.40.
In the short-term, the bearish phase remains in play, especially if EURJPY continues to trade below the 200-day SMA and the 61.8% Fibonacci of 167.20. In the bigger picture, the market is bullish as long as the 200-week SMA holds.
German GfK consumer sentiment drops to -22, pushing back prospects of recovery
Germany's GfK Consumer Sentiment for September took a sharper downturn than expected, falling from -18.6 to -22.0, below the anticipated -18.3.
August saw significant drops in key indicators: economic expectations plummeted from 9.8 to 2.0, income expectations nosedived from 19.7 to 3.5, and the willingness to buy dipped further from -8.4 to -10.9. Conversely, the willingness to save increased from 8.0 to 10.7, indicating a cautious approach to spending.
According to Rolf Buerkl, consumer expert at NIM, "Apparently, the euphoria of German consumers triggered by the European Football Championship was only a brief flare-up and faded after the end of the tournament."
He added that "negative news about job security is making consumers more pessimistic and a fast recovery in consumer sentiment seems unlikely."
The decline in sentiment is exacerbated by slightly rising unemployment rates, an increase in corporate insolvencies, and staff reduction plans at various companies in Germany. Buerkl concluded, "Hopes for a stable and sustainable economic recovery must therefore be further postponed."
Interest Rate Markets Looking for New Short-Term Equilibrium
Markets
Interest rate markets were looking for a new short-term equilibrium for the post-Jackson Hole era yesterday. Early in the session, yields tried to build on Friday’s decline as Fed Chair Powel officially rubberstamped the start of a genuine rate cut cycle in September while leaving all options open on the pace of easing. However, with already more than 100 bps of rate cuts discounted for the three remaining Fed meetings of this year, the lows (ex the August 5 spike) held. Unconvincing data were not able to push yields sustainably lower. German Ifo business confidence declined marginally (86.6 from 87.0), confirming last week’s poor PMI reading, but the damage could have been bigger. Headline US durable goods orders were strong (9.9%) but an upswing in Boeing orders masked a mediocre performance of core orders and shipments. In an interview with Bloomberg, San Francisco President Mary Daly repeated the Jackson Hole message from Fed Chair Powell. ‘The time to adjust policy is upon on us.’ Daly didn’t gave guidance of the pace of easing (25 bps or 50 bps). Still, she clearly indicated that the Fed wants to avoid restrictive policy to unnecessary slow growth/the labour market. In case of real labour market weakness, it would be appropriate to be more aggressive. Still the comments also were no game-changer for interest rate markets. At the end of the day, US yields even rose modestly between 2 bps (2-y) and 1.4 bps (30-y). A mild rise in inflation expectations due to higher oil prices (Brent oil jumping to $81+ p/b) probably was also in play. German yields added between 3.0 bps (5-y) and 1.3 bps (30-y). The dollar decline slowed (close DXY 100.85, EUR/USD 1.1161, USD/JPY 144.53) but intraday ‘gains’ were technically irrelevant. Equities ran into resistance as the S&P 500 came within reach of the all-time record (S&P -0.32%, Nasdaq -0.85%).
Asian markets this morning join yesterday’s momentum in the US with equities mostly showing modest declines (Japan being an exception). US yields are rising marginally. The dollar trades little changed (DXY 110.84, EUR/USD 1.1168). Later today, German GFK consumer confidence, US house price data and US consumer confidence (Conference Board) have intraday market moving potential but probably won’t force a break of key technical levels. Also keep an eye at a $69 bln 2-y sale of US Treasury notes after the recent sharp decline in yields. For now we expect technical support levels in yields to hold with next reality check to be provided by the key US early month data next week (ISM’s, payrolls). Expectations for a further easing of US/global financial conditions will probably keep the dollar in a sell-on-upticks pattern.
News & Views
UK shop prices were flat in M/M-terms but fell by 0.3% Y/Y in August (from +0.2% Y/Y in July) in their first Y/Y-decline since end 2021. Non-food prices dropped for a third month running (-0.1% M/M) with their Y/Y-price fall accelerating from 0.9% to 1.5%. Food prices rose by 0.2% M/M and 2% Y/Y. Fresh food price inflation eased from 1.4% Y/Y to 1% Y/Y. The British Retail Consortium commented that retailers discounted heavily (non-food) to shift their summer stock, particularly for fashion and household goods. This discounting followed a difficult summer of trading caused by poor weather and the continued cost of living crunch impacting many families. Looking ahead, the BRC warned for renewed inflationary pressures because of an uncertain outlook for commodity prices (impact climate change on harvests & rising geopolitical tensions).
French President Macron yesterday rejected the left-wing New Popular Front’s (winner of parliamentary election) candidate for new prime minister, Lucie Castets. “The institutional stability of our country requires us not to choose the NFP option”. Macron remains convinced that he can put together a coalition involving moderate politicians from center-left and center-right. PM Attal and his caretaker government remain in place for now with the clock is ticking with a 2025 budget vote scheduled in October.
Graphs
GE 10y yield
The ECB cut policy rates by 25 bps in June. Stubborn inflation (core, services) make follow-up moves less evident. Markets nevertheless price in two to three more cuts for 2024 as disappointing US and unconvincing EMU activity data rolled in, dragging the long end of the curve down. The move accelerated during the early August market meltdown.
US 10y yield
The Fed in its July meeting paved the way for a first cut in September. It turned attentive to risks to the both sides of its dual mandate as the economy is moving to a better in to balance. Markets tend to err in favour of a 50 bps lift-off. The pivot weakened the technical picture in US yields with another batch of weak eco data pushing the 10-yr sub 4%. Powell at Jackson Hole didn’t challenge markets’ positioning.
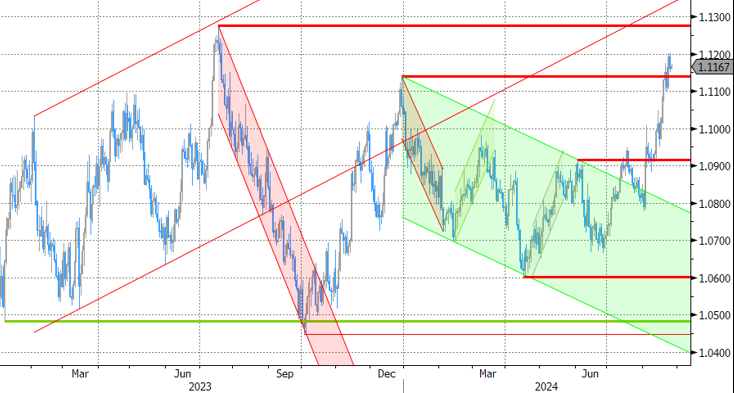
EUR/USD
EUR/USD moved above the 1.09 resistance area as the dollar lost interest rate support at stealth pace. US recession risks and bets on fast and large (50 bps) rate cuts trumped traditional safe haven flows into USD. EUR/USD 1 1.1276 (2023 top) serves as next technical reference.
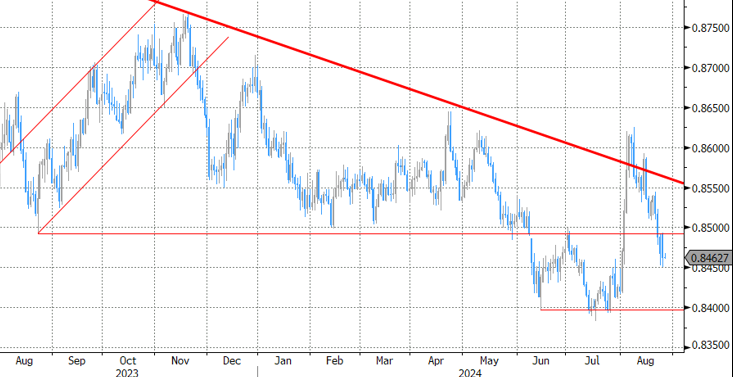
EUR/GBP
The BoE delivered a hawkish cut in August. Policy restrictiveness will be further unwound gradually on a pace determined by a broad range of data. The strategy similar to the ECB’s balances out EUR/GBP in a monetary perspective. Risk-off proved a more important driver of GBP recently, triggering a brief return from 0.84 towards 0.86.
Oil Price Rises on Libyan Supply Concerns
In focus today
From the US, Conference Board's consumer confidence index for August is due for release. The preliminary survey from the University of Michigan that was released earlier showed consumers turning increasingly optimistic about the future, but also more worried about the current economic situation.
We expect the Central Bank of Hungary to keep their policy rate unchanged later today, at 6.75%.
Economic and market news
What happened overnight
Yesterday, market sentiment was a slight risk-off in tech ahead of the much-awaited Nvidia earnings on Wednesday, while the USD posted modest gains. This continued overnight in Asian markets where Japanese technology shares slipped, following their western peers.
What happened yesterday
Supply uncertainty sent oil prices up by 2.8% from Monday morning as Brent crude price climbed to around 81.2 USD/bbl. this morning. The move came after the government in Eastern Libya, which is not internationally recognized, said it would halt production from its oil fields from where most of Libya's oil is sourced. While neither the national oil company nor the western Libyan government have confirmed this, several subsidiaries of the former have said they plan to cut production citing internal tensions as the reason. Libya has vast oil resources, but the long-standing conflict has hampered production, and currently the country's output constitutes only 4% of OPEC production.
German IFO indicator declined less than expected printing at 86.6 (cons.: 86.0). The drop was due to a deterioration in respondents' assessment of the current economic situation, which mimics the weakness seen over the past months in growth data and August PMIs. Momentum, particularly in manufacturing, has become even weaker while service sector activity keeps the economy afloat.
Equities: Global equities started the week on a lower note, primarily due to setbacks in US tech and tech-related growth stocks. Despite several sectors, regions, and styles ending higher yesterday, the performance of tech heavyweights dominated. There was no clear top-down candidate to blame for the weak performance. However, the sensitivity of tech to the AI narrative has been evident before, especially in the days leading up to Nvidia's earnings report. With Nvidia delivering blowout results for seven consecutive quarters, it is natural to feel a bit more apprehensive ahead of their results. (Nvidia will report tomorrow). In the US yesterday, Dow +0.2%, S&P 500 -0.3%, Nasdaq -0.9%, and Russell 2000 -0.04%. Most Asian markets are lower this morning, while European futures are marginally higher and US futures are mixed.
FI: There were modest movements in global bond yields despite more comments from Fed officials regarding easing monetary policy. However, much is discounted as 2Y US Treasury yields are below 4% and some 20bp lower than in late December 2023/early January 2024, when the market was pricing in some 6-7cuts. Furthermore, the slope of the 2-10Y US curve is set for a test of 0bp.
FX: In a relatively quiet start to the week the USD rebounded whilst NOK, PLN and HUF were trading on the backfoot. EUR/GBP still hovers just above the 0.8450 mark while EUR/SEK had edged modestly higher towards 11.40 since last week's lows. USD/JPY rebounded slightly after Friday's drop but remains below the 146-mark.
Crude Rallies on Mid-East, Libya Tensions
The week started on mixed feelings. The rising geopolitical tensions in the Middle East, and between the West and China, and a pullback across the big technology stocks casted shadow on the optimism that the Federal Reserve (Fed) is about to start cutting the interest rates in September. The S&P500 and Nasdaq retreated. But the S&P500’s equal weight index advanced to a record high and the Dow Jones industrial index hit a fresh ATH, as well. Nvidia fell more than 2% a few hours before its earnings announcement, while Roundhill’s Magnificent 7 index retreated 1.34%.
Data-wise, the durable goods orders jumped nearly 10% in the US in July, while ex-transport data stalled – in line with the actual rhetoric of slowing US economic growth that should justify the beginning of the Fed rate cut in September.
The Fed rate cuts should provide an ideal environment for a further rotation from the Big Tech companies toward the non-tech sectors at a time when the earnings of the Magnificent 7 companies slow (they slowed to post a probably 34% growth last quarter - we will have the exact number after Nvidia earnings - from above a 40% growth recorded over the past year), while the earnings at the rest of the S&P500 rose by 6% last quarter from the negative territory. As such, the fundamentals are supportive of a further convergence between the tech and the non-tech pockets of the market. The problem with that is, the tech is a major boost to the S&P500 index. Nvidia alone can move the S&P500 by around 1% in a session.
FX and commodities
The US yields and the dollar rebounded on Monday. The EURUSD retreated to 1.1150 and settled a bit higher than that in Asia. Cable consolidates a touch below the 1.32 level as the USDJPY trades near the 145 mark, though the Bank of Japan’s (BoJ) core CPI figure came in softer than expected this morning, and showed that inflation as calculated by the index unexpectedly fell from 2.1% to 1.8%. In Canada, the USDCAD sank below the 1.35 for the first time since April, helped by a rally in crude oil prices due to rising tensions in the Middle East. On top, the news that Libya’s eastern government – which is internationally unrecognized – said that it’s shutting down oilfields in response to ‘attacks on the leadership and employees of the Central Bank of Libya’. The eastern government produces around 1mbpd – which a substantial portion of Libya's overall production. Consequently, US crude was up by 3% yesterday, and around 8% in three sessions. The price of a barrel is testing the 200-DMA to the upside – where it sees strong resistance. The $78/80pb range is home to offers that could be cleared with mounting tensions of all sorts, yet the slowing global growth worries will likely keep the upside limited above this range in the medium run.
China troubles
In China, the market selloff continues; the CSI 300 index trades at the lowest levels since February. Canada announced that it will impose tariffs of 100% on Chinese-made EVs and 25% on steel and aluminium to protect its domestic manufacturers. The mining company BHP’s CEO warned of higher volatility in global commodity markets due to the Chinese woes, and said that the iron ore supply will outpace demand into next year as surplus steel floods the market. Iron ore futures are struggling near the pandemic low levels. Other than that – still in the context of geopolitical shenanigans - IBM said that it will shut its R&D department in China – also due to the mounting tensions between Beijing and Washington. If that’s not enough bad news, their e-commerce giant PDD – the owner of Temu – plunged nearly 30% on Nasdaq and recorded its biggest one-day lost ever, after the company warned of slowing sales as the competitors like Alibaba also increase efforts to attract budget-aware customers. Zooming out, KraneSahres CSI China internet ETF posted its worst weekly outflow in 2 years, as investors moved money into EM bonds on Fed rate cut bets. As such, JP Morgan’s USD denominated EM Bond ETF rose to the highest level this year and has room for a further rally – as it trades with about 23% discount compared to the pre-pandemic times.