Sample Category Title
Swiss Franc and Loonie Lead as Geopolitical Tensions Keep Forex Markets in Check
Trading in the forex markets continued to be relatively subdued, as the initial buzz surrounding a Fed rate cut in September is quickly dissipating. Although there is still some speculation about the possibility of a more aggressive 50bps cut to kick off the easing cycle, the repeated reassurances from Fed officials about a preference for a gradual approach have dampened expectations. It seems increasingly likely that only a significantly disappointing non-farm payroll report on September 6 could prompt a more forceful move from Fed. However, such negative news could also dampen investor confidence, leading to broader market concerns.
So far this week, Canadian Dollar and Swiss Franc are the stronger performers, largely driven by heightened geopolitical tensions that have also contributed to a spike in oil prices. The risk for a broader conflict in the Middle East appeared to ease after Israel and Lebanon's Hezbollah exchanged fire without further escalation. However, fresh concerns have surfaced with reports of Russia launching missile and drone attacks overnight, targeting Kyiv and other regions.
On the weaker side, Kiwi, Yen, and Aussie are trailing, while Dollar, Euro, and Sterling are showing mixed performance.
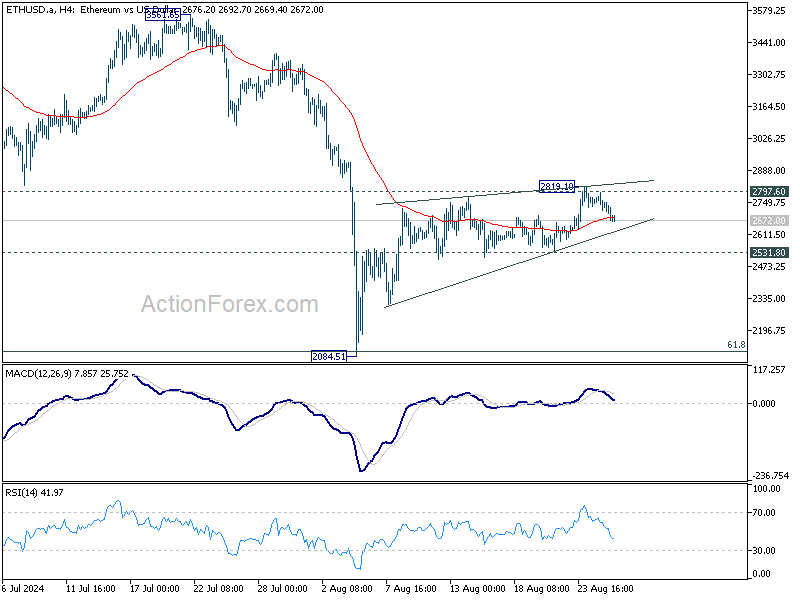
Technically, Ethereum's rebound from 2084.51 is failing strong resistance from 2797.60 support turned resistance and 2800 psychological level. Break of 2531.80 support should confirm rejection by this 2800 resistance zone, and argue that the rebound has already completed. In this case, deeper decline would be seen back to retest 2084.51 low.
In Asia, at the time of writing, Nikkei is down -0.14%. Hong Kong HSI is down -0.21%. China Shanghai SSE is down -0.24%. Singapore Strait Times is down -0.36%. Japan 10-year JGB yield is up 0.0055 at 0.890. Overnight, DOW rose 0.16%. S&P 500 fell -0.32%. NASDAQ fell -0.85%. 10-year yield rose 0.011 to 3.818.
Fed's Daly sees regular, normal cadence as path for rate cuts
San Francisco Fed President Mary Daly said in a Bloomberg TV interview that "the time is upon us" to cut interest rates, strongly suggesting that a rate reduction in September is highly likely.
Daly expressed concerns about maintaining "highly restrictive into a slowing economy", and stated that it is "hard to imagine" not easing rates soon.
Daly outlined her most probable outlook, which involves inflation gradually slowing and the labor market continuing to add jobs at a "steady, sustainable" pace. If this scenario holds, she noted, adjusting policy at a "regular, normal cadence" would be reasonable.
However, Daly also indicated that if the labor market shows any signs of deterioration or weakness, "being more aggressive" in policy adjustments would be appropriate to avoid further economic strain.
DOW hits new record, but Nvidia's earnings could be the decider
DOW managed to break into new intraday record overnight before pulling back slightly, but it was enough to secure a fresh record close. The excitement around the index's performance is palpable, yet the overall market sentiment might hinge on Nvidia's upcoming earnings report on Wednesday. Investors are keen to see the second-quarter results to assess the ongoing strength of the AI trade, which has been a significant driver of market gains.
Technically, doubts persist regarding the Dow's ability to sustain its record-breaking momentum. Firm break below 40584.47 support would indicate that a short term top was formed, and set up deeper pull back to 55 D EMA (now at 39893.83), or around 40k psychological level, before DOW decides on its next move.
Looking ahead
Germany Gfk consumer sentiment and Q2 GDP final will be released in European session. Later in the day, US will release house price index and consumer confidence.
EUR/CHF Daily Outlook
Daily Pivots: (S1) 0.9442; (P) 0.9467; (R1) 0.9482; More....
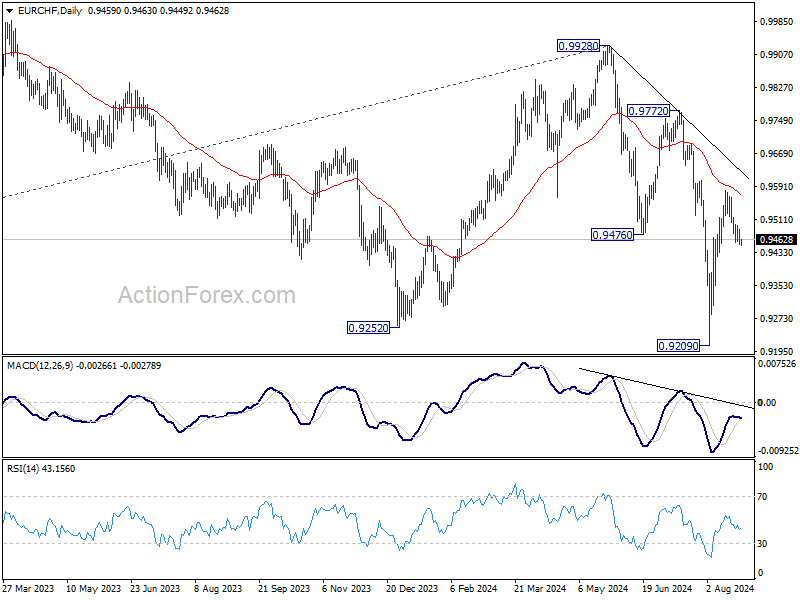
Intraday bias in EUR/CHF stays neutral and outlook is unchanged. On the upside, sustained break of 55 D EMA (now at 0.9569) will pave the way back to 0.9972/0.9928 resistance zone. However, decisive break of 0.9448 will suggest rejection by 55 D EMA, and turn bias back to the downside for 0.9209 low.
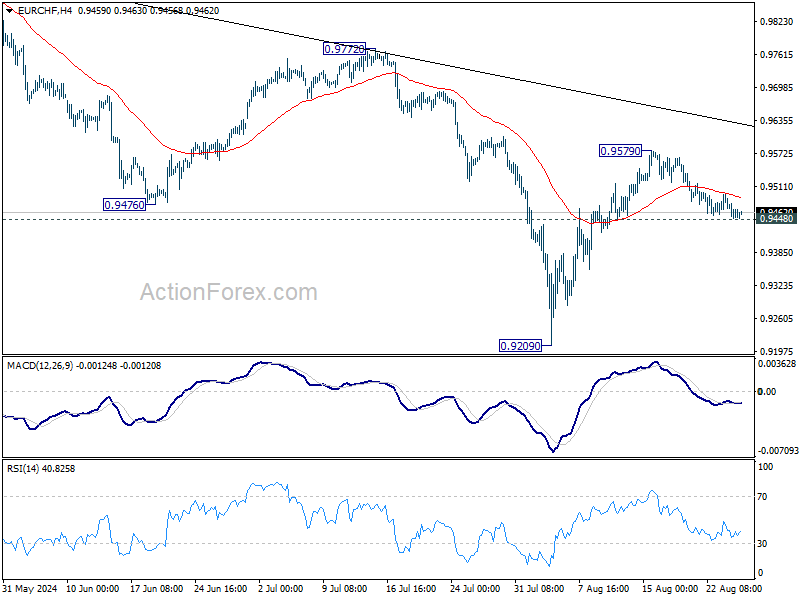
In the bigger picture, medium term corrective pattern from 0.9407 (2022 low) might have completed with three waves to 0.9928. Decisive break of 0.9252 (2023 low) will confirm long term down trend resumption. Next target will be 61.8% projection of 1.1149 to 0.9407 from 0.9928 at 0.8851. For now, outlook will stay bearish as long as 0.9928 resistance holds, even in case of strong rebound.
Economic Indicators Update
| GMT | Ccy | Events | Actual | Forecast | Previous | Revised |
|---|---|---|---|---|---|---|
| 23:50 | JPY | Corporate Service Price Index Y/Y Jul | 2.80% | 2.90% | 3.00% | 3.10% |
| 06:00 | EUR | Germany GDP Q/Q Q2 F | -0.10% | -0.10% | ||
| 13:00 | USD | S&P/CS Composite-20 HPI Y/Y Jun | 7.10% | 6.80% | ||
| 13:00 | USD | Housing Price Index M/M Jun | 0.20% | 0.00% | ||
| 14:00 | USD | Consumer Confidence Aug | 100.2 | 100.3 |
EUR/USD Daily Outlook
Daily Pivots: (S1) 1.1140; (P) 1.1171; (R1) 1.1192; More....
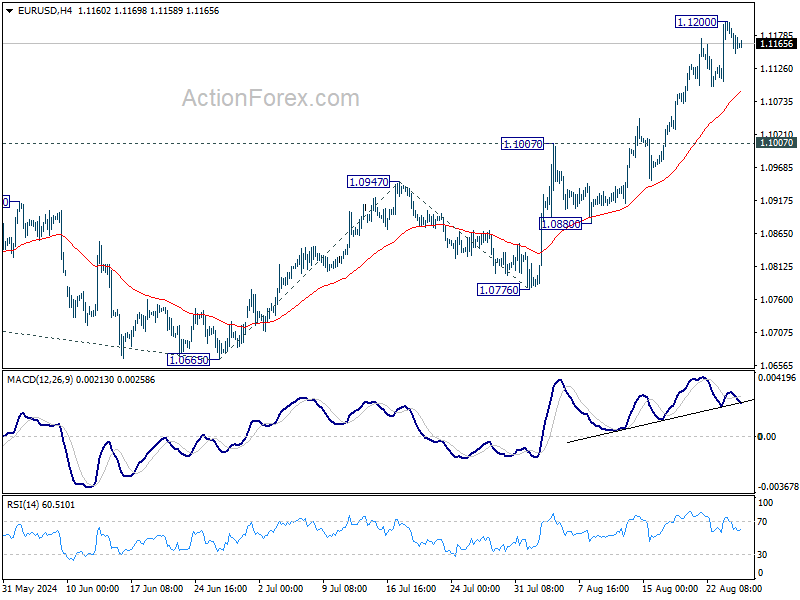
Intraday bias in EUR/USD stays neutral at this point for consolidations below 1.1200. Downside of retreat should be contained above 1.0007 resistance turned support to bring another rally. Above 1.1200 will resume recent rally to 161.8% projection of 1.0665 to 1.0947 from 1.0776 at 1.1232, and then 1.1274 high.
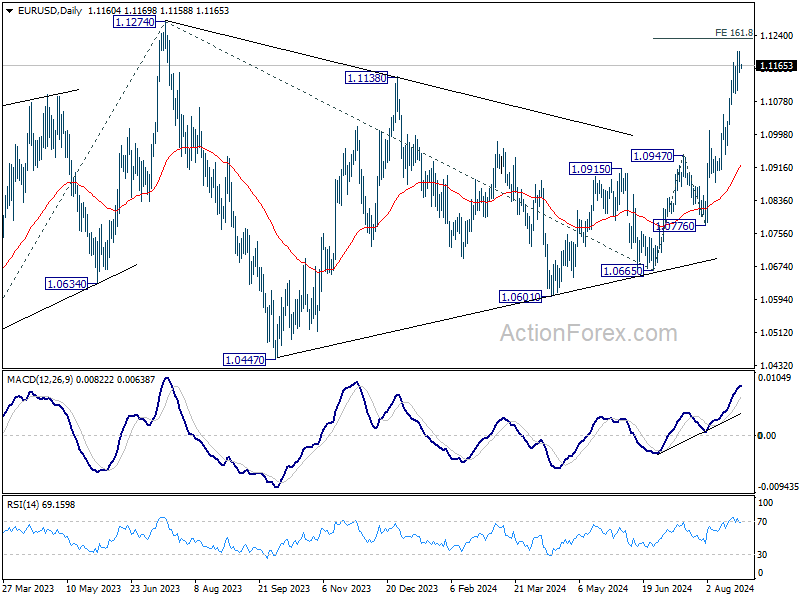
In the bigger picture, break of 1.1138 resistance indicates that corrective pattern from 1.1274 has completed at 1.0665 already. Decisive break of 1.1274 (2023 high) will confirm whole up trend from 0.9534 (2022 low). Next target will be 61.8% projection of 0.9534 to 1.1274 from 1.0665 at 1.1740. This will now be the favored case as long as 1.0947 resistance turned support holds.
USD/JPY Daily Outlook
Daily Pivots: (S1) 143.77; (P) 144.21; (R1) 144.98; More...
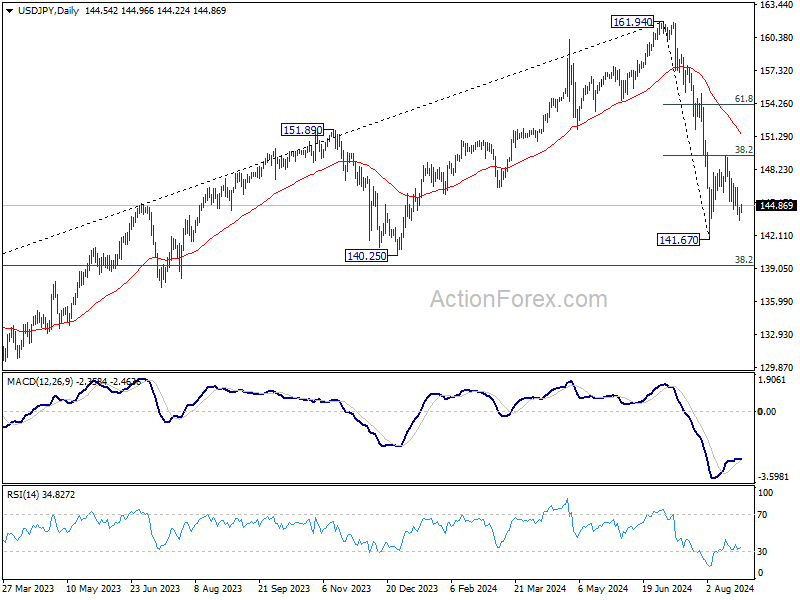
Intraday bias in USD/JPY stays mildly on the downside despite loss of momentum. Fall from 149.35 should target 141.67 low. Firm break there will resume the whole fall from 161.94 to 140.25 support next. On the upside, above 146.47 minor resistance will turn intraday bias neutral first. But, risk will stay on the downside as long as 149.35 resistance holds, in case of recovery.
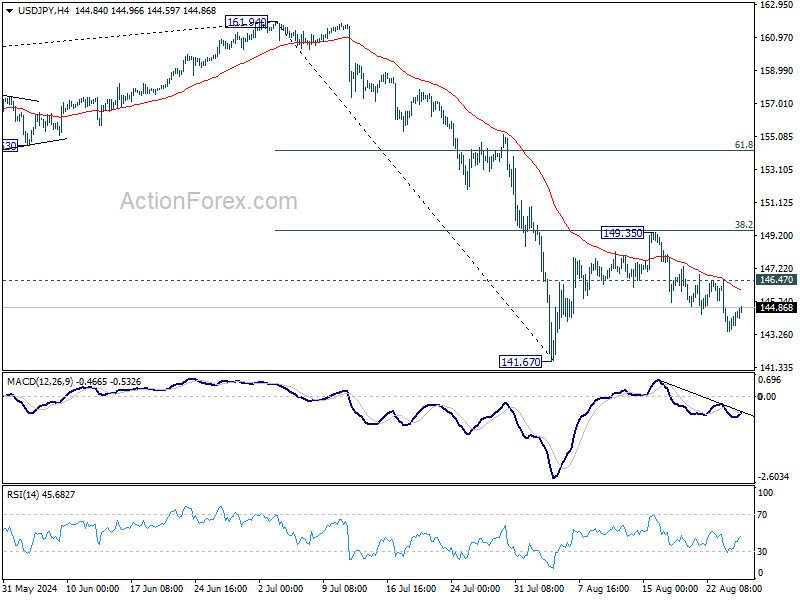
In the bigger picture, fall from 161.94 medium term top is seen as correcting whole up trend from 102.58 (2021 low). Deeper decline could be seen to 38.2% retracement of 102.58 to 161.94 at 139.26, which is close to 140.25 support. In any case, risk will stay on the downside as long as 55 W EMA (now at 149.38) holds. Nevertheless, firm break of 55 W EMA will suggest that the range for medium term corrective pattern is already set.
GBP/USD Daily Outlook
Daily Pivots: (S1) 1.3170; (P) 1.3197; (R1) 1.3215; More...
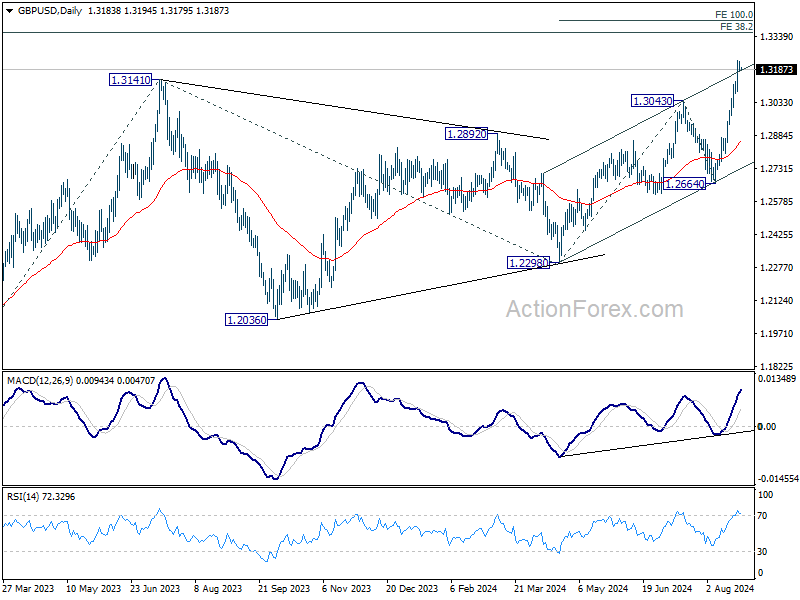
Intraday bias in GBP/USD remain son the upside despite some loss of momentum. Current up trend should target 100% projection of 1.2298 to 1.3043 from 1.2664 at 1.3409. On the downside, below 1.3075 minor support will turn intraday bias neutral and bring consolidations, before staging another rally..
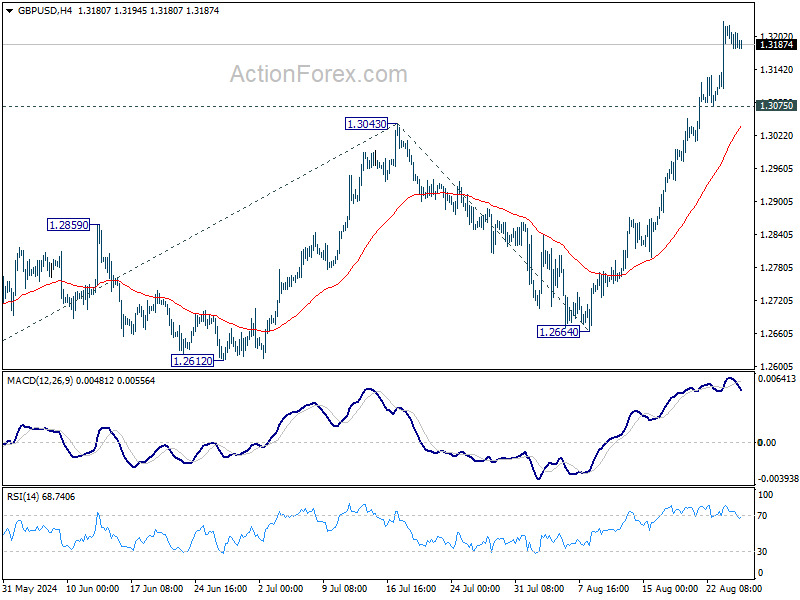
In the bigger picture, up trend from 1.0351 (2022 low) is resuming. Next target is 38.2% projection of 1.0351 to 1.3141 from 1.2298 at 1.3364. For now, outlook will stay bullish as long as 1.2664 support holds, even in case of deep pullback.
USD/CHF Daily Outlook
Daily Pivots: (S1) 0.8457; (P) 0.8472; (R1) 0.8487; More…..
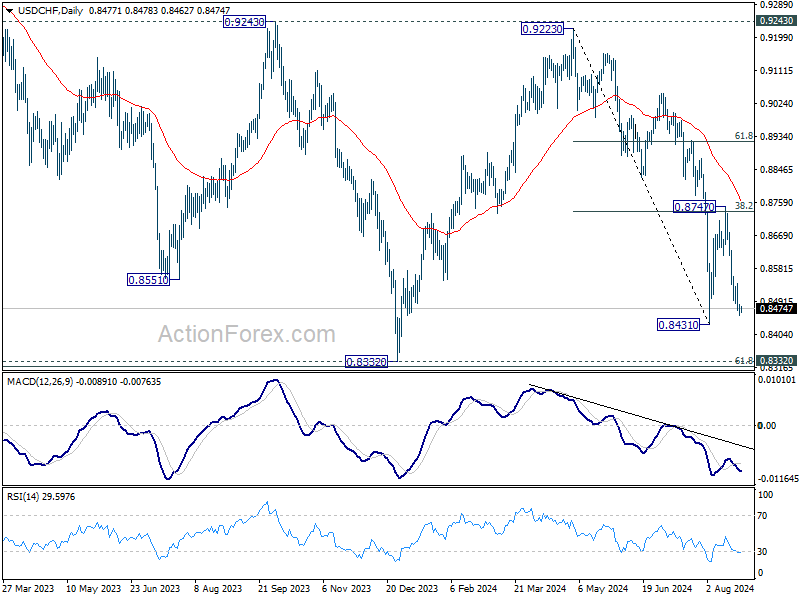
Intraday bias in USD/CHF remains on the downside for retesting 0.8431 support. Firm break there will resume whole decline from 0.9223 towards 0.8332 low. On the upside, above 0.8540 minor resistance will turn intraday bias neutral. But risk will stay on the downside as long as 0.8747 resistance holds, in case of recovery.
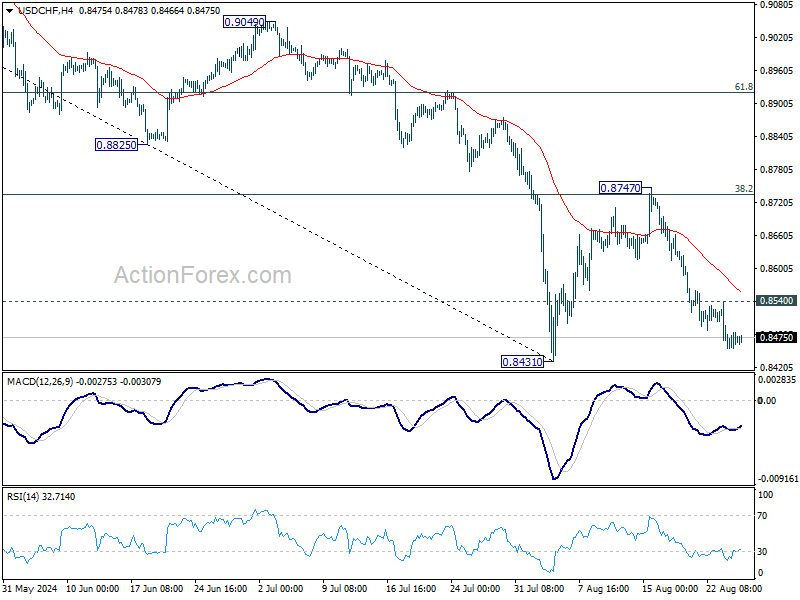
In the bigger picture, price actions from 0.8332 (2023 low) are currently seen as a medium term corrective pattern, with fall from 0.9223 as the second leg. Strong support could be seen from 0.8332 to bring rebound. Yet, overall outlook will continue to stay bearish as long as 0.9243 resistance holds. Firm break of 0.8332, however, will resume larger down trend from 1.0146 (2022 high).
AUD/USD Daily Report
Daily Pivots: (S1) 0.6760; (P) 0.6779; (R1) 0.6790; More...
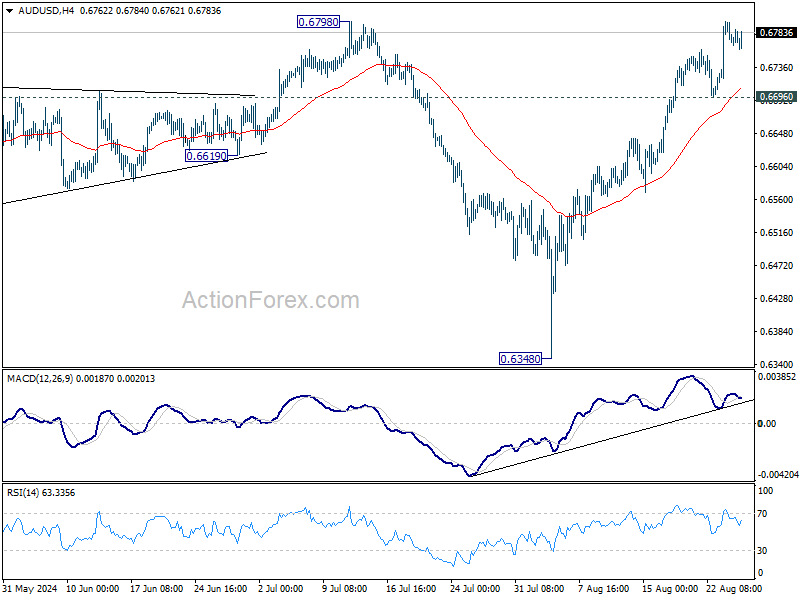
AUD/USD's rally from 0.6348 is in progress and intraday bias stays on the upside. Decisive break of 0.6798 resistance will target 0.6870 resistance next, with prospecting of resuming whole rise from 0.6269. On the downside, below 0.6696 support turn bias to the downside for deeper pull back instead.
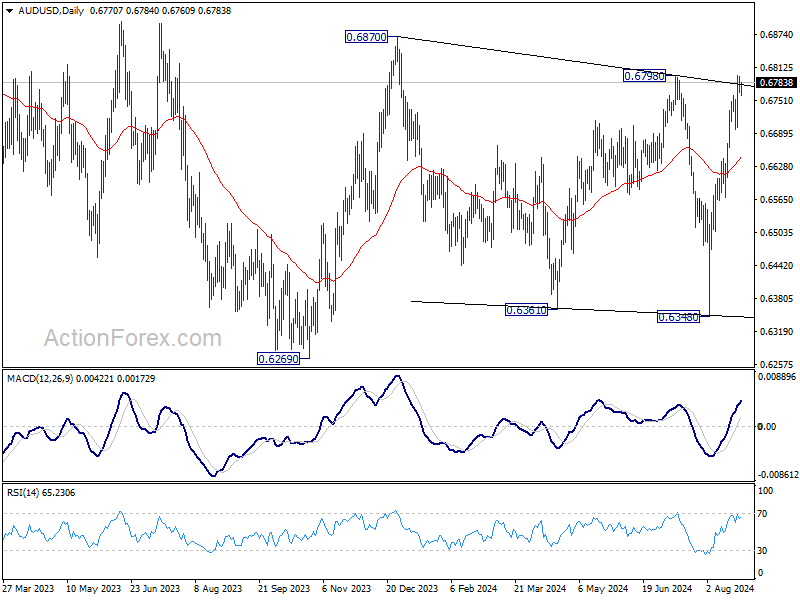
In the bigger picture, overall, price actions from 0.6169 (2022 low) are seen as a medium term corrective pattern, with rise from 0.6269 as the third leg. Firm break of 0.6798/6870 resistance zone will target 0.7156 resistance. In case of another fall, strong support should be seen from 0.6169/6361 to bring rebound.
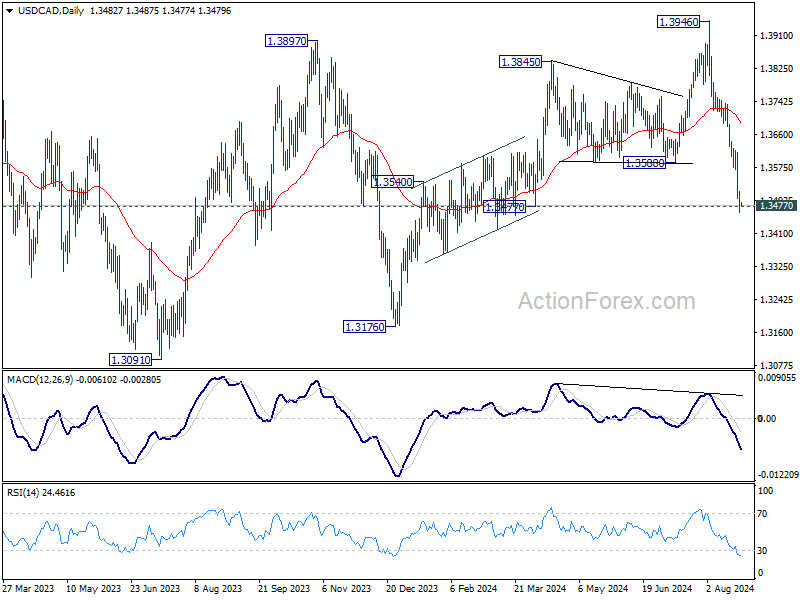
USD/CAD Daily Outlook
Daily Pivots: (S1) 1.3457; (P) 1.3491; (R1) 1.3519; More...
Intraday bias in USD/CAD remains on the downside as fall from 1.3946 is in progress. Firm break of 1.3477 support will pave the way to 1.3091/3176 support zone. On the upside, above 1.3570 support turned resistance will turn intraday bias neutral and bring consolidations first, before staging another decline.
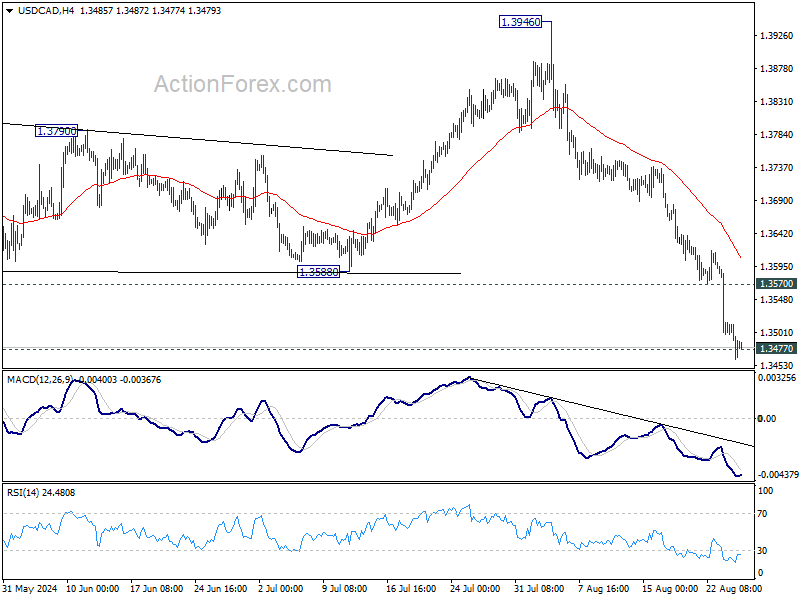
In the bigger picture, current development suggests that corrective pattern from 1.3976 (2022 high) is extending with another falling leg. While deeper decline could be seen, strong support should emerge above 1.2947 resistance turned support to bring rebound. Rise from 1.2005 (2021 low) is still in favor to resume at a later stage.
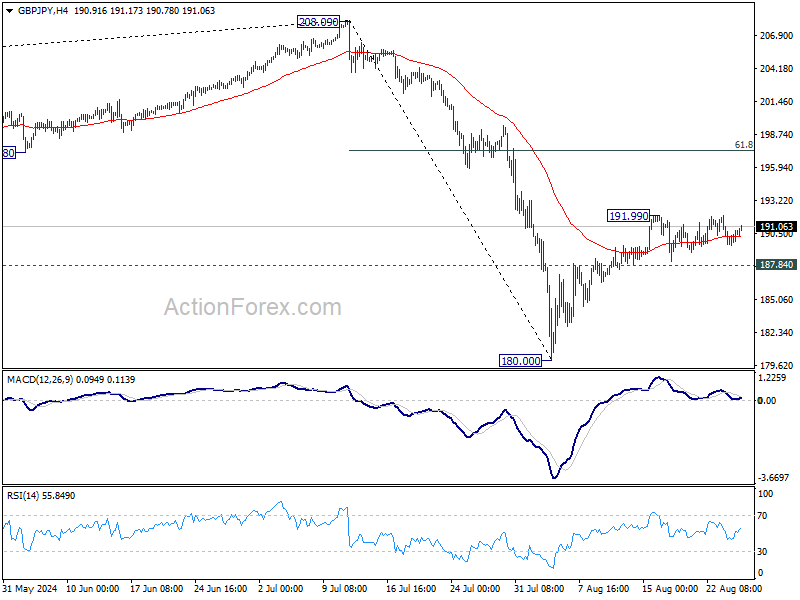
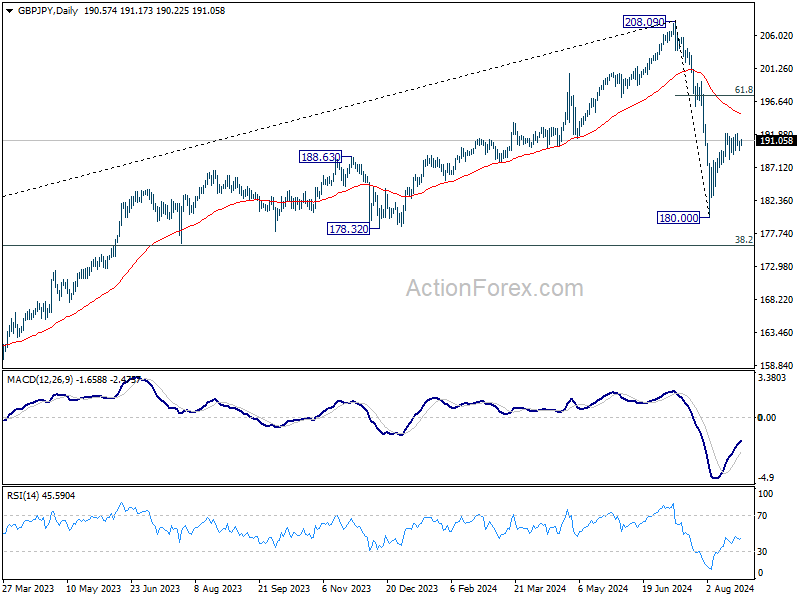
GBP/JPY Daily Outlook
Daily Pivots: (S1) 189.80; (P) 190.30; (R1) 191.08; More...
GBP/JPY is still bounded in range trading below 191.99 and intraday bias remains neutral at this point. On the upside, above 191.99 will target 61.8% retracement of 208.09 to 180.00 at 197.35, as the second leg of the corrective pattern from 208.09. On the downside, however, firm break of 187.84 support will argue that rebound from 180.00 has completed, and turn bias back to the downside for retesting 180.00 instead.
In the bigger picture, price actions from 208.09 are seen as a correction to whole rally from 123.94 (2020 low). Current development suggests that the first leg has completed and the range of medium term consolidation should be set between 38.2% retracement of 123.94 to 208.09 at 175.94 and 208.09.
EUR/JPY Daily Outlook
Daily Pivots: (S1) 160.72; (P) 161.10; (R1) 161.70; More....
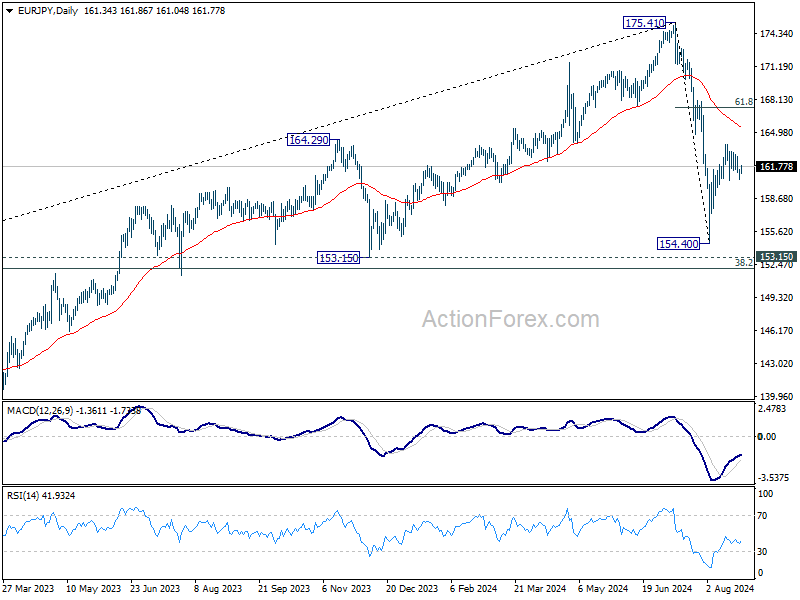
EUR/JPY is still bounded in range trading below 163.86 and intraday bias stays neutral. On the upside, break of 163.86 will target 61.8% retracement of 175.41 to 154.40 at 167.38, as the second leg of the corrective pattern from 175.41. On the downside, however, firm break of 159.80 support will suggest that the rebound from 154.40 has completed, and turn bias back to the downside for 154.40 instead.
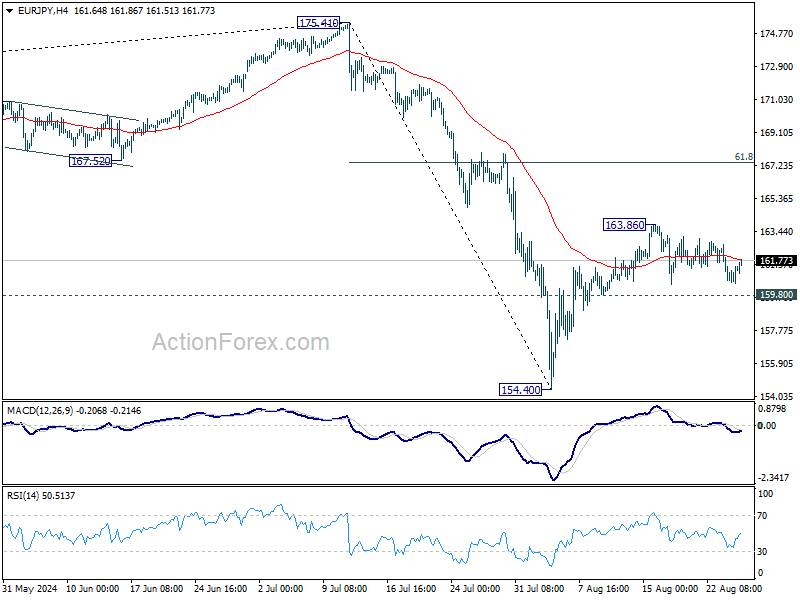
In the bigger picture, price actions from 175.41 are seen as correction to rally from 114.42 (2020 low). Current development suggests that the first leg has completed. The range of consolidation should be seen between 38.2% retracement of 114.42 to 175.41 at 152.11 and 175.41 high.
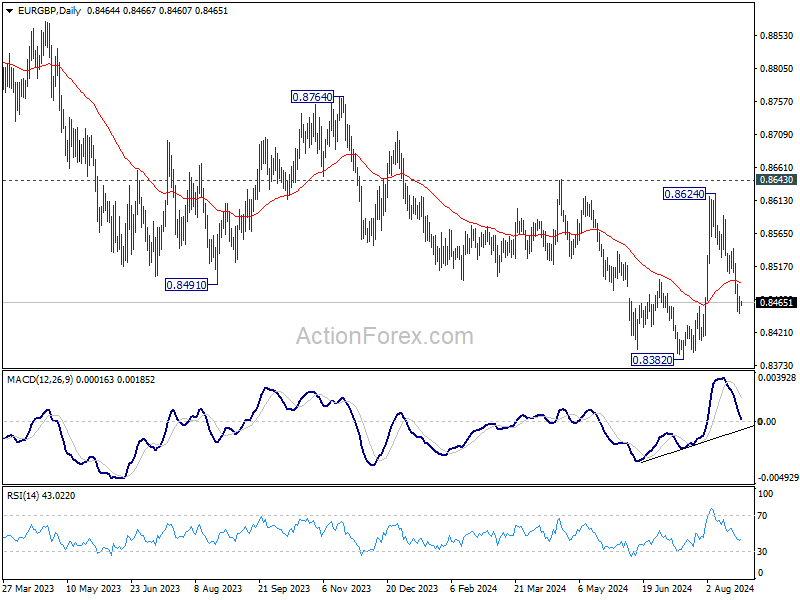
EUR/GBP Daily Outlook
Daily Pivots: (S1) 0.8450; (P) 0.8463; (R1) 0.8475; More....
Intraday bias in EUR/GBP remains on the downside despite some loss of momentum as seen in 4H MACD. Fall from 0.8624 is in progress for retesting 0.8382 low. Decisive break there will resume larger down trend. On the upside, above 0.8491 minor resistance will turn intraday bias neutral first.
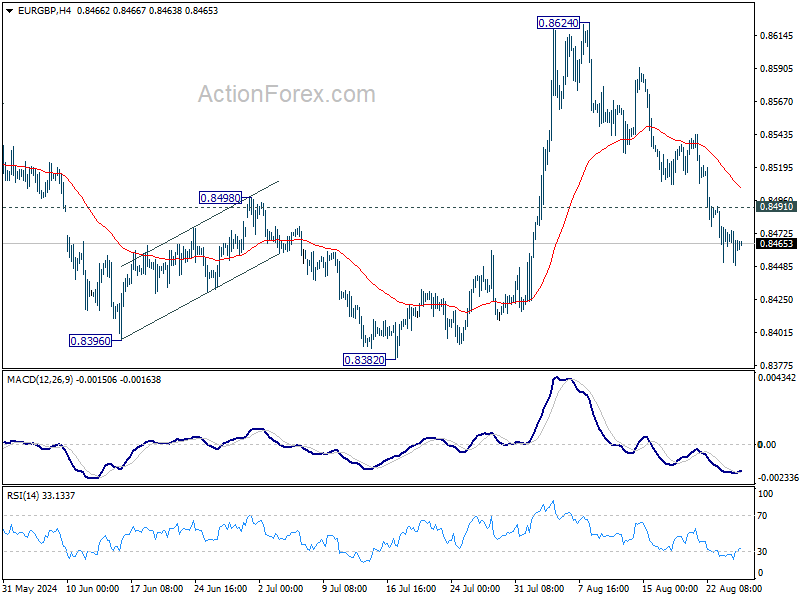
In the bigger picture, while the rebound from 0.8382 is strong, there is no confirmation of trend reversal yet. As long as 0.8643 resistance holds, down trend from 0.9267 could still resume through 0.8382 at a later stage towards 0.8201 (2022 low). However, firm break of 0.8643 will indicate that such down trend has completed, and turn outlook bullish for 0.8764 resistance next.