

Sample Category Title
News of the Week (August 19— August 23): GBPCAD Detailed Analysis
Keep your eyes on GBPCAD—new trading prospects are emerging!
The GBPCAD currency pair, representing the exchange rate between the British pound and the Canadian dollar, is the most critical indicator of economic interaction between the UK and Canada. The Canadian dollar is heavily influenced by fluctuations in commodity prices, particularly oil, due to Canada's status as a major exporter. Economic policy decisions and indicators such as employment levels, GDP growth, and trade balance are also important. On the other hand, the British Pound is influenced by factors such as changes in UK monetary policy, as well as economic reports such as inflation, employment, and consumer spending data.
Canada Consumer Price Index (CPI) MoM, Aug 20, 14:30 (GMT+2)
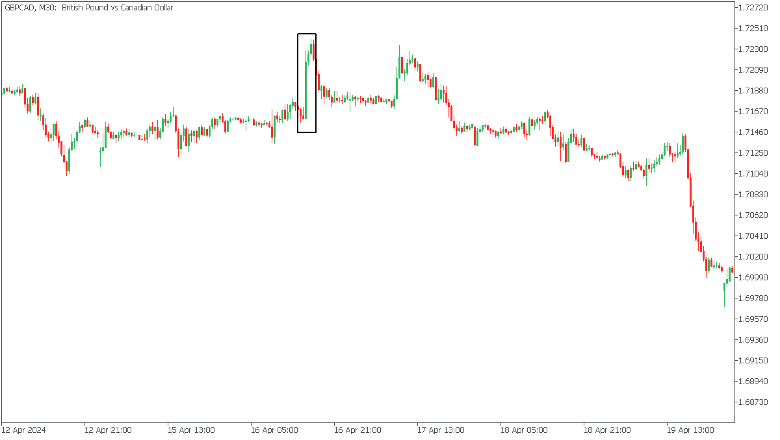
Canada's Consumer Price Index (CPI) is forecast to rise by 0.2%, recovering from a previous decline of -0.1%. If the CPI exceeds this forecast, indicating an increase in inflationary pressures, this could cause the Bank of Canada to consider tightening monetary policy. This would likely lead to a stronger Canadian Dollar and a decline in the GBPCAD pair. Conversely, the Canadian Dollar could weaken if the CPI exceeds the expected 0.2%, indicating less inflationary pressure than expected. This would potentially lead to a rise in the GBPCAD pair, reflecting lower confidence in the strength of the Canadian economy.
Last time on April 16, 2024, Canadian CPI came in below expectations, causing GBPCAD to surge!
UK Manufacturing Purchasing Managers Index (PMI), Aug 22, 10:30 (GMT+2)
The UK manufacturing PMI is forecast to decline slightly to 51.5 from 52.1. If the PMI beats expectations, demonstrating the resilience of the manufacturing sector, this could boost investor confidence in the UK economy and strengthen the Pound. A stronger Pound is likely to lead to a higher GBPCAD exchange rate. On the other hand, if the PMI falls short of expectations, indicating a weakening manufacturing sector, this could undermine confidence in the Pound. Such a scenario will likely lead to a fall in the GBPCAD pair, as the pound will lose ground.
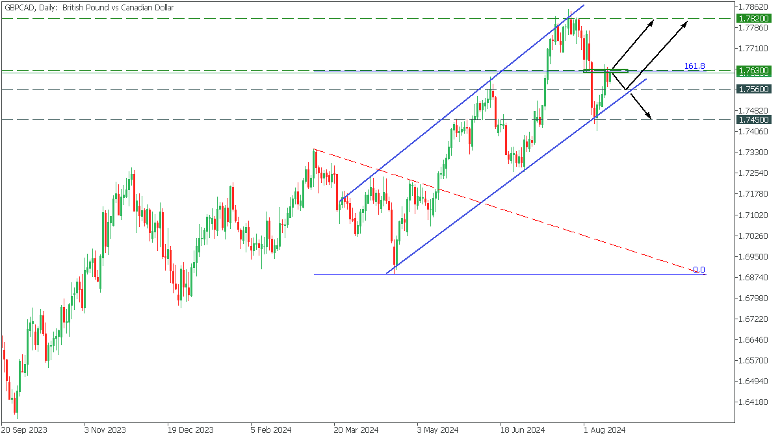
In the Daily timeframe, GBPCAD, in a long-term uptrend, formed a rising channel pattern. The price bounced off the trend line and is consolidating near 161.8 Fibonacci, creating two possible scenarios.
- If the bulls push the price above 1.7630, the target will be 1.7820. However, if the price bounces off the resistance, it could fall to the trend line and then rally upwards;
- Otherwise, if GBPCAD breaks the trend line and falls below 1.7560, it will reach the support at 1.7450;
New Zealand Dollar Extends Gains as Services Index Rises
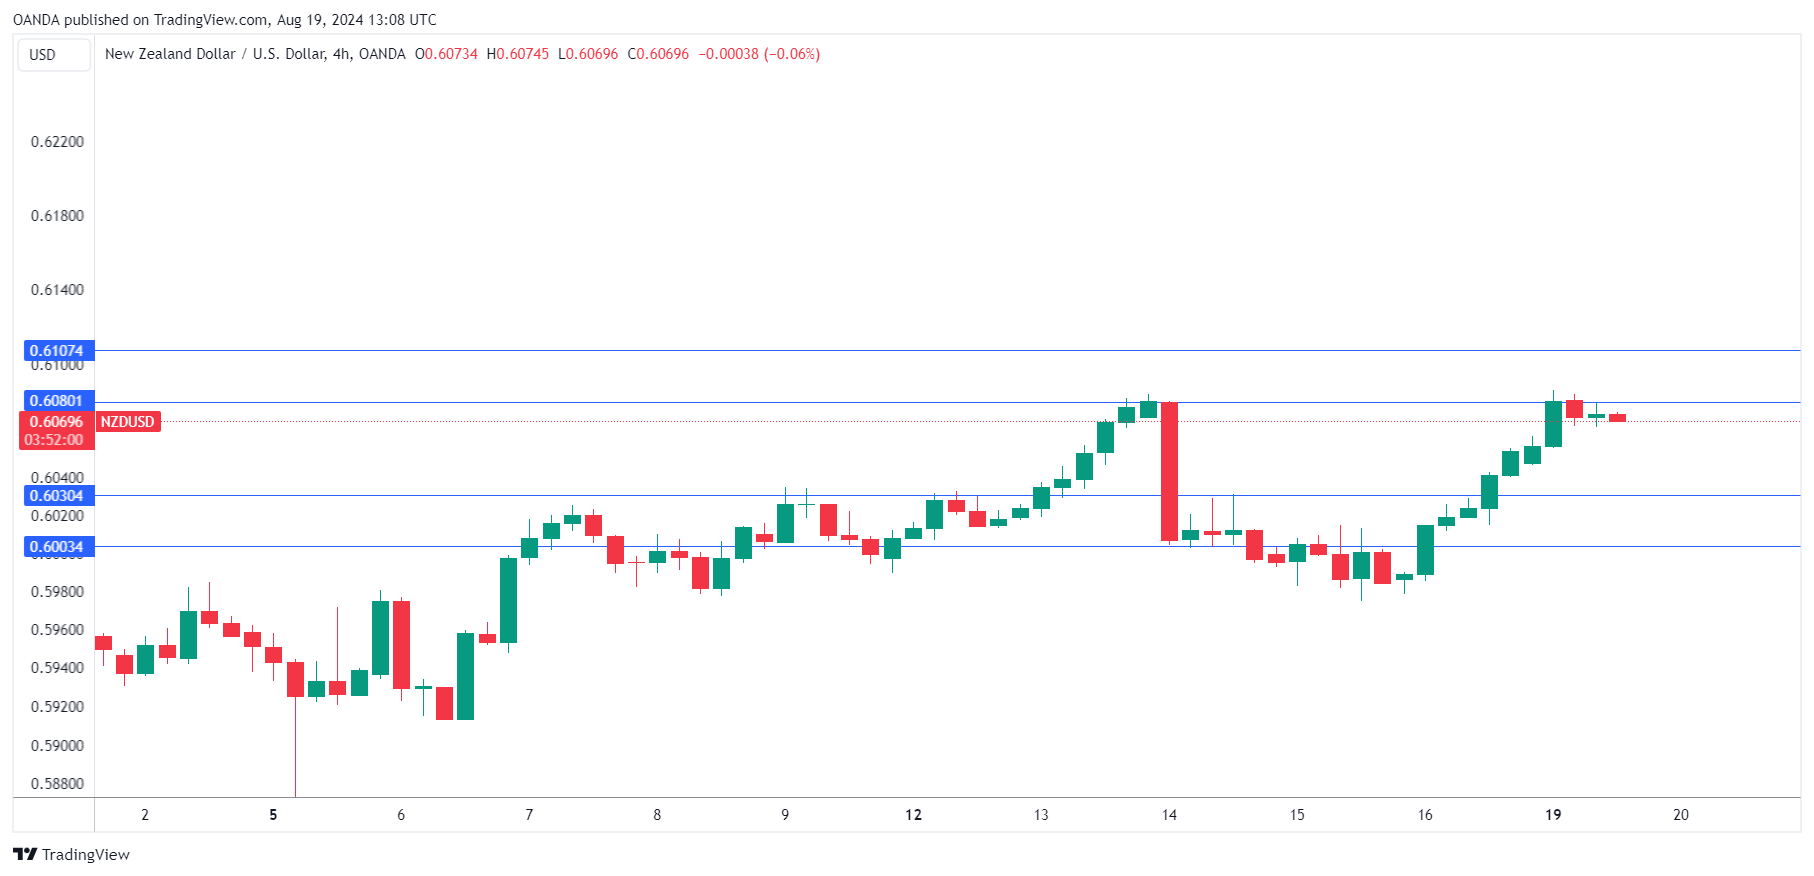
The New Zealand dollar wrapped up a fourth consecutive winning week and is in positive territory on Monday. NZD/USD is trading at 0.6076, up 0.37% in the European session at the time of writing.
New Zealand PSI pace of contraction eases
The New Zealand Performance of Services Index rose to 44.6 in July, up sharply from 40.7 in June. The index remained in contraction mode (below 50) for a fifth straight month and all industries reported contraction, which is a sign of concern. The services sector makes up about two-thirds of New Zealand’s GDP and the continuing contraction points to a weak economy.
The Reserve Bank of New Zealand delivered an initial rate cut last week and forecast that GDP will decline 0.5% in the second quarter and 0.2% in Q4.This would mark a technical recession, with two consecutive quarters of negative growth.
In the US, last week’s data was solid, as retail sales jumped 1% and inflation ticked lower 2.9%, down from 3%. On Friday, UoM consumer sentiment rose in July and beat expectation, while inflation expectations were unchanged at 2.9%, in line with expectations. The markets melted down after a weak US employment report earlier this month but strong US numbers last week led to improved risk appetite which has hurt the US dollar.
The markets expect a rate cut at the Federal Reserve’s next meeting on September 18, with a quarter-point cut being the most likely decision. On Friday, Minneapolis Fed President Neel Kashkari said that a rate cut discussion at the September meeting was “appropriate” as inflation had eased, but expressed concern about the deteriorating labor market.
.
NZD/USD Technical
- NZD/USD tested resistance earlier at 0.6080. Next, there is resistance at 0.6107
- 0.6030 and 0.6003 are providing support
USD/JPY Mid-Day Outlook
Daily Pivots: (S1) 147.00; (P) 148.20; (R1) 148.83; More...
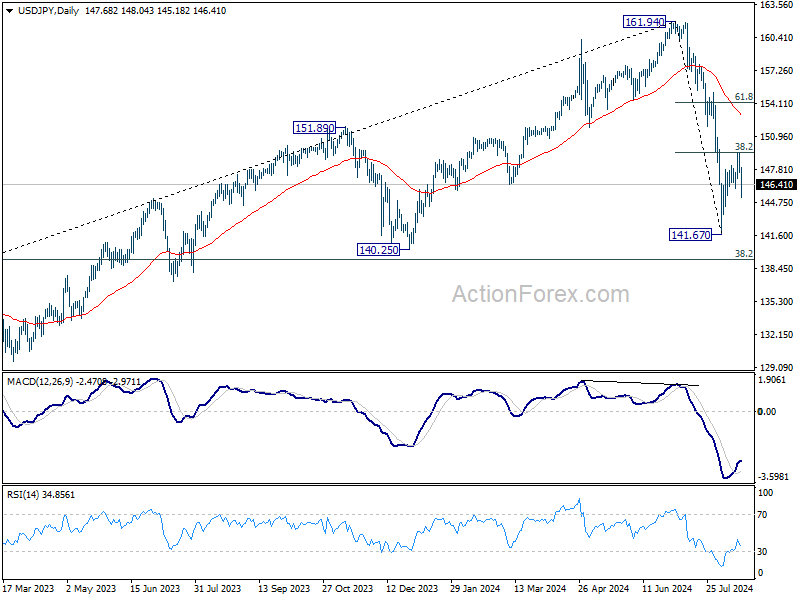
USD/JPY's rebound from 141.67 could have completed after rejection by 38.2% retracement of 161.94 to 141.67 at 149.41. Intraday bias remains on the downside for retesting 141.67 low. Firm break there will resume the whole fall from 161.94 to 139.26 fibonacci level next. For now, risk will stay on the downside as long as 149.35 resistance holds, in case of recovery.
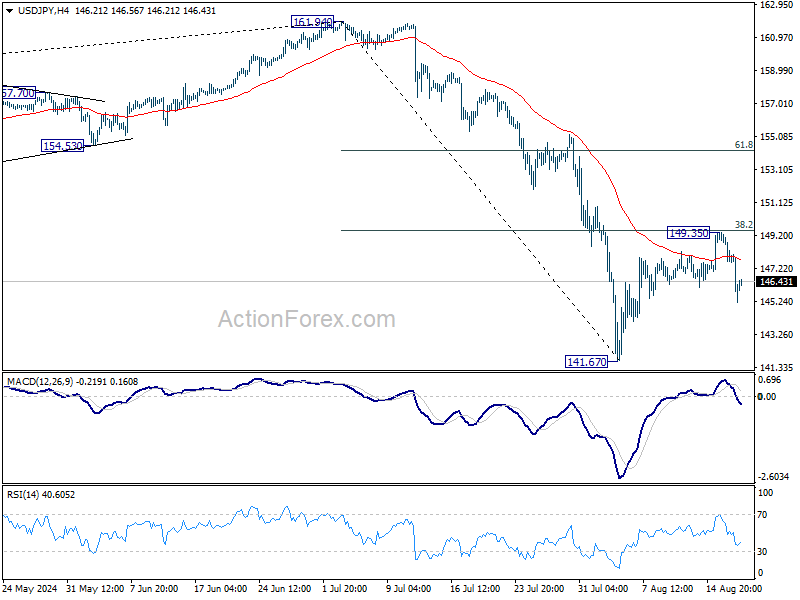
In the bigger picture, fall from 161.94 medium term is seen as correcting whole up trend from 102.58 (2021 low). Deeper decline could be seen to 38.2% retracement of 102.58 to 161.94 at 139.26, which is close to 140.25 support. In any case, risk will stay on the downside as long as 55 W EMA (now at 149.63) holds. Nevertheless, firm break of 55 W EMA will suggest that the range for medium term corrective pattern is already set.
USD/CHF Mid-Day Outlook
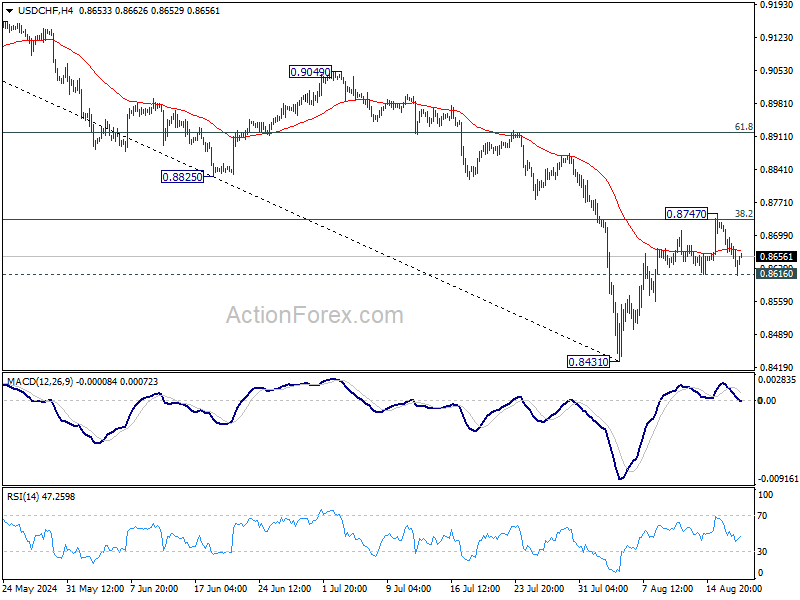
Daily Pivots: (S1) 0.8636; (P) 0.8685; (R1) 0.8710; More…..
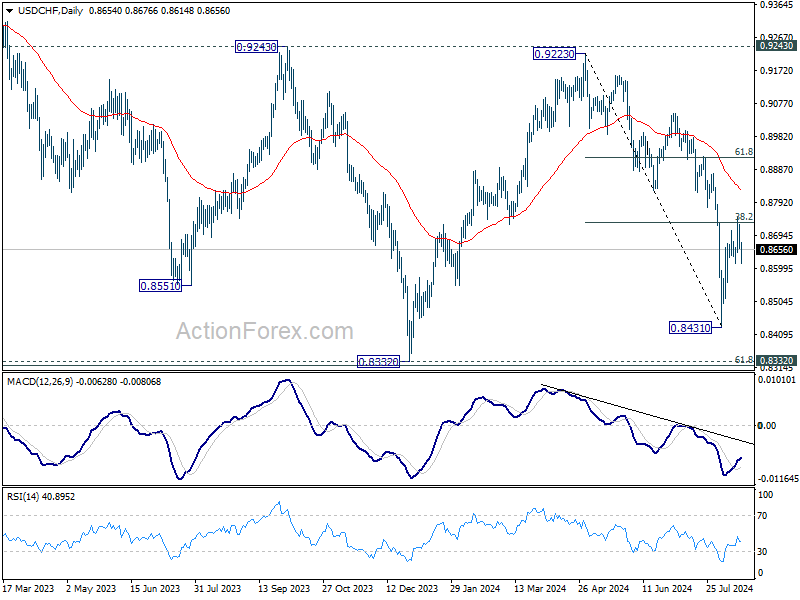
Outlook in USD/CHF remains unchanged and intraday bias stays neutral for now. On the downside, break of 0.8616 support will indicate rejection by 38.2% retracement of 0.9223 to 0.8431 at 0.8734, and turn bias back to the downside for retesting 0.8431 low. On the upside, sustained break of 0.8734 will extend the rebound from 0.8431 to 61.8% retracement at 0.8920, even as a corrective move.
In the bigger picture, price actions from 0.8332 (2023 low) are currently seen as a medium term corrective pattern, with fall from 0.9223 as the second leg. Strong support could be seen from 0.8332 to bring rebound. Yet, overall outlook will continue to stay bearish as long as 0.9243 resistance holds. Firm break of 0.8332, however, will resume larger down trend from 1.0146 (2022 high).
EUR/USD Mid-Day Outlook
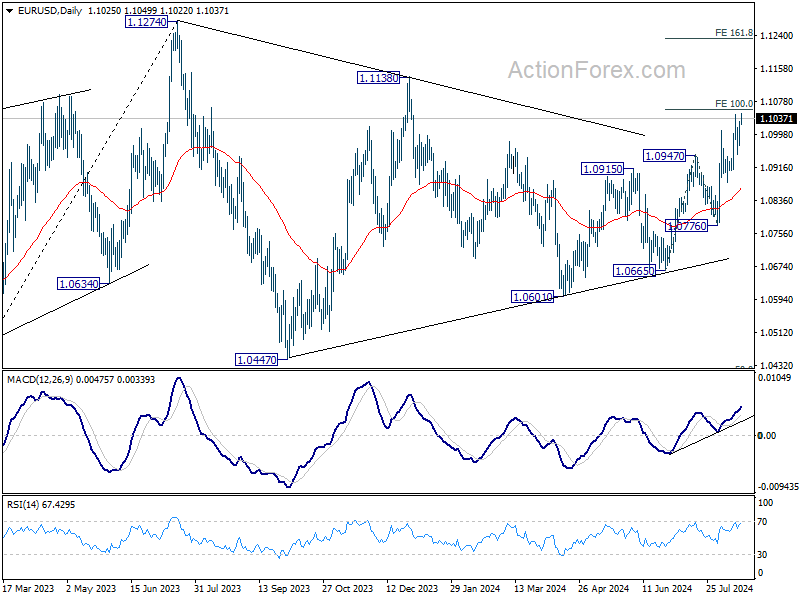
Daily Pivots: (S1) 1.0942; (P) 1.0980; (R1) 1.1010; More.....
Intraday bias in EUR/USD remains on the upside for 100% projection of 1.0665 to 1.0947 from 1.0776 at 1.1058. Decisive break there could prompt upside acceleration through 1.1138 resistance to 161.8% projection at 1.1232. However, considering bearish divergence condition in 4H MACD, break of 1.948 support will suggest near term reversal and turn bias to the downside for 1.0880 support and below.
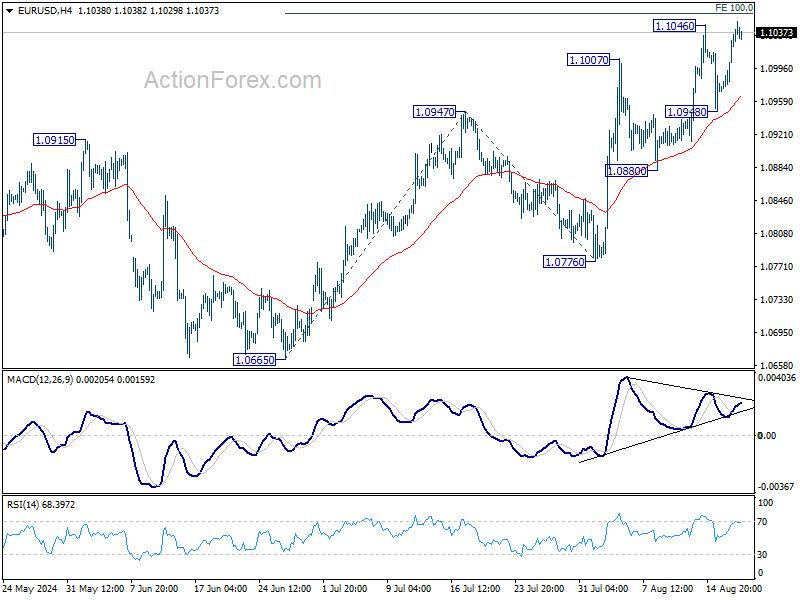
In the bigger picture, price actions from 1.1274 are viewed as a corrective pattern that's could still extend. Break of 1.1138 resistance will be the first signal that rise from 0.9534 (2022 low) is ready to resume through 1.1274 (2023 high). However, break of 1.0776 support will extend the correction with another falling leg back towards 1.0447 support.
GBP/USD Mid-Day
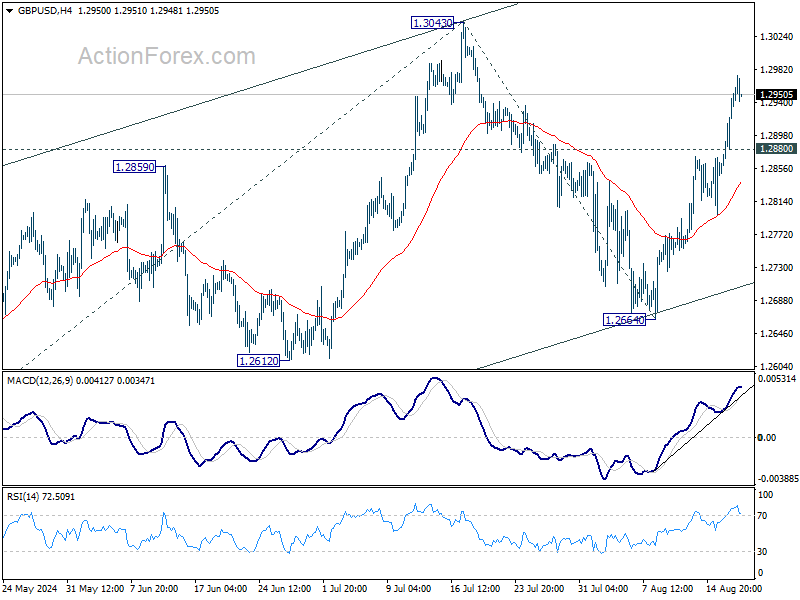
Daily Pivots: (S1) 1.2879; (P) 1.2913; (R1) 1.2979; More...
GBP/USD's rise from 1.2664 is still in progress and intraday bias stays on the upside for retesting 1.3043 high. Firm break there will resume whole rise from 1.2998 to 61.8% projection of 1.2298 to 1.3043 from 1.2664 at 1.3124, which is close to 1.3141 high. On the downside, below 1.2880 minor support will turn intraday bias neutral first.
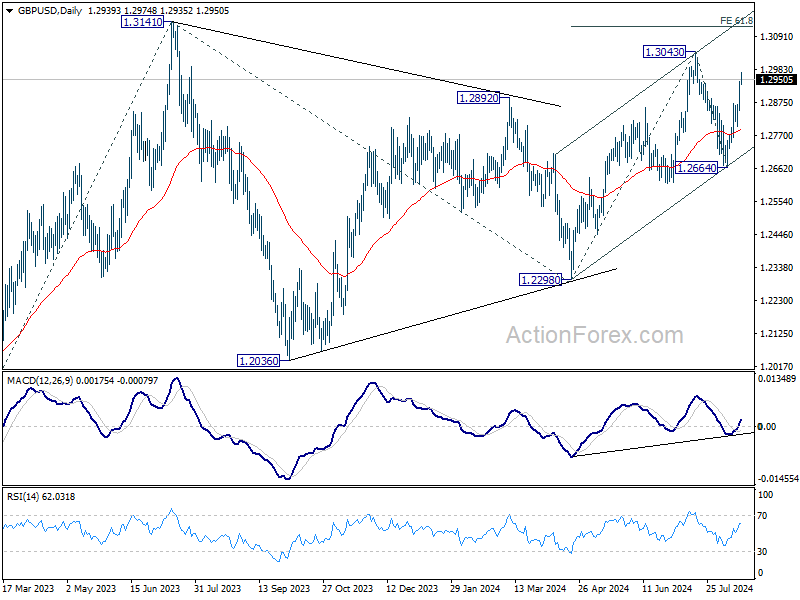
In the bigger picture, corrective pattern from 1.3141 might have completed at 1.2298 already. Rise from there could be resuming the larger up trend from 1.0351 (2022 low). Decisive break of 1.3141 will target 38.2% projection of 1.0351 to 1.3141 from 1.2298 at 1.3364 next. However, break of 1.2664 support will delay this bullish case once again and extend the corrective pattern from 1.3141.
Dollar Remains Under Broad Pressure, Yen Maintains Strength
Dollar continues to face broad-based selling pressure as the markets move into US session. Fed Governor Christopher Waller is set to speak, but he is expected to maintain his consistent view that Fed is nearing a rate cut while the economy remains on track for soft landing. The market's primary focus, however, is squarely on Fed Chair Jerome Powell’s speech at the Jackson Hole Symposium later this week, where traders hope for more definitive guidance on the Fed's next steps.
In the upcoming Asian session, attention will turn to China, where it is widely expected to keep one-year and five-year loan prime rates unchanged. This follows a modest 10 basis point cut in July, signaling a cautious approach to monetary easing. Meanwhile, RBA will release the minutes from its August meeting. Given the RBA’s firm stance that a rate cut is not on the horizon, the minutes are unlikely to offer any surprises, though traders will still comb through them for any hints of policy shifts.
Overall, Dollar is currently the day’s weakest performer, pressured by a mix of cautious sentiment and positioning ahead of Powell's speech. Canadian Dollar and British Pound are also underperforming. In contrast, Japanese Yen has strengthened considerably, making it the strongest currency of the day, followed by Australian and New Zealand Dollars. Euro and Swiss Franc are trading in the middle of the pack.
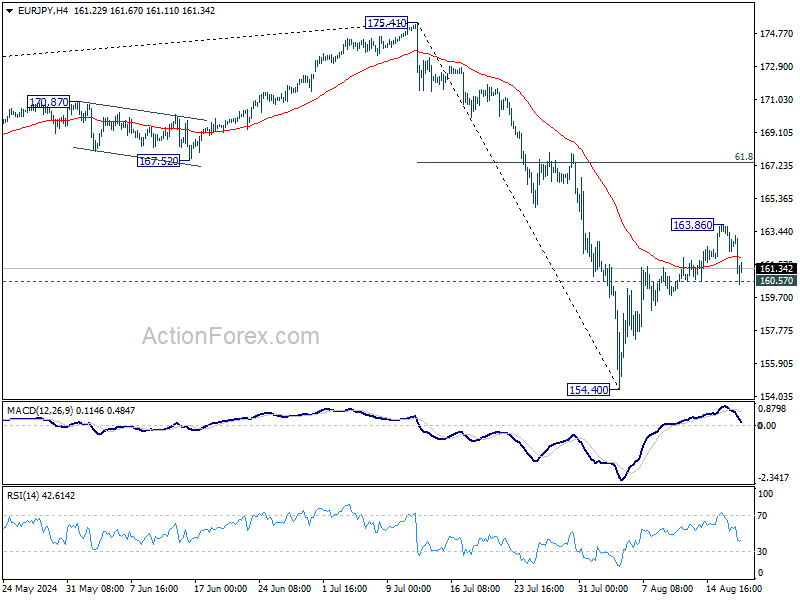
Technically, a major immediate focus is whether Yen's rebound will gain further momentum. Key levels to watch include 160.57 minor support in EUR/JPY and 187.84 minor support at 187.84. USD/JPY has already broken corresponding level of 146.06 already. Firm break of these levels would argue that Yen's near term pull back has completed, and these Yen crosses might then be ready to revisit the lows set earlier in the month.
In Europe, at the time of writing, FTSE is up 0.18%. DAX is up 0.37%. CAC is up 0.54%. UK 10-year yield is up 0.0094 at 3.941. Germany 10-year yield is down -0.001 at 2.250. Earlier in Asia, Nikkei fell -1.77%. Hong Kong HSI rose 0.80%. China Shanghai SSE rose 0.49%. Singapore Strait Times rose 0.08%. Japan 10-year JGB yield rose 0.0145 to 0.890.
Fed's Kashkari: Appropriate to discuss rate cut in September
Minneapolis Fed President Neel Kashkari indicated that Fed's focus is increasingly shifting toward concerns in the labor market, moving away from the inflation side of its dual mandate.
In an interview with WSI, Kashkari emphasized that "the balance of risks has shifted more towards the labor market," making the debate over a potential rate cut in September "an appropriate one to have."
While acknowledging that inflation is showing signs of progress, Kashkari expressed concerns about "concerning signs" in the labor market.
Despite these, he stated that there is no compelling reason to lower interest rates by more than a quarter percentage point at a time, citing the continued low levels of layoffs and unemployment benefit claims, which do not yet indicate a significant downturn in the labor market.
NZ BNZ services rises to 44.6, modest improvement, but remains under pressure
New Zealand BNZ Performance of Services Index saw a modest rise in July, climbing from 40.7 to 44.6. However, the PSI has averaged only 46.5 for 2024, a stark contrast to its historical average of 53.2.
Breaking down the details, there were slight improvements across most categories. Activity/sales increased from 36.2 to 39.1, and employment ticked up from 45.7 to 46.6. New orders/business rose from 38.9 to 45.3, and stock/inventories edged higher from 43.9 to 45.1. On the downside, supplier deliveries slipped slightly from 41.4 to 41.0.
Despite these gains, the overall sentiment remains cautious, with 67.0% of respondents expressing negative views about the current economic climate, unchanged from June. High living costs and rising interest rates were frequently cited as significant challenges.
BNZ’s Senior Economist Doug Steel provided a sobering perspective, noting that "the increase in the PSI does not even get the index back to the level it was during the depths of the GFC back in 2008/09."
GBP/USD Mid-Day Outlook
Daily Pivots: (S1) 1.2879; (P) 1.2913; (R1) 1.2979; More...
GBP/USD's rise from 1.2664 is still in progress and intraday bias stays on the upside for retesting 1.3043 high. Firm break there will resume whole rise from 1.2998 to 61.8% projection of 1.2298 to 1.3043 from 1.2664 at 1.3124, which is close to 1.3141 high. On the downside, below 1.2880 minor support will turn intraday bias neutral first.
In the bigger picture, corrective pattern from 1.3141 might have completed at 1.2298 already. Rise from there could be resuming the larger up trend from 1.0351 (2022 low). Decisive break of 1.3141 will target 38.2% projection of 1.0351 to 1.3141 from 1.2298 at 1.3364 next. However, break of 1.2664 support will delay this bullish case once again and extend the corrective pattern from 1.3141.
Economic Indicators Update
| GMT | Ccy | Events | Actual | Forecast | Previous | Revised |
|---|---|---|---|---|---|---|
| 22:30 | NZD | Business NZ PSI Jul | 44.6 | 40.2 | 40.7 | |
| 23:50 | JPY | Machinery Orders M/M Jun | 2.10% | 0.90% | -3.20% |
Gold (XAU/USD) Nears Record Highs Amid Geopolitical Uncertainty and Fed Speculations
The price of gold continues its impressive ascent, balancing around $2500 per troy ounce early this week, hovering near record peaks. The primary catalyst driving this rally is the intensified demand for safe-haven assets amid ongoing geopolitical tensions.
The spotlight remains on the Middle East conflict, with U.S. Secretary of State Antony Blinken slated to participate in ceasefire talks between Israel and Gaza. However, the fluctuating news from the region casts doubt on the success of these negotiations, thereby boosting gold's appeal as a secure investment.
Further supporting gold's rally are the market expectations surrounding the U.S. Federal Reserve's upcoming actions. Despite robust economic indicators, inflation is inching closer to the Fed’s target, prompting speculation of forthcoming interest rate reductions. Investors are currently anticipating a 25 basis point cut in September, with potential for additional cuts at the year's remaining meetings, summing up to 75-100 basis points.
This week is pivotal for gold investors, with the Federal Reserve set to release the minutes from its latest meeting and a scheduled speech by Fed Chairman Jerome Powell. These events are expected to clarify the Fed's stance on monetary policy, influencing gold's trajectory.
Technical Analysis of XAU/USD
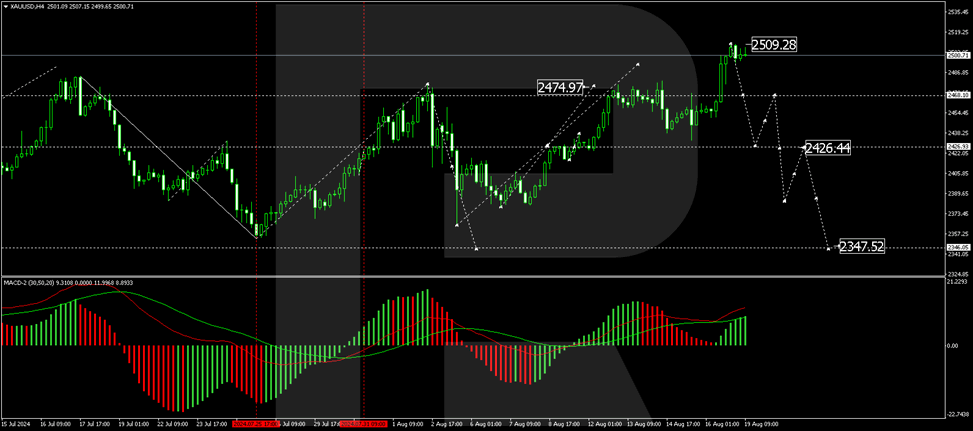
Gold has completed a growth structure reaching $2509.00 on the H4 chart. Currently, a consolidation pattern is forming below this peak, with expectations leaning towards a downward breakout initiating a decline towards $2426.44, potentially extending down to $2347.55. This bearish outlook is technically supported by the MACD indicator, where the signal line is set for a downward trajectory from above the zero level.
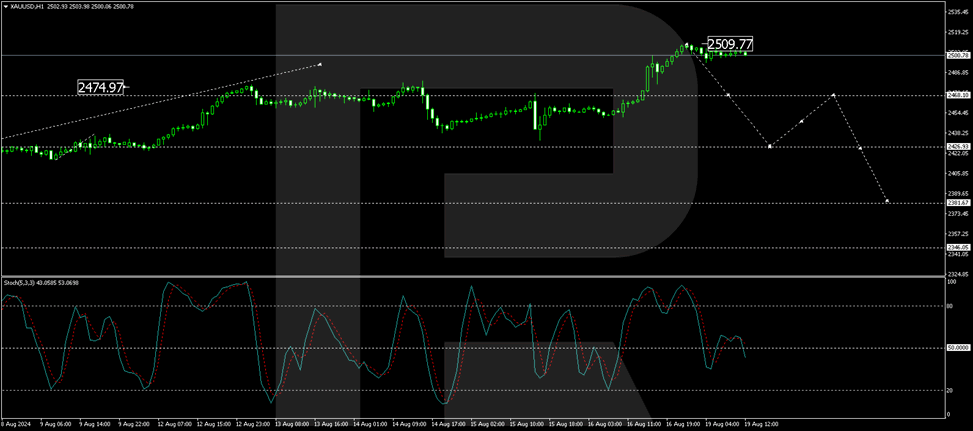
On the H1 chart, gold has achieved the upper boundary of its latest growth wave at $2509.77, followed by a formation of a tight consolidation range. Anticipations are set for a downward movement, targeting a decline to $2468.00 with a further potential to reach $2426.90. This bearish perspective aligns with the Stochastic oscillator's signal line, which is poised to drop from below 80 to 20, suggesting a potential selloff in the near term.
As geopolitical events unfold and the Federal Reserve's monetary policy becomes clearer, gold’s price dynamics are expected to remain a focal point for investors seeking stability in uncertain times.
Fed’s Kashkari: Appropriate to discuss rate cut in September
Minneapolis Fed President Neel Kashkari indicated that Fed's focus is increasingly shifting toward concerns in the labor market, moving away from the inflation side of its dual mandate.
In an interview with WSI, Kashkari emphasized that "the balance of risks has shifted more towards the labor market," making the debate over a potential rate cut in September "an appropriate one to have."
While acknowledging that inflation is showing signs of progress, Kashkari expressed concerns about "concerning signs" in the labor market.
Despite these, he stated that there is no compelling reason to lower interest rates by more than a quarter percentage point at a time, citing the continued low levels of layoffs and unemployment benefit claims, which do not yet indicate a significant downturn in the labor market.
Gold (XAU/USD) Eyes Consolidation Above $2500/oz. Will Bulls Hold the Line?
- Gold prices surpassed the $2500/oz level on Friday despite a decrease in the likelihood of a 50 bps cut at the Federal Reserve’s September meeting.
- The rally in gold prices is attributed to dovish remarks by Federal Reserve policymakers and concerns over rising tensions in the Middle East.
- From a technical standpoint, the weekly chart indicates a strong bullish trend for gold, but a retracement towards the 2450 mark is possible.
Gold prices are aiming to consolidate above the $2500/oz level after surpassing this psychological threshold on Friday. This movement took some market participants by surprise, especially considering the initial reaction of the precious metal to the US CPI data earlier in the week.
Despite the reduction in the likelihood of a 50 bps cut at the Federal Reserve’s September meeting—dropping from 50% to 28.5%—gold managed to breach the $2500/oz mark. This reduction in the expected rate cut theoretically should have exerted downward pressure on gold prices.
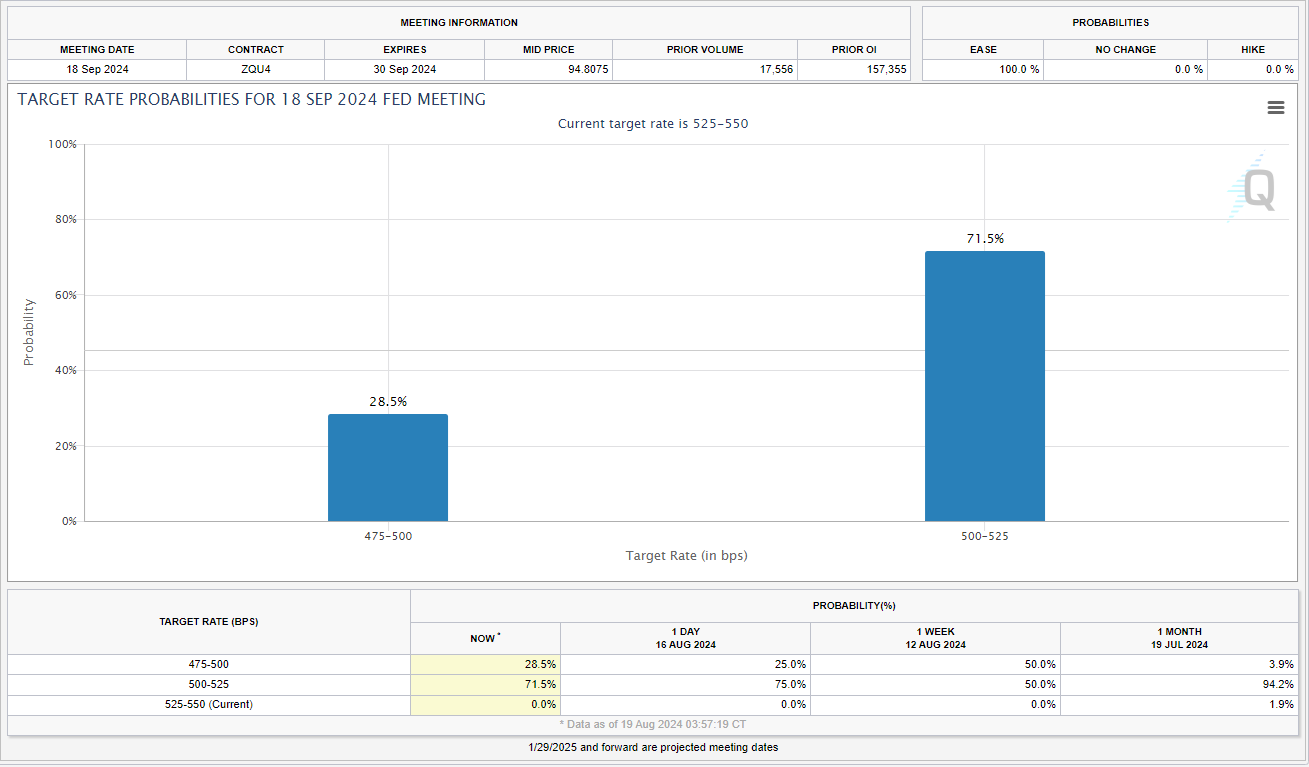
Source: CME FedWatch Tool
Examining the reasons behind the recent rally in gold prices, it primarily stems from dovish remarks made by Federal Reserve policymakers. Chicago Fed President Austin Goolsbee expressed caution about maintaining the restrictive policy for longer than necessary. These comments, along with ongoing concerns regarding a ceasefire deal in the Middle East, are likely driving factors behind the surge in gold prices.
Markets are also uneasy about rising tensions in the Middle East and the potential for an attack on Israel by Iran. Such an event could lead to increased demand for safe-haven assets and might materialize if a ceasefire agreement over Gaza is not achieved.
Technical Analysis Gold (XAU/USD)
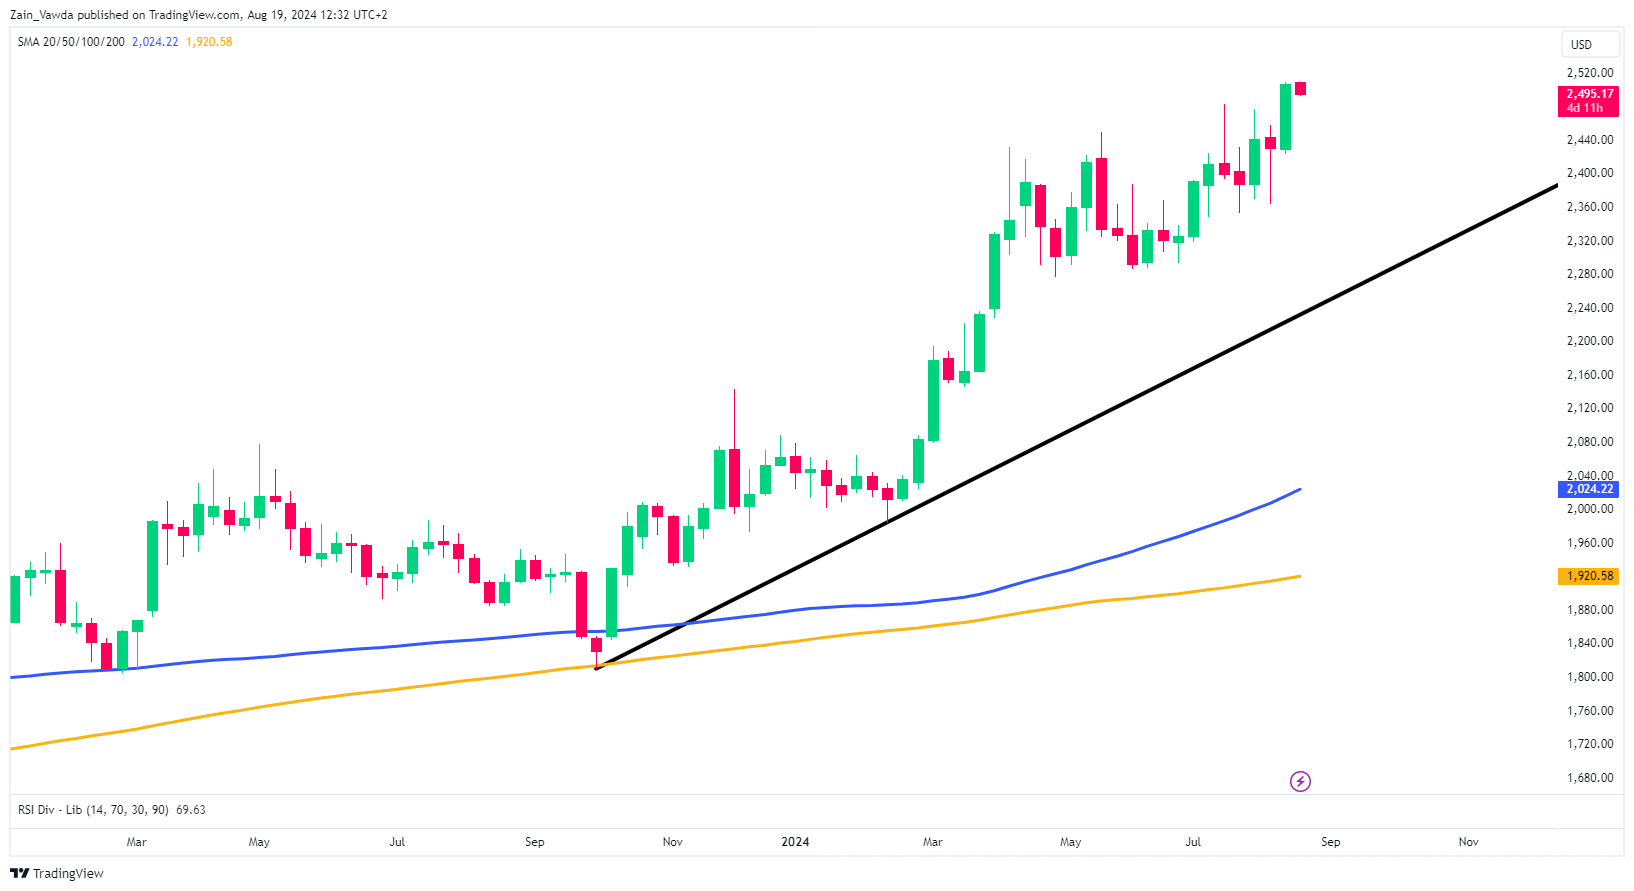
From a technical standpoint, the weekly chart shows that the bullish trend remains strong. However, a retracement towards the 2450 mark is possible and would not negate the bullish outlook, given that the prior swing low is around 2350 on the weekly chart.
Therefore, the current range is substantial, and even a significant pullback might not deter bulls from re-entering long positions if the price corrects sufficiently.
GOLD (XAU/USD) Weekly Chart, August 19, 2024
Source: TradingView (click to enlarge)
Gold formed a morning star candlestick pattern after the daily close on Friday. However, since this pattern emerged following a brief retracement within what might still be considered the peak of an uptrend, its reliability is questionable.
Additionally, the possibility of profit-taking after Friday’s substantial rally suggests that further upward movement could be restricted today, with an increasing chance of a price pullback towards the $2472-2480 range.
GOLD (XAU/USD) Daily Chart, August 19, 2024
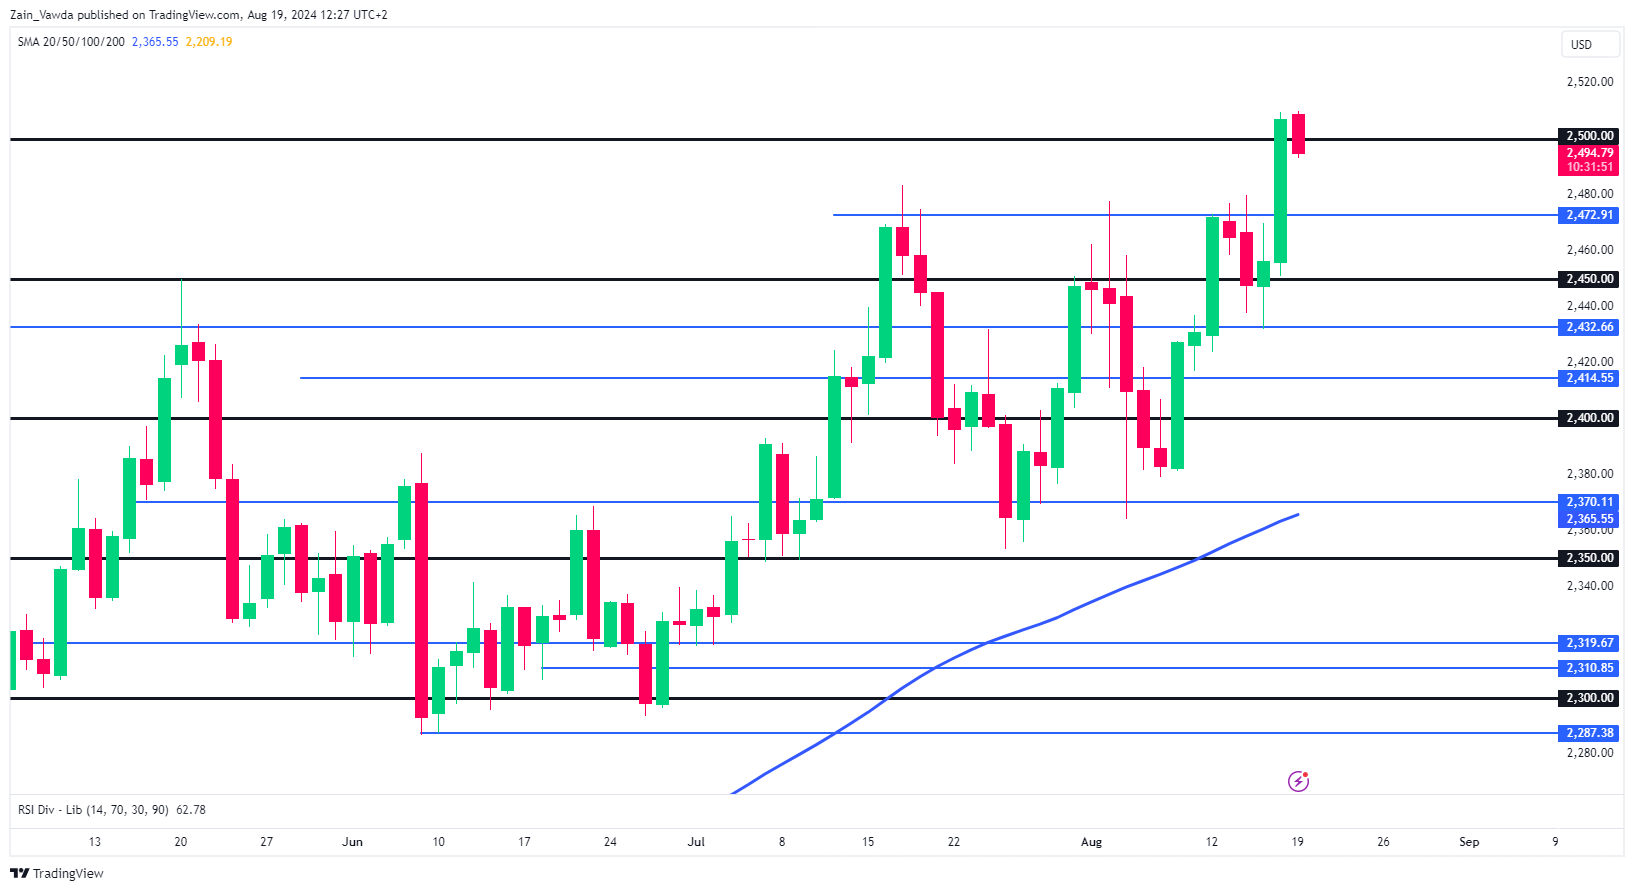
Source: TradingView (click to enlarge)
Support
- 2472
- 2450
- 2432
Resistance
- 2500
- 2509
- 2525