Sample Category Title
Gold Price Surpasses $2500 for the First Time
We noted bullish sentiment in the gold market six days ago:
→ The price is moving within an ascending channel (shown in blue);
→ Bulls may attempt to set a historic record amid the release of economic news.
As today's XAU/USD chart shows, the gold price has risen above the psychological level of $2500. This was influenced by last week's news, indicating that market participants expect the Federal Reserve to cut rates as early as September. Notably, important signals regarding U.S. monetary policy may be given later this week at the annual economic symposium in Jackson Hole, attended by finance ministers and central bank governors.
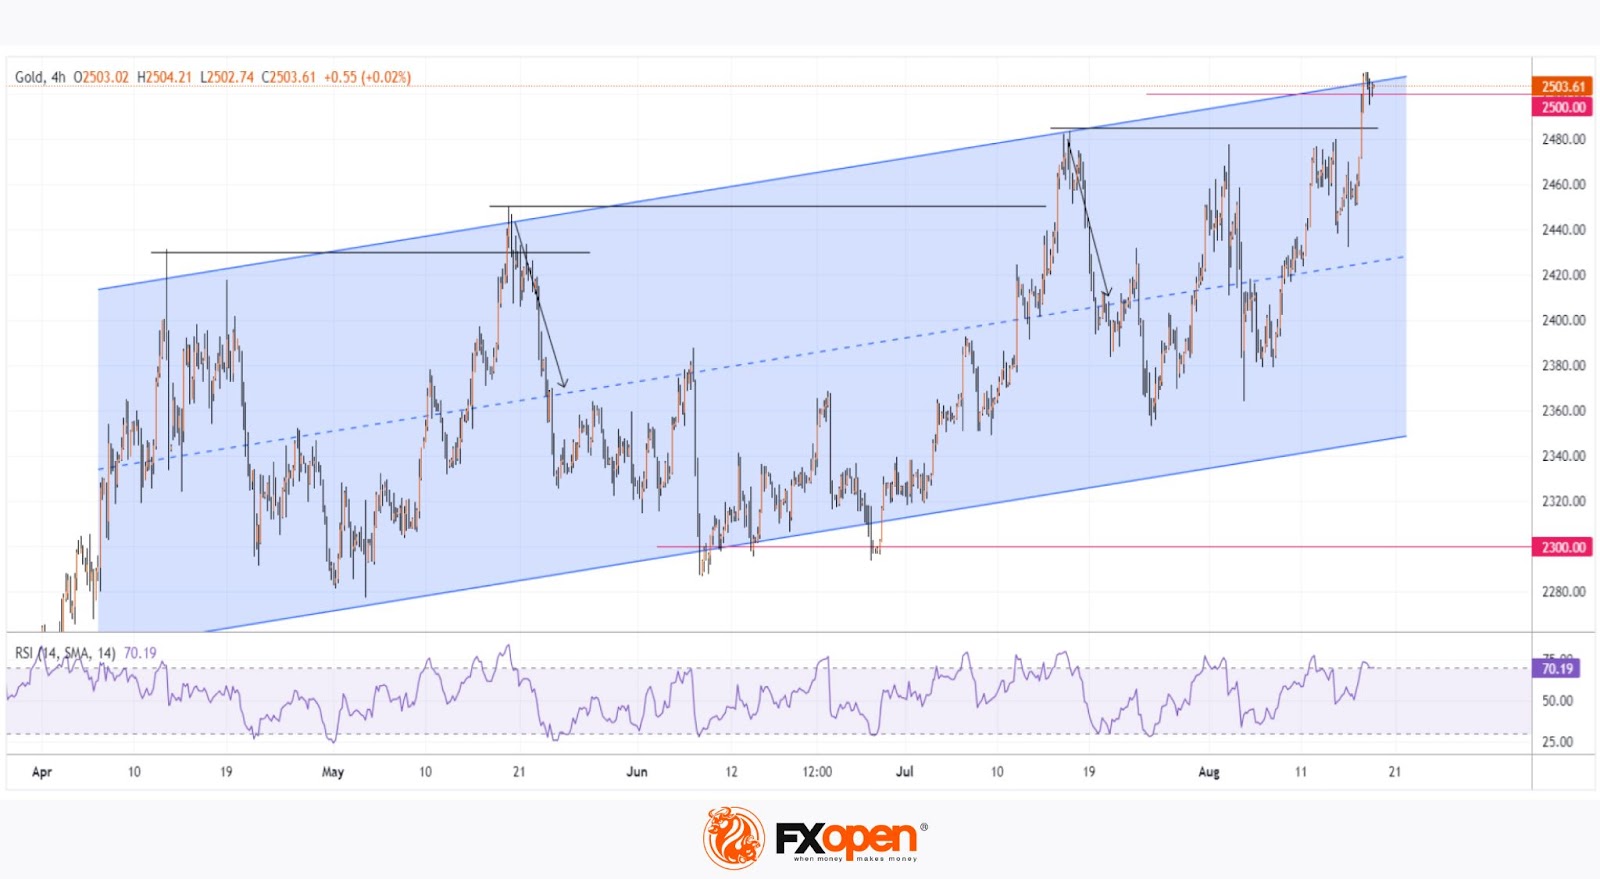
Technical analysis of the XAU/USD chart shows that gold continues to move within the ascending channel.
It's worth noting two historical records set this year – in May and July. In both cases:
→ The price encountered resistance at the upper boundary of the channel;
→ The RSI indicator entered the overbought zone;
→ The rise above the previous peak was minimal;
→ A subsequent decline to the median line of the blue channel followed (as shown by the arrows).
It’s possible that a similar pattern could repeat for a third time, considering that the $2500 psychological level might act in favour of the bears – similar false breakouts (but in reverse) were observed at the $2300 level in June.
Start trading commodity CFDs with tight spreads. Open your trading account now or learn more about trading commodity CFDs with FXOpen.
This article represents the opinion of the Companies operating under the FXOpen brand only. It is not to be construed as an offer, solicitation, or recommendation with respect to products and services provided by the Companies operating under the FXOpen brand, nor is it to be considered financial advice.
USD/JPY Outlook: Japanese Yen Regains Traction vs Dollar on Renewed Expectations for Dovish Fed
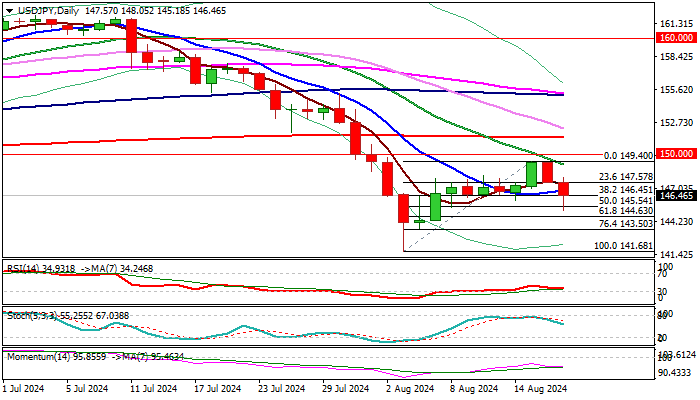
USDJPY dips further on Monday, adding to signals that corrective phase off 141.68 (Aug 5 spike low) is likely over.
Upleg from 141.68 was repeatedly capped at pivotal Fibo barrier at 149.36 (38.2% retracement of 161.80/141.68) with subsequent weakness being sparked by renewed risk appetite.
Yen also appreciates on signals that gap between policies of two central banks (Fed and BOJ) may widen further, as dovish tones returned expectations for Fed’s next steps on monetary policy while Japanese central bank keeps hawkish stance.
Markets focus on two key events of the week – FOMC Minutes of the last policy meeting and speech of Fed Chair Powell in Jackson Hole symposium, which should provide clearer signals about Fed’s next steps (25 bp rate cut in September is widely expected, but renewed narrative of 50 bp easing, adds to expectations for more dovish Fed’ stance, which will further deflate the dollar.
Daily studies are turning into full bearish configuration following today’s breach of 10 DMA (146.93) and probe below 50% retracement of 141.68/149.40 corrective leg), while negative momentum remains strong and RSI / Stochastic head south.
Daily close below 10DMA is required to keep fresh bears in play, while sustained break of 145.51 (50% retracement) to boost bearish signals for extension towards next target at 144.63 and 143.50 (Fibo 61.8% and 76.4% respectively).
Res: 146.94; 147.58; 148.05; 148.22.
Sup: 145.54; 145.18; 144.63; 143.50.
Dollar Index Outlook: Remains in Defensive on Growing Expectations for Dovish Fed’s Policy View
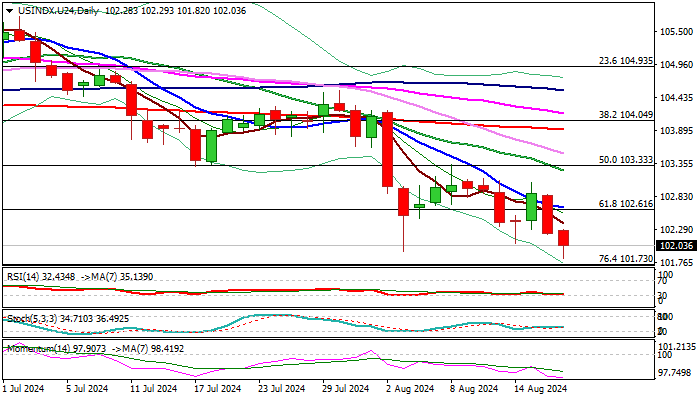
The dollar index remains firmly in red in early Monday trading, and extends Friday’s 0.93% drop, to breach key support at 101.94 (Aug 5 low, the lowest in eight months).
The dollar was weaker across the board on renewed risk mode and growing expectations on more dovish stance by the US central bank on two key events this week- FOMC Minutes on Wednesday and speech of Fed Chair Powell on Jackson Hole symposium of central bankers on Friday.
Traders fully priced in a 25 basis points Fed rate cut in September, while bets for 0.5% cut started to rise again that adds pressure on the US currency.
Firm break of 101.94 pivot to signal continuation of larger downtrend, with violation of nearby Fibo support at 101.73 (76.4% of 100.29/106.36) to confirm the signal and unmask targets at 100.29/00 (Dec 2023 low/psychological).
Falling daily Tenkan-sen / broken Fibo 61.8% offer strong resistance at 102.60 zone, followed by barriers at 103.10 zone (Aug 13/15 double-top) which should cap extended upticks.
Res: 102.39; 102.65; 103.10; 103.33.
Sup: 101.82; 101.73; 101.01; 100.29.
RBA’s Bullock Says No Rate Cuts Coming, Aussie Soars
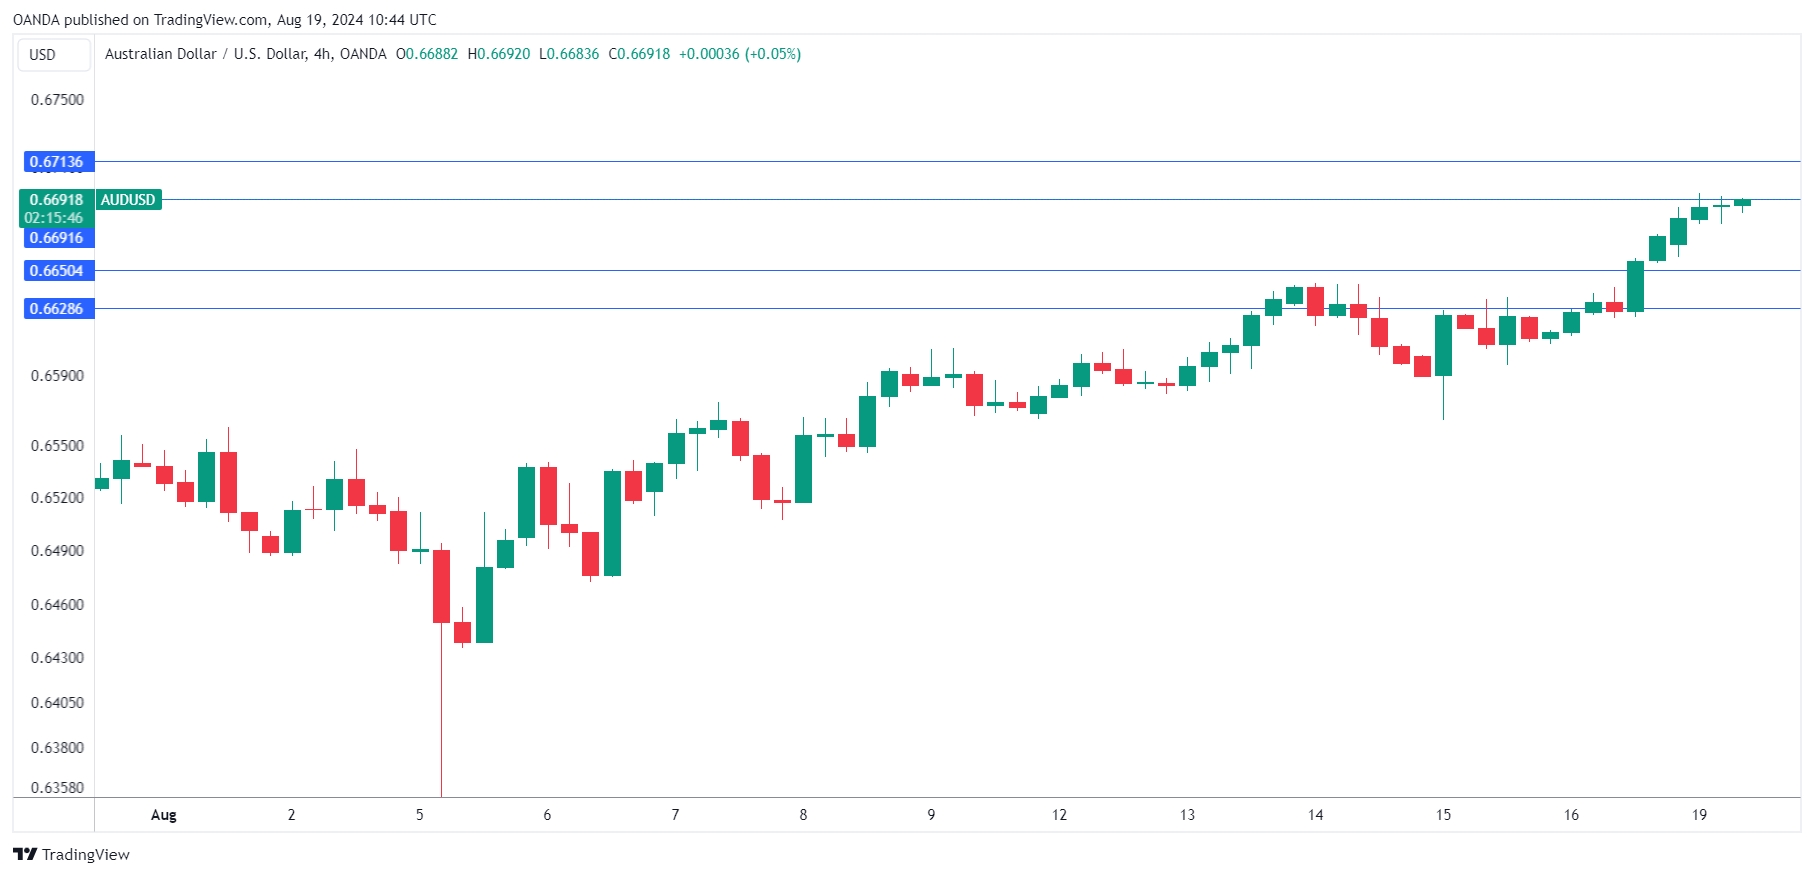
The Australian dollar has started the week with slight gains. AUD/USD is trading at 0.6685 in the European session, up 0.24% on the day at the time of writing. Earlier today, the Australian dollar rose as high as 0.6694, marking a one-month high.
Will RBA minutes shake up the Aussie?
Hawkish remarks from Reserve Bank of Australia’s Governor Bullock sent the Aussie flying on Friday. Bullock reiterated that there would be no interest rate cuts in the “near term”. Bullock used the same language after the meeting on August 6 and when she clarified that this meant a period of at least six months, the Australian dollar responded with strong gains. The RBA statement at the meeting expressed the Bank’s frustration that inflation remains too high and is coming down slower than the central bank had expected.
Will we gain any insights from Tuesday’s RBA minutes release? The minutes will indicate that the Board discussed the possibility of a rate hike, but that isn’t really news since the Board did the same thing at the previous two meetings. If the minutes show that the RBA has little appetite for a rate cut, that could send the Australian dollar lower as the markets are at odds with Bullock’s hawkish message.
The markets have fully priced in a rate cut of 25 basis points in November and expect further cuts early in 2025. The rate statement noted that inflation remained too high and was coming down slower than expected.
China will announce its loan prime rates (LPR) on early Tuesday. A month ago, China’s central bank surprised the markets and lowered the rates for the one-year and five-year LPRs for the first time in close to a year. The central bank is expected to maintain the one-year LPR at 3.35% and the five-year loan rate at 3.85%.
AUD/USD Technical
- AUD/USD is testing resistance at 0.6691. Close by, there is resistance at 0.6713
- 0.6650 and 0.6628 are the next support levels
Crypto Market Attracts Money, But Prices Don’t Rise
Market Picture
On Monday morning, the crypto market capitalisation stood at $2.07 trillion, up slightly from $2.05 trillion a week earlier. In the previous two weeks, the market failed to rally above the $2.15 trillion level, which has become a local resistance. The weakness in the crypto market undermines our confidence in a global recovery in risk appetite, even though last week was the strongest week for US equity indices in many months.
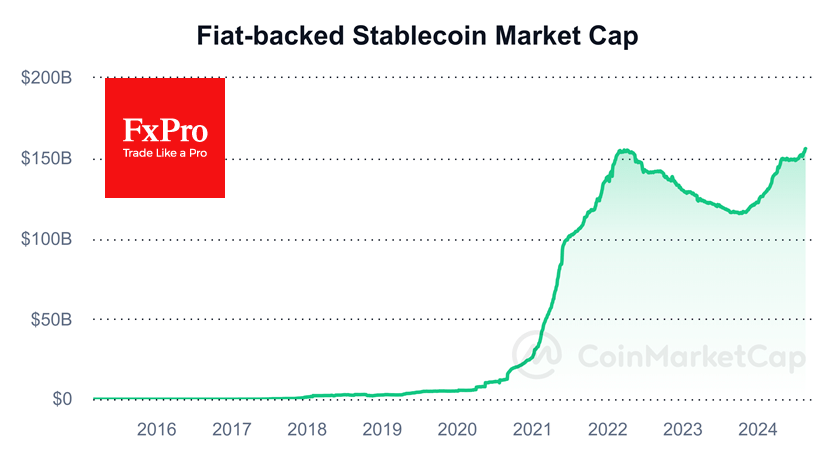
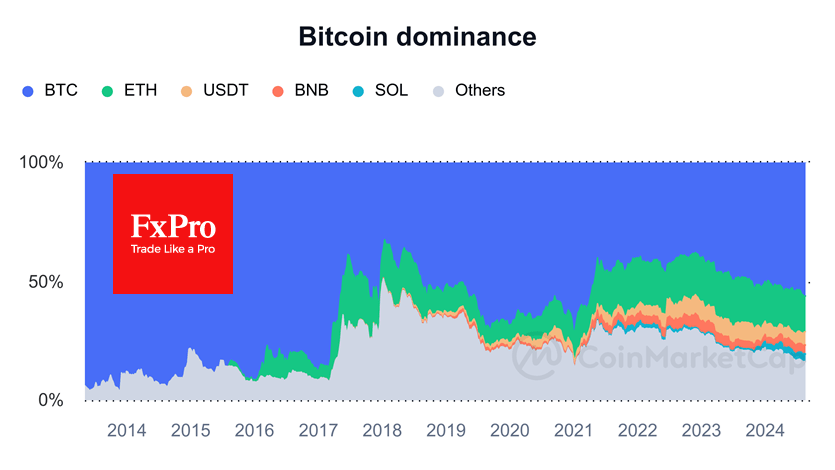
Interestingly, the sell-off from local resistance in the crypto market over the past two weeks has been accompanied by a surge in stablecoin capitalisation to new records after a prolonged sideways period from April to the end of July. Typically, the growth in stablecoin volume coincides with the bullish phase of the market. The crypto whales buy on dips, and it is clear from Bitcoin’s dominant dynamics that their focus remains on the first cryptocurrency, whose market share has risen to 56.5% – the highest since April 2021.
Litecoin’s dynamics illustrate what is happening in cryptos, except for the largest coins. Again, it’s mostly selling on growth. Litecoin fell sharply below its 50-day moving average in April and has been selling off on approaches to this line for the past four months. On Sunday, this downtrend touched again at around $67. An intensification of the negative trends could send the price to $56 (the area of the previous uptrend reversal) or even trigger a major liquidation with a slip below $50.

News background
According to SoSoValue, the spot bitcoin-ETFs saw modest total inflows of $32.6 million last week after two weeks of outflows. In contrast, the Ethereum-ETF saw net outflows of $14.2 million last week, with net outflows of $0.42 billion since the products were approved, compared to $17.37 billion for Bitcoin ETFs.
According to Bitcoin Magazine, nearly 75% of all Bitcoins in circulation have been inactive for more than six months, reflecting a hoarding trend. Factor LLC CEO Peter Brandt said Ethereum on the four-hour chart is ‘signalling’ a possible drop to $2,000 or even lower.
Bernstein gave shares of mining companies Riot Platforms, CleanSpark, IREN and Core Scientific an Outperform rating on the market. The IMF proposed an 85% increase in energy tariffs for bitcoin miners globally, which could significantly reduce carbon emissions.
Artificial intelligence-related crypto projects could fail due to the potential ‘collapse of the bubble’ in the sector, according to Blockcircle. AI in cryptocurrency is ‘largely fashionable,’ although there has been little real-world application of neural networks in the crypto sphere.
The absence of US Democratic presidential candidate Kamala Harris from the Crypto for Harris event has led the community to question her support for the crypto industry.
Chainalysis noted that attackers stole cryptos worth nearly $1.6 billion in the first half of the year, increasingly targeting centralised exchanges (CEX). The figure nearly doubled compared to the same period in 2023.
EUR/USD Outlook: Break Above 1.1000 Adds to Bullish Outlook, Limited Dips Should Be Anticipated
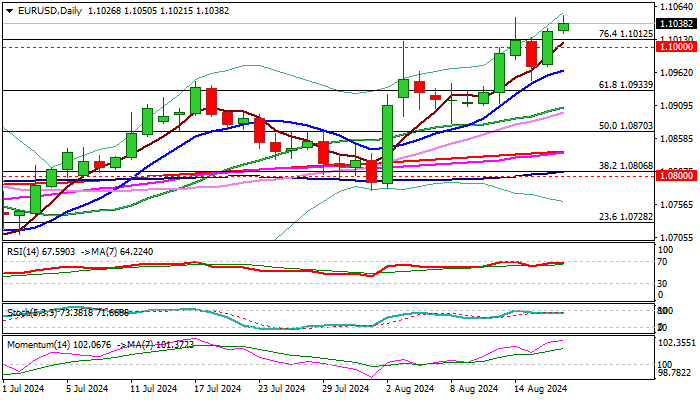
EURUSD keeps firm tone at the start of the week and extends gains above psychological 1.10 barrier after registering a weekly close above this level for the first time since late December.
Bulls also cleared a Fibo resistance at 1.1012 (76.4% retracement of 1.1139/1.0601), adding to bullish stance.
Falling 200WMA (1.1063) is in focus, with break here to generate fresh bullish signal and open way for push through 1.1100 and attack at December’s peak at 1.1139.
Technical studies remain in full bullish setup on daily chart, but overbought conditions and fading bullish momentum on weekly chart warn of increased headwinds that bulls may face on approach to 200WMA barrier.
Broken 1.10 pivot reverted to solid support which should ideally keep the downside protected, with deeper dips to find firm ground above rising 10DMA (1.0965) to keep bulls in play and provide better levels to re-enter bullish market.
Res: 1.1050; 1.1063; 1.1100; 1.1139.
Sup: 1.1021; 1.1000; 1.0965; 1.0933.
Gold Surges to Fresh Record High
- Gold posts new all-time high on Monday
- But oscillators haven’t reached overbought conditions
- The divergence suggests that the advance may extend further
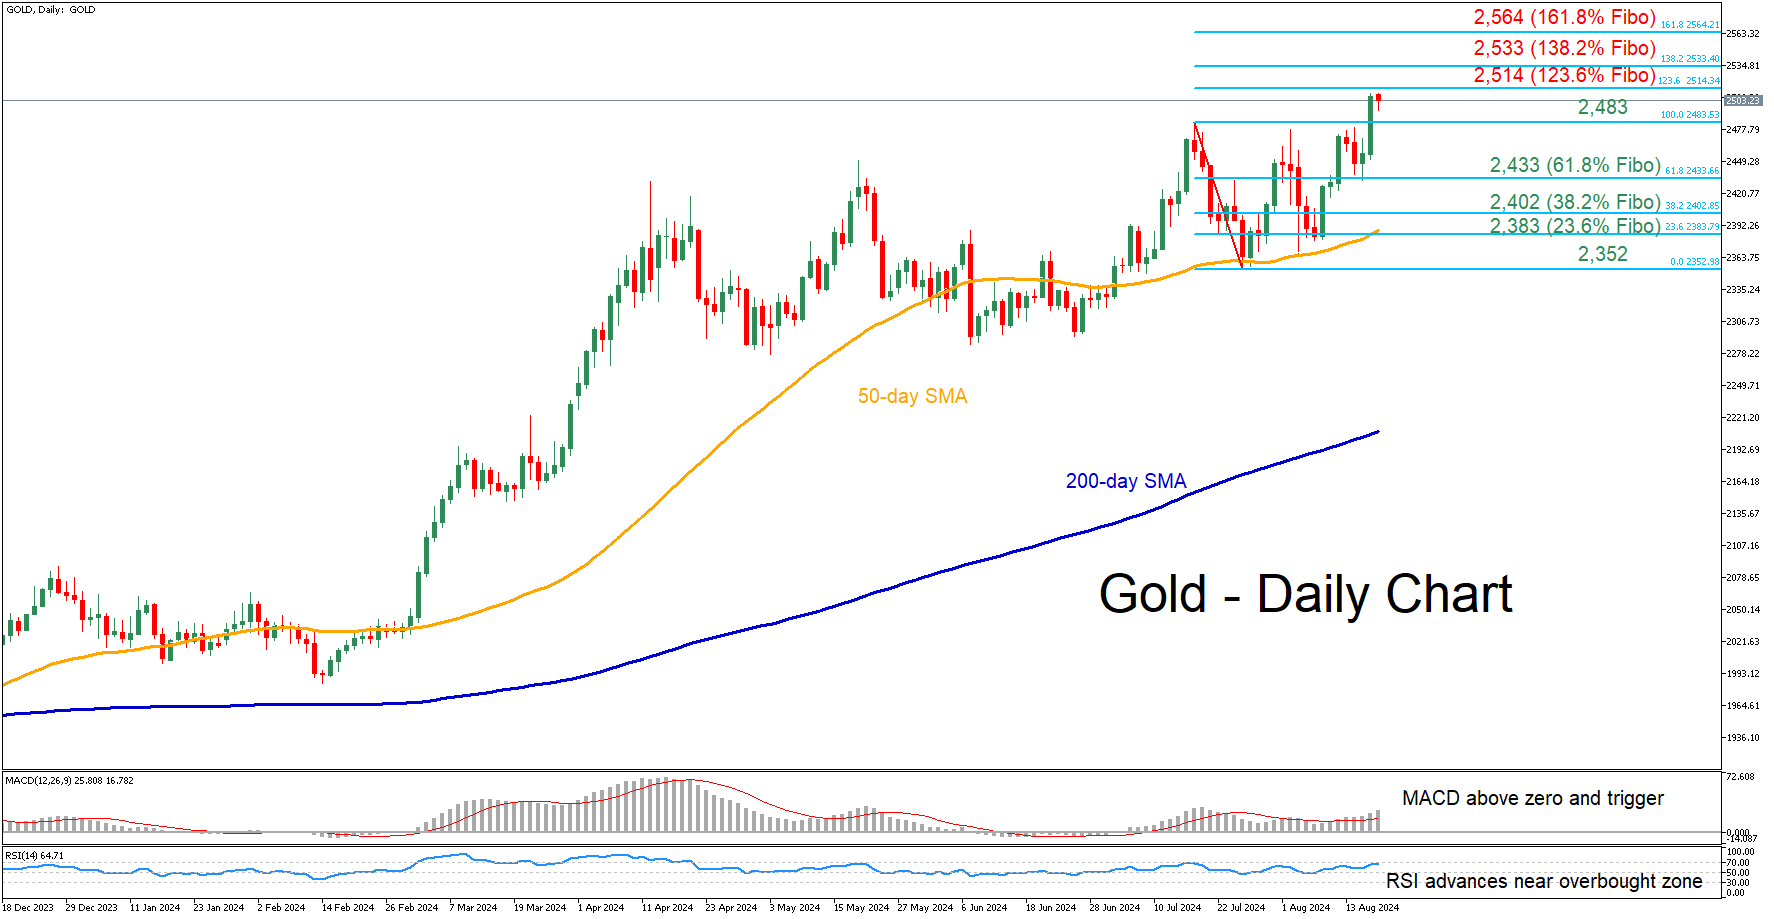
Gold has been on the rise in the past couple of sessions, storming above the 2,500 psychological mark to a fresh record high on Monday. The latest rally could extend further given that the momentum indicators have not yet entered their overbought territories.
Should the recent uptick extend further, the bulls may attack 2,514, which is the 123.6% Fibonacci extension of the July 2,483 - 2,352 downleg. A decisive break above that zone could set the stage for the 138.2% Fibo of 2,533. Failing to stop there, bullion may advance to test the 161.8% Fibo of 2,564.
Alternatively, in the case of a downside reversal, immediate support could be found at the July peak of 2,483. Further declines could then cease at the 61.8% Fibo of 2,433, a region that also provided support in August. Even lower, the 38.2% Fibo of 2,402 could curb gold’s downside.
In brief, gold posted a fresh all-time high in today’s session before paring some gains. However, the advance could resume considering that the short-term oscillators have not yet shown any signs of a rally exhaustion.
US 500 Index Slips After 10% Recovery
- US 500 index rises above long-term uptrend line
- 200-day SMA still holds well
- Stochastic and RSI indicate overstretched market
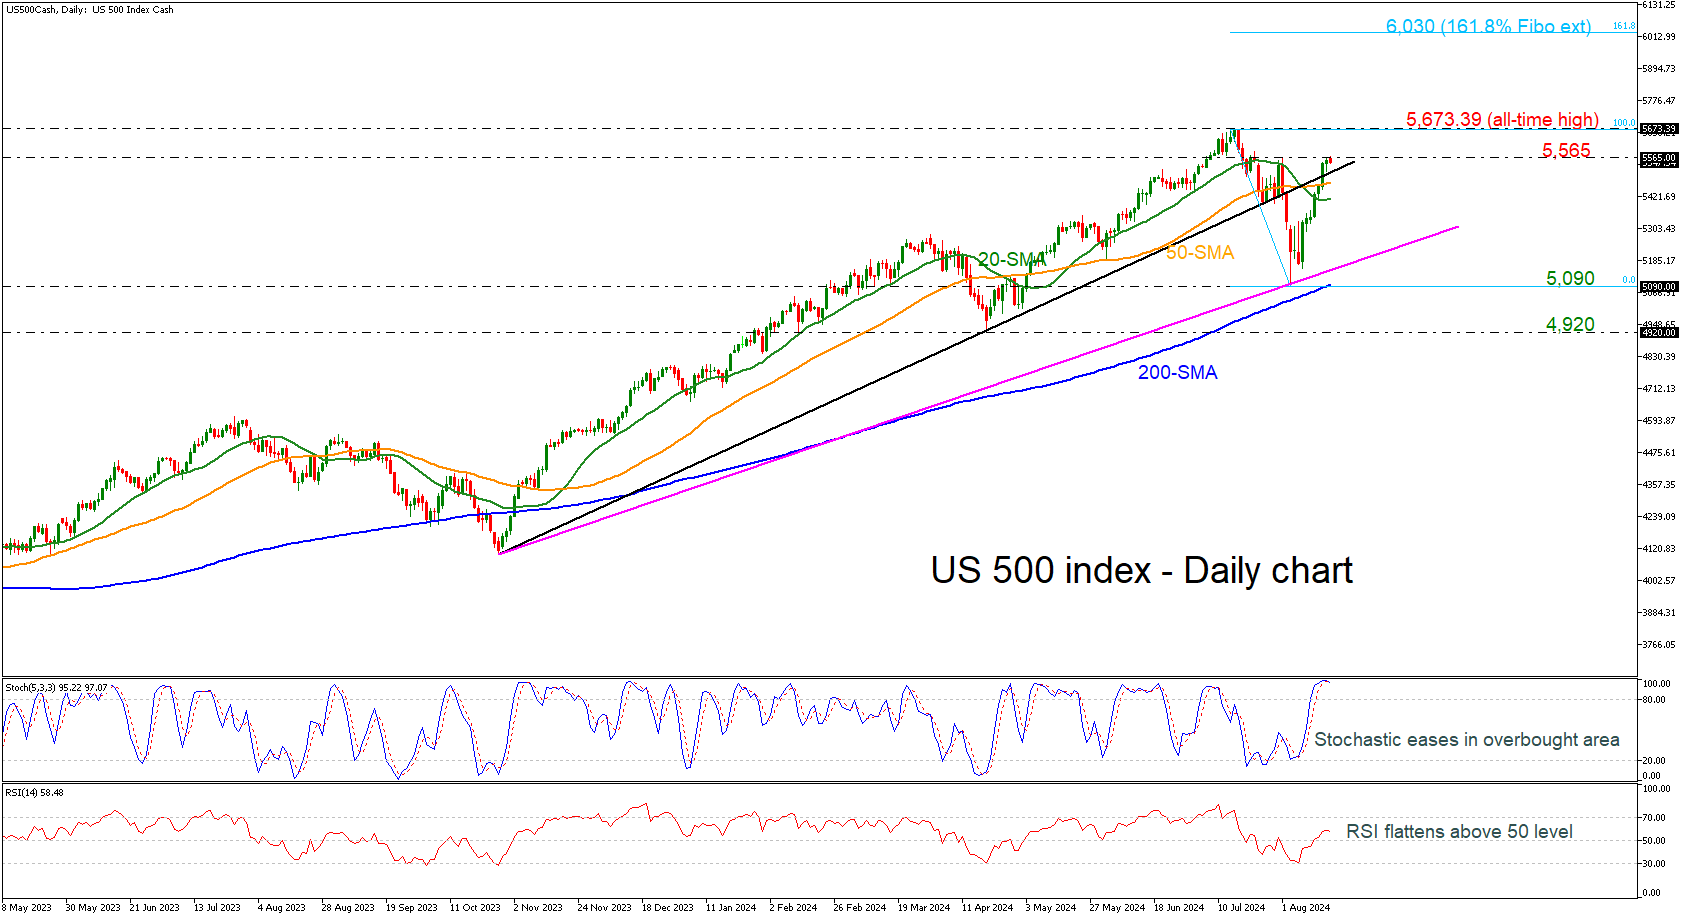
The US 500 cash index recovered by almost 10% from the bearish wave that started from the all-time high of 5,673.39 and is currently returning to a position above the long-term ascending trend line. The index found strong support at the 2,090 support level, which stands near the 200-day simple moving average (SMA).
Technically, the price is hovering above the short-term SMAs, but the momentum oscillators indicate an overstretched market with a potential downside retracement again. In the overbought area, the stochastic posted a bearish crossover within its %K and %D lines, while the RSI is ticking south above the 50 level.
If price action rises above the immediate resistance of 5,565, there is potential for it to test the record peak of 5,673.39. Rising above that point, the next round numbers, such as 5,800 and 5,900, could be significant resistance levels before hitting the 161.8% Fibonacci extension level of the downward wave from 5,673.39 to 5,090 at 6,030.
On the flip side, a successful dive beneath the uptrend line could meet the 50- and then the 20-day SMAs at 5,478 and 5,412 respectively before plunging to the 200-day SMA near 5,090.
As the market holds above the 200-day SMA the broader outlook is looking bullish. Near-term weakness is expected to remain as long as technical oscillators show negative signs.
GBP/JPY Daily Outlook
Daily Pivots: (S1) 190.26; (P) 191.19; (R1) 191.99; More...
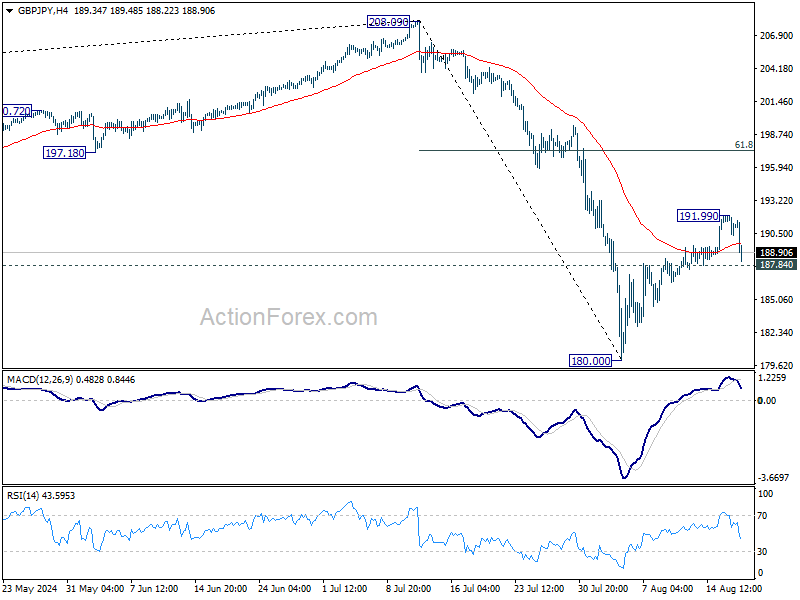
Intraday bias in GBP/JPY remains neutral for the moment. On the upside, above 191.99 will target 61.8% retracement of 208.09 to 180.00 at 197.35, as the second leg of the corrective pattern from 208.09. On the downside, however, break of 187.84 minor support will turn bias back to the downside for retesting 180.00 instead.
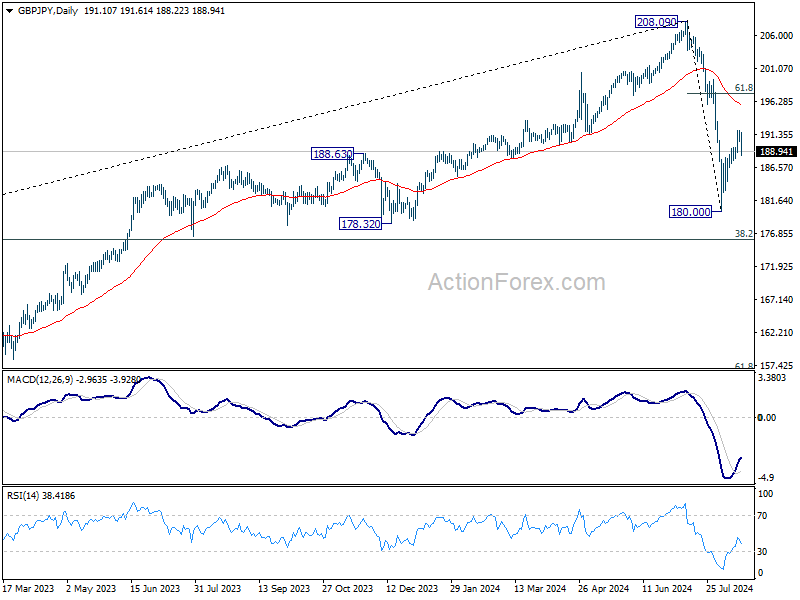
In the bigger picture, price actions from 208.09 are seen as a correction to whole rally from 123.94 (2020 low). Current development suggests that the first leg has completed and the range of medium term consolidation should be set between 38.2% retracement of 123.94 to 208.09 at 175.94 and 208.09.
EUR/JPY Daily Outlook
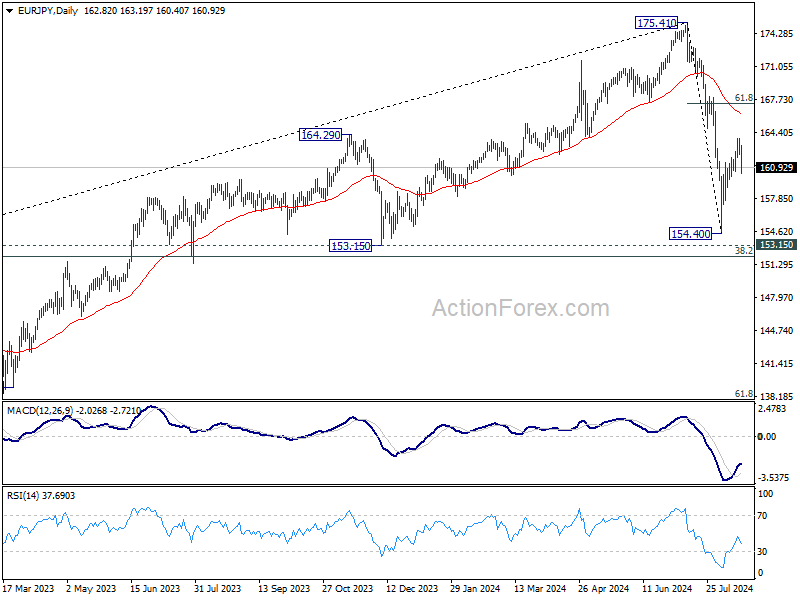
Daily Pivots: (S1) 162.14; (P) 162.99; (R1) 163.68; More...
Intraday bias in EUR/JPY remains neutral for the moment. On the upside, break of 163.86 will target 61.8% retracement of 175.41 to 154.40 at 167.38, as the second leg of the corrective pattern from 175.41. On the downside, below 160.57 minor support will turn bias back to the downside for 154.40 instead.
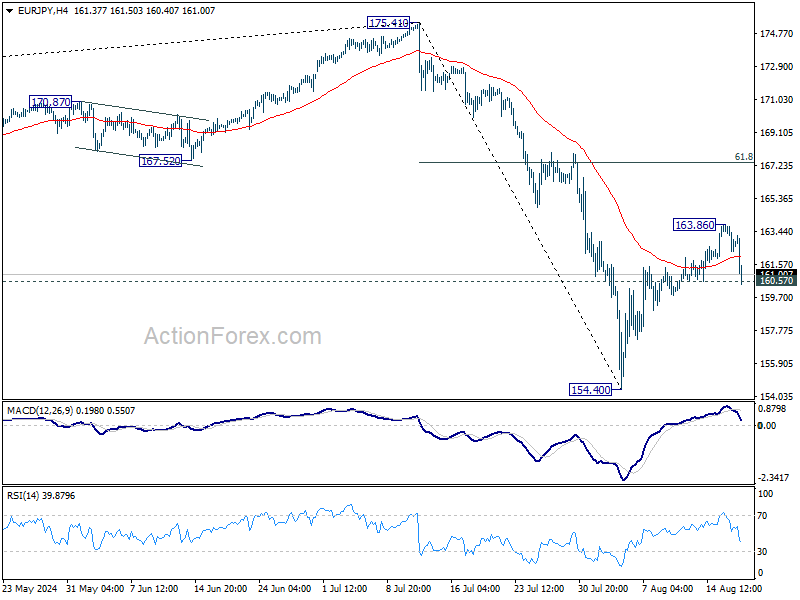
In the bigger picture, price actions from 175.41 are seen as correction to rally from 114.42 (2020 low). Current development suggests that the first leg has completed. The range of consolidation should be seen between 38.2% retracement of 114.42 to 175.41 at 152.11 and 175.41 high.