

Sample Category Title
USD/JPY Mid-Day Outlook
Daily Pivots: (S1) 147.76; (P) 148.58; (R1) 150.09; More...
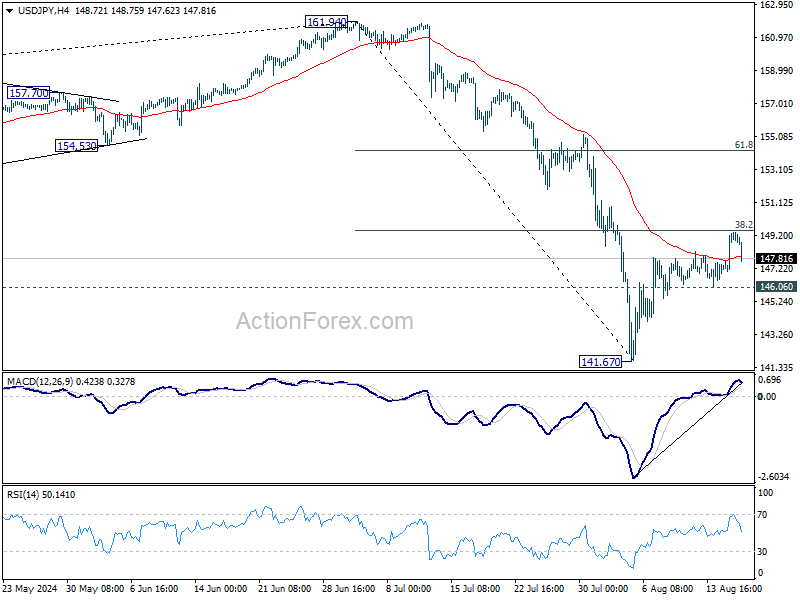
Intraday bias in USD/JPY is turned neutral as it retreated after failing to break through 38.2% retracement of 161.94 to 141.67 at 149.41. On the downside, break of 146.06 minor support will suggest rejection by 149.91, and turn intraday bias back to the downside for retesting 141.67 low instead. On the upside, sustained break of 149.41 will extend the rebound to 61.8% retracement at 154.19, as the second leg of the corrective pattern from 161.94.
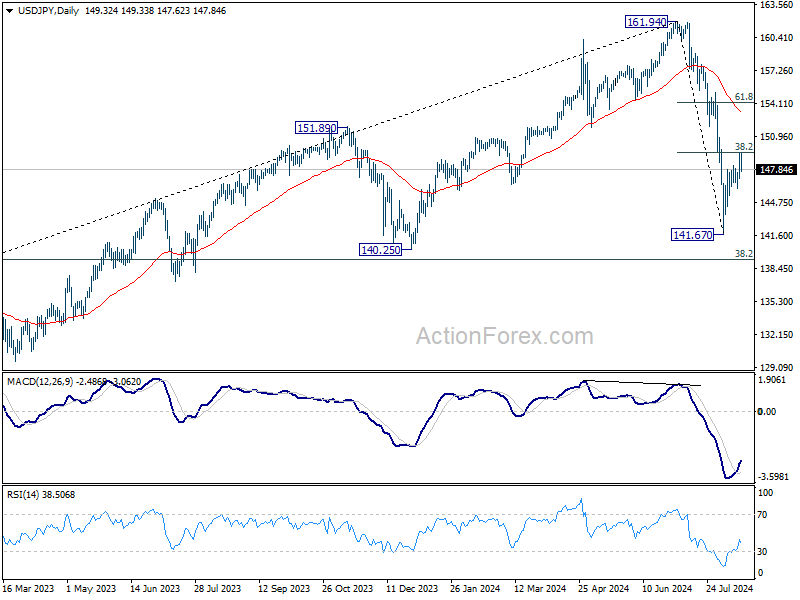
In the bigger picture, fall from 161.94 medium term is seen as correcting whole up trend from 102.58 (2021 low). Deeper decline could be seen to 38.2% retracement of 102.58 to 161.94 at 139.26, which is close to 140.25 support. In any case, risk will stay on the downside as long as 55 W EMA (now at 149.77) holds. Nevertheless, firm break of 55 W EMA will suggest that the range for medium term corrective pattern is already set.
Yen and Swiss Franc Recover as Benchmark Yields Ease
As the US session gets underway, both Yen and Swiss Franc are beginning to recover, aided by the slight pullback in benchmark Treasury yields in the US and Europe. This recovery comes after a tough week for the two safe-haven currencies, which have been the worst performers amid broad risk-on sentiment. Despite today's gains, Yen and Swiss Franc still face an uphill battle to reverse their losses and end the week on a positive note.
British Pound, on the other hand, continues to show strength, particularly against Dollar and Euro. Sterling was supported by data showing rebound in retail sales, even that slightly missed expectations. Overall, this week's slew of data didn't add too much evidence to convince BoE to continue with another rate cut at next meeting. Meanwhile, commodity currencies like the Australian and Canadian Dollars have had a more subdued performance.
The final positions for these currencies as the week closes may be influenced by the upcoming University of Michigan consumer sentiment and inflation expectation data, and their impact of risk sentiment.
In Europe, at the time of writing, FTSE is down -0.62%. DAX is up 0.33%. CAC is flat. UK 10-year yield is down -0.0119 at 3.914. Germany 10-year yield is down -0.036 at 2.229. Earlier in Asia, Nikkei surged 3.64%. Hong Kong HSI rose 1.88%. China Shanghai SSE rose 0.07%. Singapore Strait Times rose 1.12%. Japan 10-year JGB yield rose 0.0372 to 0.875.
Eurozone goods exports fall -6.3% yoy in Jun, goods imports down -8.6% yoy
Eurozone goods exports fell -6.3% yoy to EUR 236.7B in June. Goods imports fall -8.6% yoy to EUR 214.3B. Trade balance showed a EUR 22.3B surplus. Intra-Eurozone trade fell -8.5% yoy to EUR 214.5B.
In seasonally adjusted term, goods exports fell -0.2% mom to EUR 236.2B. Goods imports fell -2.4% mom to EUR 218.7B. Trade surplus widened from EUR 12.4B in the prior month to EUR 17.5B, larger than expectation of EUR 14.5B. Intra-Eurozone trade rose 0.4% mom to EUR 210.7B.
UK retail sales rises 0.5% mom in Jul, vs exp 0.6% mom
UK retail sales volumes rose by 0.5% mom in July, slightly below market expectations of 0.6% increase. On a broader scale, sales volumes in the three months leading up to July saw a 1.1% rise compared to the previous three months ending in April.
Breaking down the data, non-food stores—which include department, clothing, household, and other non-food stores—saw a notable 1.4% increase in sales volumes. Non-store retail sales, which encompass online and other forms of retail not conducted in physical stores, rose by 0.7%, driven primarily by a rebound in retailers other than mail order services. However, the overall growth was tempered by a -1.9% decline in automotive fuel sales volumes.
RBA's Bullock dismisses near-term rate cut expectations
In her remarks to the House of Representatives' economics committee, RBA Governor Michele Bullock emphasized the careful balancing act in managing inflation while minimizing harm to the labor market. Bullock reiterated that the Board believes current monetary policy is "sufficiently restrictive" to bring inflation down over a reasonable timeframe without causing undue damage to employment.
Despite financial markets anticipating a rate cut by the end of the year, Bullock was clear in her message that it is "premature to be thinking about rate cuts" at this stage. She pointed out that inflation remains too high and, in underlying terms, is not expected to fall back within the target range until the end of next year.
While acknowledging that economic circumstances could change, Bullock firmly stated that, based on the current outlook, the Board "does not expect that it will be in a position to cut rates in the near term."
RBNZ confident in inflation outlook, emphasizes measured approach to further rate cuts
In a speech today, RBNZ Governor Adrian Orr expressed a "very strong level of confidence" that forward indicators are pointing to a return to low and stable inflation, within the target range of 1% to 3%. Orr emphasized the importance of keeping inflation expectations and pricing intentions "anchored" as the central bank continues to monitor economic conditions.
Assistant Governor Karen Silk, speaking in a separate interview, noted that RBNZ is observing a continued decline in price and wage-setting behaviors. Silk mentioned that if this adjustment occurs more rapidly than anticipated, it could open the door for the central bank to consider a different, potentially faster path for rate cuts.
Earlier this week, RBNZ lowered the OCR by 25 bps to 5.25% and projected that it would fall below 4% by the end of 2025. Silk reiterated that RBNZ is taking a "measured approach" to policy loosening and remains committed to a data-dependent strategy.
New Zealand BNZ manufacturing rises to 44, 17th month of contraction
New Zealand's manufacturing sector showed a slight improvement in July, with the BusinessNZ Performance of Manufacturing Index rising from 41.2 to 44.0. Despite this rebound, the sector remains deeply entrenched in contraction, marking its 17th consecutive month below the expansion threshold. The current level is still significantly below the long-term average of 52.6.
Breaking down the data, production saw an uptick, increasing from 35.7 to 43.4, while new orders also rose, moving from 39.0 to 42.5. However, employment in the sector continued to decline, slipping from 44.0 to 43.1. Finished stocks decreased from 47.7 to 46.5, and deliveries fell slightly from 44.8 to 44.3.
Despite the relative improvement in activity, the proportion of negative comments from respondents remained high, though it eased slightly to 71.1% in July from 76.3% in June. Businesses cited ongoing issues such as a lack of orders, customers, and sales, which have been persistent concerns in recent months.
BNZ's Senior Economist Doug Steel commented that "manufacturing activity will turn when the broader economy turns." He added that easing monetary conditions, including a lower OCR, could help stimulate a general pick-up in sales, but emphasized that this recovery would take time.
USD/JPY Mid-Day Outlook
Daily Pivots: (S1) 147.76; (P) 148.58; (R1) 150.09; More...
Intraday bias in USD/JPY is turned neutral as it retreated after failing to break through 38.2% retracement of 161.94 to 141.67 at 149.41. On the downside, break of 146.06 minor support will suggest rejection by 149.91, and turn intraday bias back to the downside for retesting 141.67 low instead. On the upside, sustained break of 149.41 will extend the rebound to 61.8% retracement at 154.19, as the second leg of the corrective pattern from 161.94.
In the bigger picture, fall from 161.94 medium term is seen as correcting whole up trend from 102.58 (2021 low). Deeper decline could be seen to 38.2% retracement of 102.58 to 161.94 at 139.26, which is close to 140.25 support. In any case, risk will stay on the downside as long as 55 W EMA (now at 149.77) holds. Nevertheless, firm break of 55 W EMA will suggest that the range for medium term corrective pattern is already set.
Economic Indicators Update
| GMT | Ccy | Events | Actual | Forecast | Previous | Revised |
|---|---|---|---|---|---|---|
| 22:30 | NZD | Business NZ PMI Jul | 44 | 41.1 | 41.2 | |
| 22:45 | NZD | PPI Input Q/Q Q2 | 1.40% | 0.50% | 0.70% | |
| 22:45 | NZD | PPI Output Q/Q Q2 | 1.10% | 0.60% | 0.90% | 0.80% |
| 04:30 | JPY | Tertiary Industry Index M/M Jun | -1.30% | 0.30% | -0.40% | 0.60% |
| 06:00 | GBP | Retail Sales M/M Jul | 0.50% | 0.60% | -1.20% | |
| 09:00 | EUR | Eurozone Trade Balance (EUR) Jun | 17.5B | 14.5B | 12.3B | 12.4B |
| 12:15 | CAD | Housing Starts Jul | 280K | 245K | 242K | |
| 12:30 | CAD | Manufacturing Sales M/M Jun | -2.10% | -2.50% | 0.40% | |
| 12:30 | USD | Building Permits Jul | 1.40M | 1.44M | 1.45M | |
| 12:30 | USD | Housing Starts Jul | 1.24M | 1.34M | 1.35M | |
| 14:00 | USD | Michigan Consumer Sentiment Index Aug P | 67.3 | 66.4 |
AUD/USD Climbs as RBA Maintains Firm Stance on Interest Rates
The Australian dollar (AUD) is witnessing a rise against the US dollar (USD) for the second consecutive day, reaching 0.6629. This upward movement is bolstered by the Reserve Bank of Australia's (RBA) current policy stance. RBA Governor Michelle Bullock emphasized today that discussions on interest rate cuts are premature despite some easing in inflationary pressures.
Inflation, according to Governor Bullock, remains uncomfortably high, with expectations for it to settle within the target range of 2-3% only towards the end of next year. This viewpoint underpinned the RBA's decision last week to maintain the official cash rate at 4.35%, marking the sixth consecutive hold. The RBA cites ongoing economic stability and persistent inflation risks as key reasons for their cautious approach.
This stance starkly contrasts with other major central banks, including the Reserve Bank of New Zealand (RBNZ), which have been more open to adjusting rates. However, the RBA's consistent and factual communication strategy has minimized speculative market reactions, contributing to a more stable forex forecast for the AUD.
Technical analysis of AUD/USD
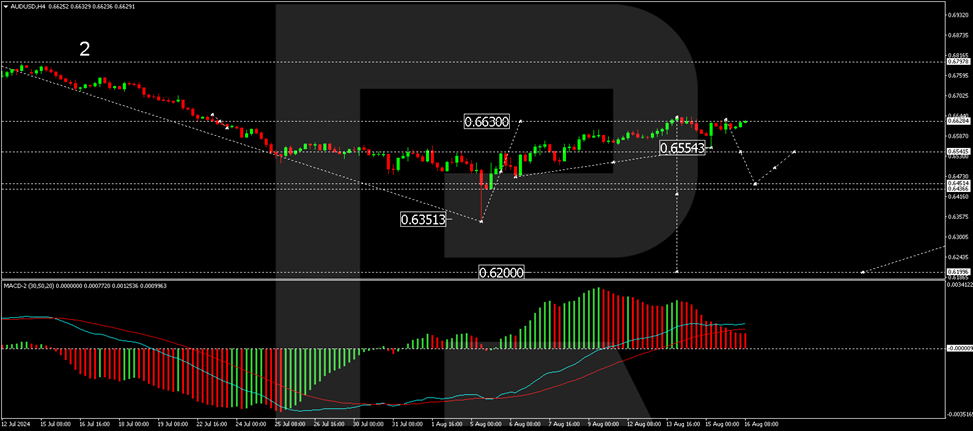
The AUD/USD pair has reached a peak at 0.6640 and is now showing signs of consolidating below this level. Should the pair break downwards from this consolidation, a decline to 0.6450 could be anticipated. Following this potential drop, a rebound to 0.6545 for a retest from below might occur before a further descent towards 0.6200. This bearish outlook is supported by the MACD indicator, which shows the signal line retreating from highs and gearing towards a downturn.
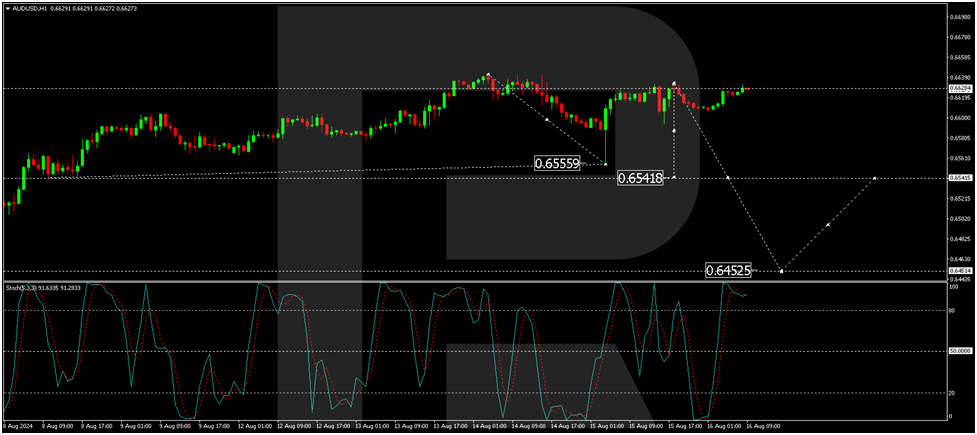
On the hourly chart, after a decline to 0.6555, the AUD/USD pair corrected upwards to 0.6628. A consolidation below this level is expected, which could lead to a new downward wave aiming for 0.6540. This bearish prediction aligns with the Stochastic oscillator readings, where the signal line is poised to move from above 80 downwards to 20, indicating potential selling pressure ahead.
Euro Edges Higher, US Dollar Under Pressure
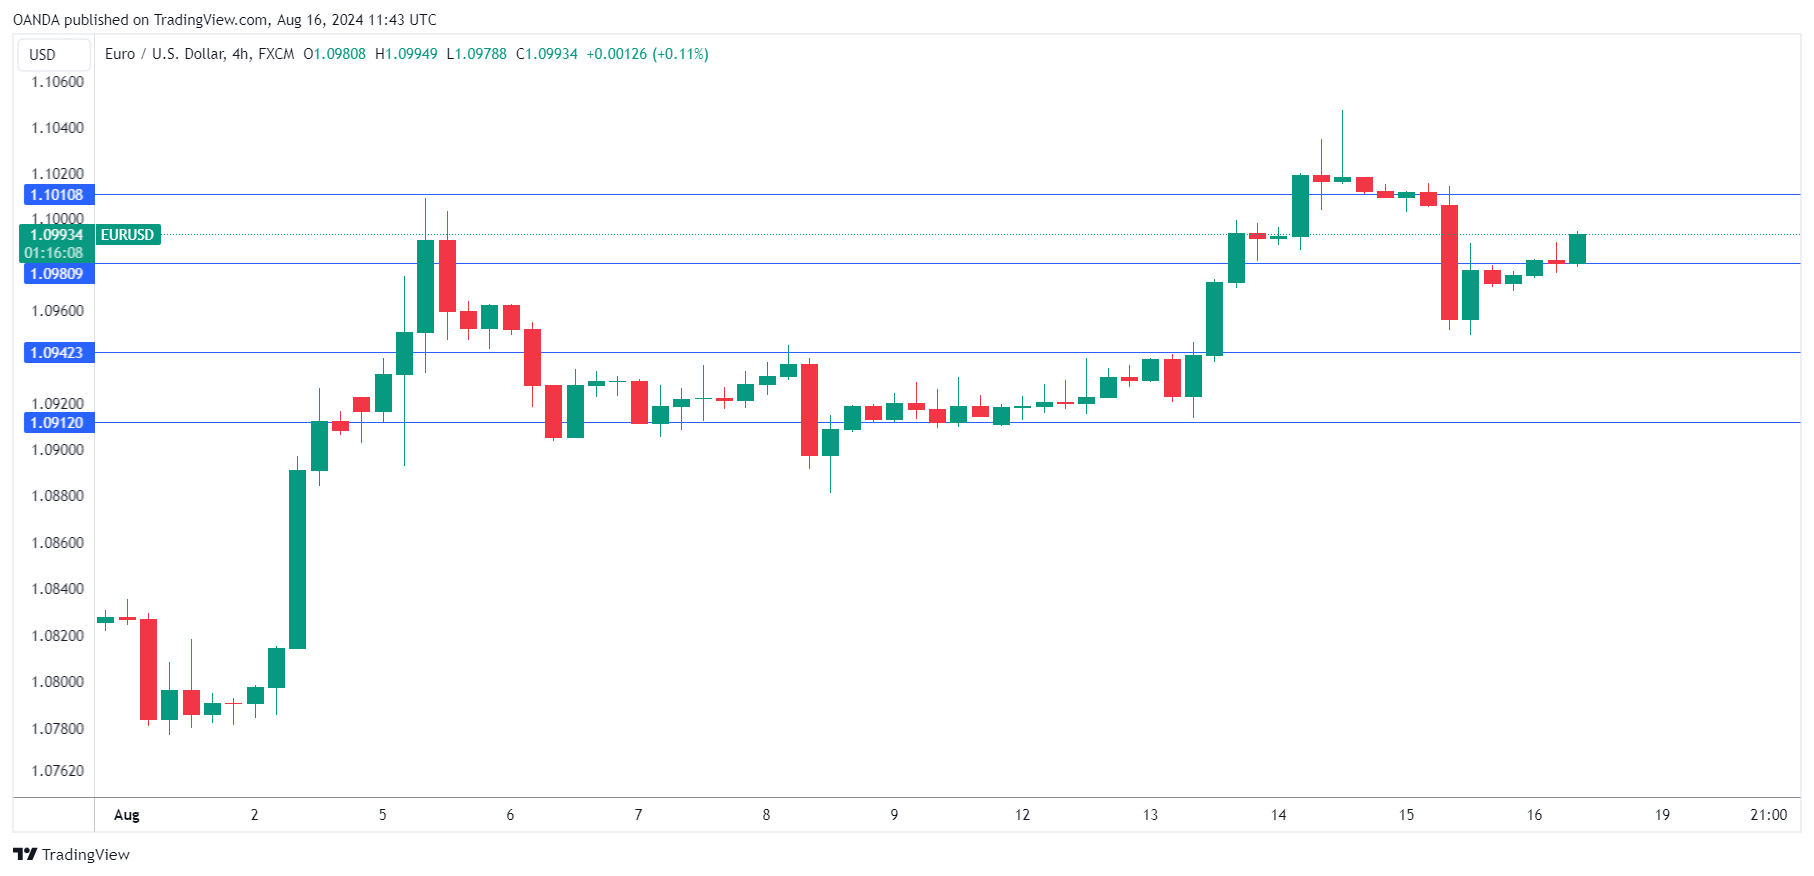
The euro has edged higher on Friday. In the European session, EUR/USD is trading at 1.0994, up 0.21% on the day at the time of writing.
The US dollar is under pressure and the euro rose as much as 1.2% this week before paring about half of those gains. On Wednesday, the euro hit 1.1047, its highest level against the US dollar this year.
Investors are showing greater pessimism about economic conditions. Eurozone investor sentiment fell to 17.9 in August, down sharply from 43.7 a month earlier. This was the lowest reading since November 2023. Germany, the largest economy in the eurozone, showed a similar trend. There are significant uncertainties about the eurozone and German economies and these worries increased due to the recent turmoil in the global stock markets.
Solid US data eases market nerves
Exactly two weeks ago, the US jobs report was weaker than expected, triggering a meltdown across global stock markets. Investors panicked that the US economy was hurtling towards a recession but the markets have recovered courtesy of solid US numbers this week.
US inflation dipped to 2.9% y/y in July, down a notch from 3% a month earlier which was also the market estimate. Retail sales jumped 1% m/m, bouncing back from -0.2% in June and breezing past the market estimate of 0.4%. As well, unemployment claims were lower than the market estimate for a second straight week.
The rout in the financial markets raised expectations for a half-point cut from the Federal Reserve to as high as 60%, but this has fallen to 30% since the retail sales report (a quarter-point has been priced in at 70%). The Fed meets next on September 18 and a rate cut is virtually guaranteed but the size of the cut remains an open question.
EUR/USD Technical
- EUR/USD is testing resistance at 1.0980. Above, there is resistance at 1.1010
- 1.0942 and 1.0912 are the next support levels
New Zealand Dollar Stems Slide
The New Zealand dollar has rebounded on Friday after a 1.4% slide over the past two days. NZD/USD is trading at 0.6017, up 0.70% in the European session at the time of writing.
Solid US numbers raises risk appetite
Exactly two weeks ago, a soft employment report out of the US panicked investors and caused a meltdown across global stock markets. The turmoil was brief as the stock markets have rallied. The fears that the US economy was hurtling towards a recession have eased this week, as US CPI was within expectations and US retail sales was much higher than the forecast.
US inflation dipped to 2.9% y/y in July, down a notch from 3% a month earlier which was also the market estimate. Retail sales jumped 1% m/m, bouncing back from -0.2% in June and breezing past the market estimate of 0.4%. As well, unemployment claims were lower than the market estimate for a second straight week.
The rout in the financial markets raised expectations for a half-point cut from the Fed to as high as 60%, but this has fallen to 30% since the retail sales report (a quarter-point has been priced in at 70%).
The volatility in the stock markets has been driven by the strength of the US numbers. This week’s positive data has not allayed investor fears completely and if upcoming key data is weaker than expected, we could see the financial markets react negatively.
The US dollar is showing weakness as the market turmoil has eased. Risk appetite has returned, which has given the New Zealand dollar a strong boost today.
NZD/USD Technical
- There is resistance at 0.6073 and 0.6146
- 0.5961 and 0.5888 are providing support
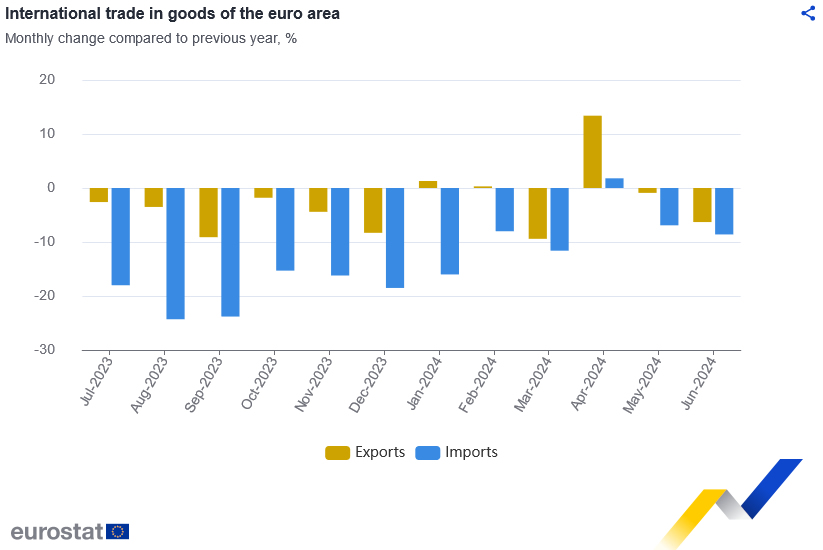
Eurozone goods exports fall -6.3% yoy in Jun, goods imports down -8.6% yoy
Eurozone goods exports fell -6.3% yoy to EUR 236.7B in June. Goods imports fall -8.6% yoy to EUR 214.3B. Trade balance showed a EUR 22.3B surplus. Intra-Eurozone trade fell -8.5% yoy to EUR 214.5B.
In seasonally adjusted term, goods exports fell -0.2% mom to EUR 236.2B. Goods imports fell -2.4% mom to EUR 218.7B. Trade surplus widened from EUR 12.4B in the prior month to EUR 17.5B, larger than expectation of EUR 14.5B. Intra-Eurozone trade rose 0.4% mom to EUR 210.7B.
GBP/USD Extends Gains as Retail Sales Bounce Back
The British pound has extended its gains on Friday. GBP/USD is trading at 1.2887 in the European session, up 0.31% on the day at the time of writing. It has been a winning week for the pound, which has climbed 1%.
UK retail sales jump in July
There was more good news from the UK economy as retail sales rebounded in July by 0.5% m/m, after a revised decline of 0.9% in June and in line with the market estimate. Annually, GDP surged 1.4%, compared to -0.8% in June and matching the market estimate. The pound has moved higher in response to the positive retail sales data.
The bounce in retail sales reflects summer discounts and purchases related to the Euro 2024 and the Paris Olympics, such as apparel. As well, with inflation finally under control and running close to 2%, consumers are responding by opening up their wallets and purses. The positive retail sales report follows yesterday’s solid GDP release. The UK economy recorded rose 0.6% in Q2, a second straight quarter of growth.
The economy is showing some strength in the second quarter but that may not have much effect on the Bank of England’s rate path. The increase in growth may not be sustainable and BoE policy makers have said that they are more focused on inflation, particularly service inflation, which remains much higher than the BoE’s 2% target. The markets are expecting further cutting before the end of the year and have priced in a rate reduction at the November meeting.
GBP/USD Technical
- GBP/USD is testing resistance at 1.2884. Above, there is resistance at 1.2914
- 1.2841 and 1.2811 are the next support levels
Market Analysis: Gold and Oil Prices Aim For Further Gains
Gold price started a fresh increase above the $2,432 resistance level. Crude oil prices are gaining bullish momentum and might even test $80.00.
Important Takeaways for Gold and Oil Prices Analysis Today
- Gold price started a steady increase from the $2,400 zone against the US Dollar.
- A connecting bearish trend line is forming with resistance at $2,460 on the hourly chart of gold at FXOpen.
- Crude oil prices extended gains above the $75.70 and $76.40 resistance levels.
- There is a connecting bearish trend line forming with resistance at $77.10 on the hourly chart of XTI/USD at FXOpen.
Gold Price Technical Analysis
On the hourly chart of Gold at FXOpen, the price found support near the $2,432 zone. The price formed a base and started a fresh increase above the $2,440 level.
There was a decent move above the 50-hour simple moving average and $2,450. The bulls pushed the price above the 50% Fib retracement level of the downward move from the $2,480 swing high to the $2,432 low.

The RSI is now near 50 and the price could aim for more gains. Immediate resistance is near the $2,460 level. There is also a connecting bearish trend line forming with resistance at $2,460.
The trend line is close to the 61.8% Fib retracement level of the downward move from the $2,480 swing high to the $2,432 low. The next major resistance is near the $2,480 level. An upside break above the $2,480 resistance could send Gold price toward $2,488.
Any more gains may perhaps set the pace for an increase toward the $2,500 level. Initial support on the downside is near the $2,432 zone. If there is a downside break below the $2,432 support, the price might decline further.
In the stated case, the price might drop toward the $2,415 support. The next major support sits at $2,400. Any more losses might send the price toward the $2,365 level.
Read analytical Gold price forecasts for 2024 and beyond.
Oil Price Technical Analysis
On the hourly chart of WTI Crude Oil at FXOpen, the price started a fresh upward move from $75.70 against the US Dollar. The price gained bullish momentum after it broke the $76.40 resistance.
The bulls pushed the price above the 23.6% Fib retracement level of the downward move from the $78.58 swing high to the $75.69 low. The price even climbed above the 50-hour simple moving average.

It tested the $77.10 resistance zone and a connecting bearish trend line. The trend line is close to the 50% Fib retracement level of the downward move from the $78.58 swing high to the $75.69 low. The RSI is now near the 50 level and the price could aim for more gains.
If the price climbs higher again, it could face resistance near $77.10. The next major resistance is near the $77.60 level. Any more gains might send the price toward the $78.55 level or even $80.00.
Conversely, the price might correct gains and test the $76.40 level. The next major support on the WTI crude oil chart is near the $75.70 zone, below which the price could test the $74.90 zone.
If there is a downside break, the price might decline toward $74.20. Any more losses may perhaps open the doors for a move toward the $73.50 support zone.
Start trading commodity CFDs with tight spreads. Open your trading account now or learn more about trading commodity CFDs with FXOpen.
This article represents the opinion of the Companies operating under the FXOpen brand only. It is not to be construed as an offer, solicitation, or recommendation with respect to products and services provided by the Companies operating under the FXOpen brand, nor is it to be considered financial advice.
USD/JPY Analysis: Rate Surpasses 149 Yen Per Dollar
As the USD/JPY chart indicates, the rate has risen approximately 5.4% above the August 5 low.
On one hand, the yen's weakening against the U.S. dollar is partly driven by rumours that the Bank of Japan might intervene not to support the weak yen (as when the rate was above 160) but to weaken it further. "Intervention history shows that after yen-buying interventions, yen-selling interventions followed to curb excessive yen strength," Reuters reports, reflecting analysts' views.
On the other hand, the dollar strengthened yesterday as robust U.S. economic data all but dispelled fears of a recession.
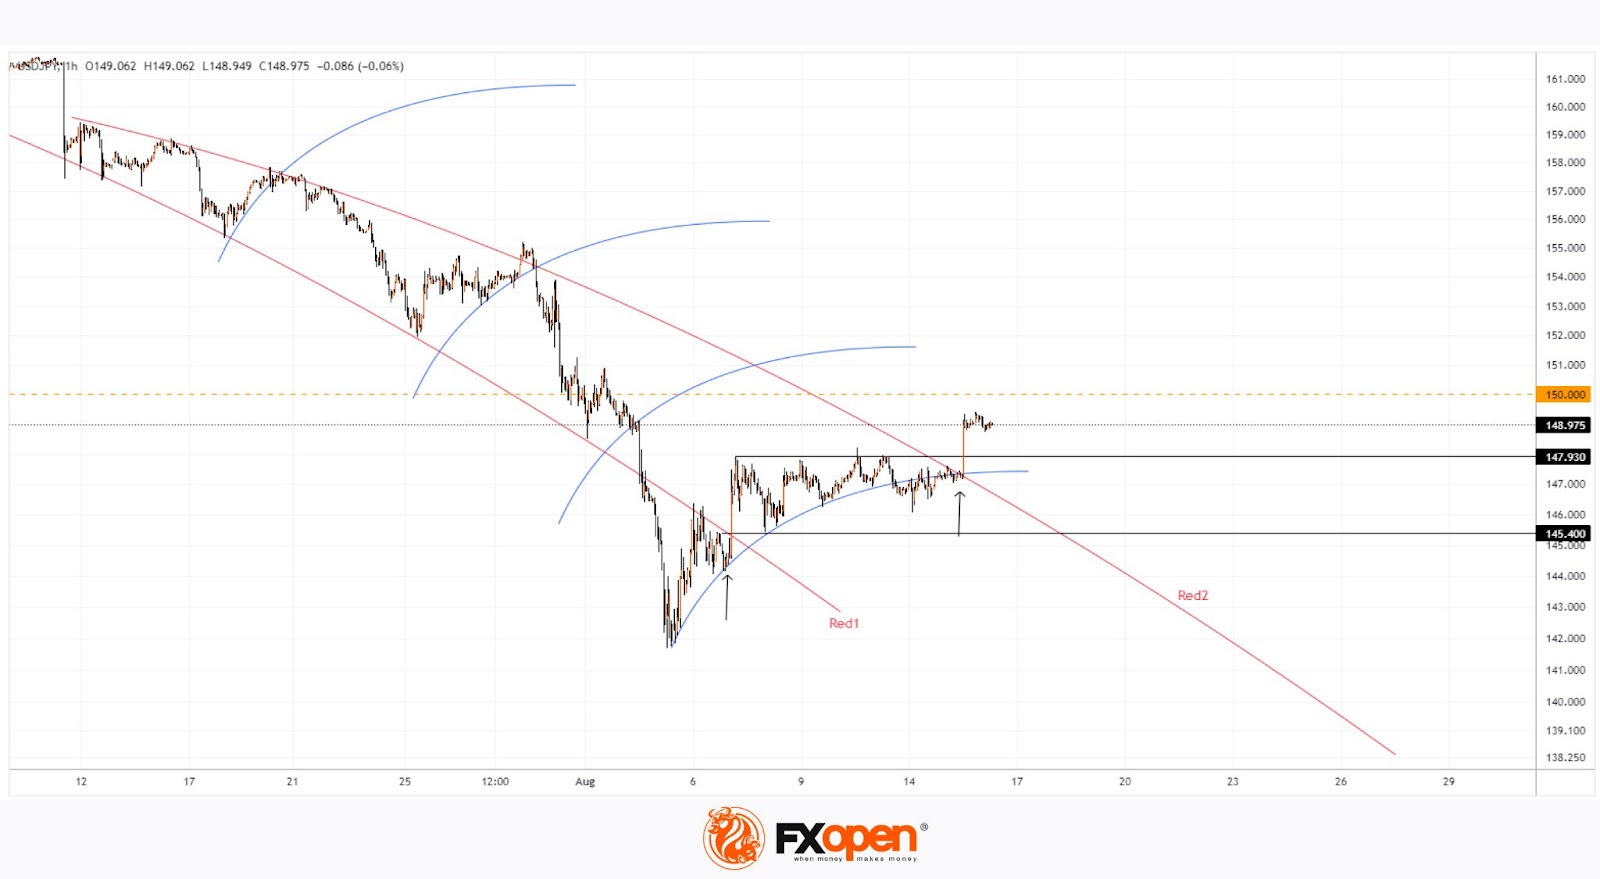
Technical analysis of the USD/JPY chart shows:
→ Since the second half of July, price action has formed a broadening downward structure between two red lines.
→ The price has mostly moved within this structure, finding temporary support at levels marked by blue lines.
An interesting detail on the USD/JPY chart is that when the price broke upwards through the red line from an oversold zone (indicated by the first arrow), the 145.4 level near the breakout became a significant support.
A similar situation is now unfolding: the price is breaking through the red line (Red2) from below (indicated by the second arrow). By analogy, it's reasonable to expect the price to find support around the 147.93 level.
If the bulls gain confidence, they might attempt to challenge the psychological level of 150 yen per U.S. dollar.
Trade over 50 forex markets 24 hours a day with FXOpen. Take advantage of low commissions, deep liquidity, and spreads from 0.0 pips. Open your FXOpen account now or learn more about trading forex with FXOpen.
This article represents the opinion of the Companies operating under the FXOpen brand only. It is not to be construed as an offer, solicitation, or recommendation with respect to products and services provided by the Companies operating under the FXOpen brand, nor is it to be considered financial advice.
Strong US Retail Sales Send Yields Soaring
In focus today
Today we get UK retail sales data for July at 8.00 CET. According to polls from Reuters, analysts expect overall retail sales to grow by 0.5% m/m and retail sales excl. fuels to grow by 0.8% m/m.
In the US, the University of Michigan Consumer Sentiment survey is released at 16.00 CET. It is the preliminary release covering August, and analysts expect it to come in at 66.9 virtually unchanged from the 66.4 (revised) seen in July.
Fed's Goolsbee (voting member) speaks at 19.25 CET.
Economic and market news
What happened yesterday
In the US, retail sales data came in much stronger than analysts had expected, as growth for the headline stood at 1.0% m/m dwarfing the expected 0.3% m/m. Core retail sales also grew by more than expected as it stood at 0.4% m/m compared to consensus amongst analysts of 0.1% m/m. Combined with yet another low figure of initial jobless claims for the second week in a row, markets reacted promptly sending both 1-, 2- and 10-year Treasury yields up by more than 10bp in the aftermath.
Equity markets on the other hand reacted positively, appearing to shake off some of the recession-fears which caught on last week. As such, the S&P500 is now around only 2.5% off its all-time high.
As was widely expected, Norges Bank left their policy rate unchanged at 4.50%. Furthermore, Norges Bank gave no new signals on their monetary policy, which was also expected given how economic key figures had pointed slightly in both directions since the monetary policy meeting in June.
In the UK, GDP growth came in as expected by analysts with GDP unchanged m/m in June and 0.6% q/q in Q2.
What happened overnight
Markets in Asia have followed in the footsteps of yesterday's US session, and equities are in the green this morning led by Japan where the Nikkei 225 is up by around 3.1%.
Oil is giving some of its gains from yesterday back, as Brent is trading about 0.25% lower as of this morning at USD80.84/bbl.