Sample Category Title
RBNZ August 2024 MPS Review: Ready… Steady… Go!
- The RBNZ cut the OCR to 5.25% at its August policy meeting by unanimous decision.
- We think the RBNZ only seriously considered the option of cutting the OCR by 25bps at this point. The Governor noted that there are further meetings this year where further adjustments can be made.
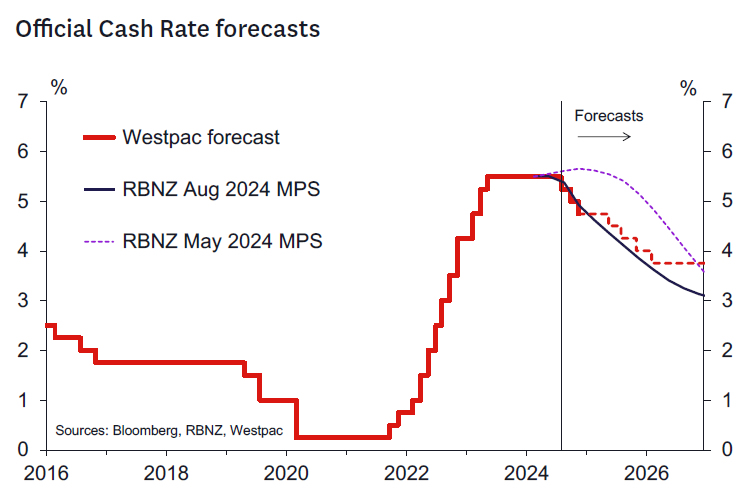
- The revised projections lowered the OCR track significantly. The track implies that the next easing will occur at the October Monetary Policy Review, and a total of 75bp of cuts are forecast by end 2024.
- The track implies the RBNZ's monetary policy strategy is to more quickly ease policy over the next 6-12 months. The RBNZ aims to reach neutral OCR levels of around 3% by 2027 as previously expected – but reaches there more quickly.
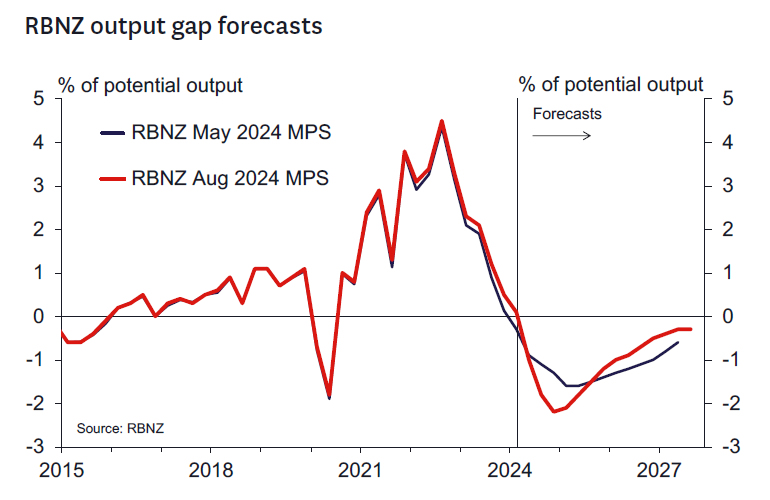
- The RBNZ's near-term forecasts for economic growth have been revised down significantly. A wider output gap and looser labour market gives them confidence that inflation will ultimately fall.
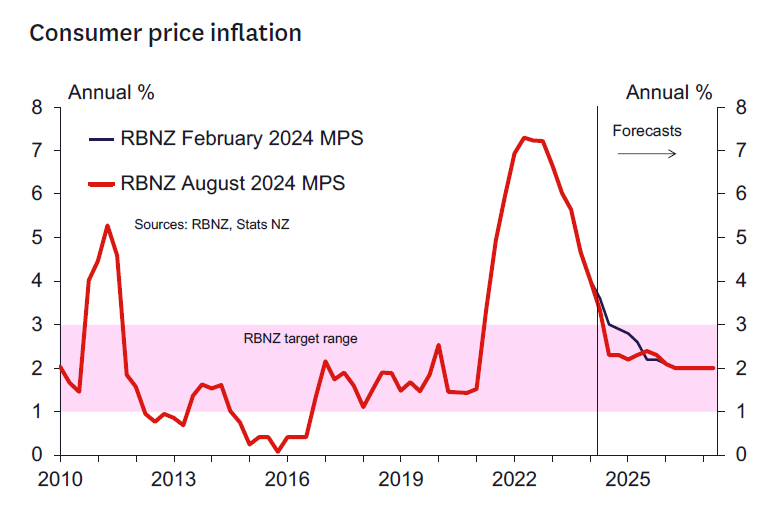
- Inflation is forecast to fall back inside the 1-3% band in the September quarter of this year and is still not projected to return to 2% until Q2 2026.
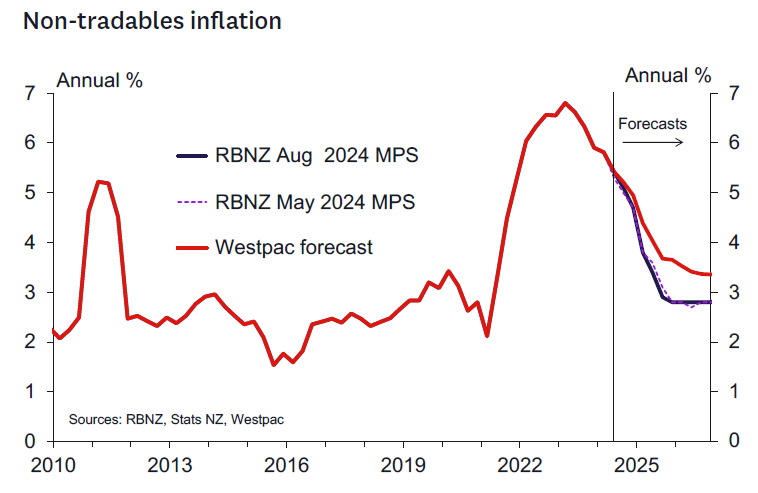
- The RBNZ assesses the risk profile for inflation as balanced – and now two sided. We think the risk profile is decidedly to the upside for non-tradables inflation pressures.
- Today's RBNZ update leaves us comfortable with our forecast of two further 25bp cuts in October and November. We will review our forecasts beyond then in coming days.
Key take out: OCR cut 25bps and further easing seems likely this year
The RBNZ unexpectedly cut the OCR to 5.25%. The decision to cut by 25bps today was reached by consensus and so no vote was taken.
As widely expected, the RBNZ's projected track for the OCR was revised significantly lower from that seen in the May MPS.
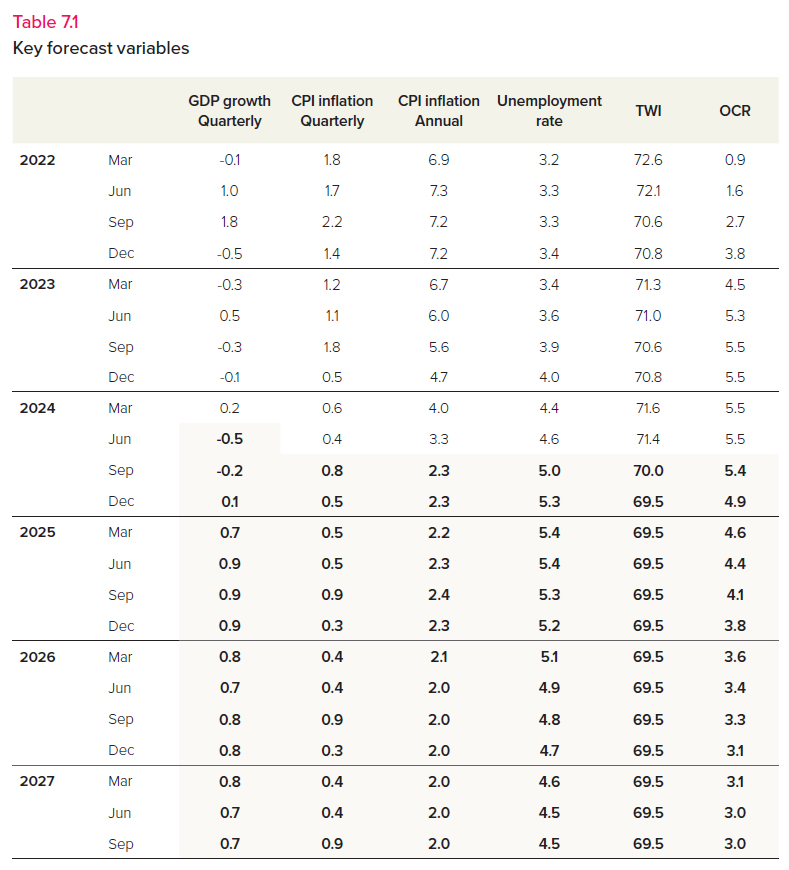
- The projected average OCR in Q4 this year was revised down 73bps to 4.92%, at face value implying three 25bps rate cuts by the end of this year.
- The projected OCR for Q4 2025 was revised down 129bps to 3.85%, implying a further around 100 bps of rate cuts next year.
- The forecast for Q4 2026 was revised down 57bps to 3.12%, implying around three 25bps cuts in that year.
- The RBNZ assumes the OCR reaches around 3% in Q3 2027 (the final quarter of the forecast).
According to the RBNZ, the most important driver of the revised view were a significant downgrade in the near-term growth outlook (as we had foreshadowed in our recent Economic Overview). This weaker growth profile and resultant weaker output gap has increased the MPC's confidence that inflation will continue to fall to the mid-point of the 1-3% target range over a similar timeframe as previously expected. Indications of weaker price intentions and inflation expectations have further buttressed the RBNZ's confidence that domestic inflation pressures will ultimately normalize.
Risks
We think the RBNZ's revised growth forecasts are well balanced in the short term. The RBNZ has included a relatively firm bounce back in the economy over 2025 compared to our forecasts. Having said that, the much easier interest rate profile compared to our more conservative OCR forecast assumptions explains some of that relative optimism. Interestingly, the RBNZ does not see the front-loaded easing profile impacting on house prices significantly in the next year. There could be some upside risks there in coming quarters given the generally strong inverse relationship between interest rates and house prices.
The risks around their short-term inflation projections also look well balanced, although from early 2025 the RBNZ has an optimistic view on how quickly non-tradable inflation will fall. We are not so sure about that, and it will be up to the data to confirm this is going to occur.
Westpac's OCR call
We remain comfortable with the previous forecast of two further 25 bp cuts to the OCR over the balance of the year (from the lower 5.25% starting point). Hence, we expect the OCR to end 2024 at 4.75%. Beyond that we will make a full assessment in coming days.
CPI inflation to fall below 3% sooner than expected
Underlying the downward revision to the RBNZ's interest rate projection is a better contained outlook for inflation. Inflation surprised the RBNZ to the downside in the June quarter and it's now expected to fall below 3% in the September quarter. That's sooner than the RBNZ had assumed in May, and in line with our own forecasts for inflation over the remainder of this year.
Further ahead, the RBNZ is sounding increasingly confident that inflation will settle close to the 2% midpoint of their target band (though this still isn't expected to be reached until mid-2026). We're also expecting to see inflation trending back towards 2%. However, there are some key areas where we think the RBNZ might be surprised.
First, and most importantly, is the 'stickiness' in domestic inflation. The RBNZ expects that domestic inflation will drop back sharply over 2025 as capacity pressures ease. They've also allowed for a faster easing in price setting behaviour (i.e. inflation expectations) and more moderate increases in the prices for items like insurance. We're less optimistic about how quickly domestic inflation will ease and expect that it will continue to surprise the RBNZ to the upside (as it has done over the past year).
Balanced against that risk of persistent domestic inflation, imported inflation (i.e. tradables) has fallen well short of the RBNZ's forecasts. The RBNZ is projecting a reacceleration in imported inflation next year after some sharp falls recently. In contrast, we expect that it will remain soft for some time. That will help to keep overall inflation and inflation expectations contained.
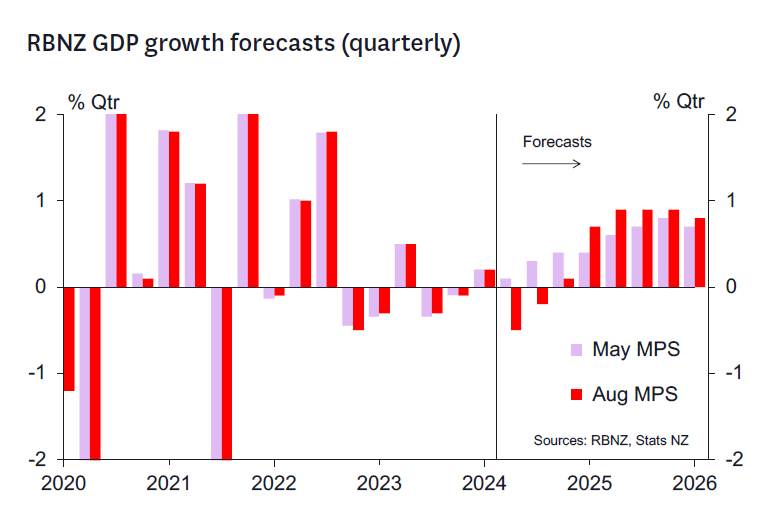
Near-term GDP growth forecasts revised down
A key driver of today's decision was a sharply downgraded view of the near-term outlook for activity, with crucial implications for the labour market (see below) and the output gap. Indeed, the RBNZ's forecasts for GDP growth in Q2 and Q3 were revised down by a cumulative 1.1ppts and at -0.5%q/q and -0.2%q/q respectively are nearly identical to the estimates that we included in our recent updated Economic Overview. As a result, while the RBNZ has again revised down its estimate of the economy's potential growth rate, the RBNZ now expects the output gap to turn more negative over the coming year, troughing at -2.2% of GDP in Q4 this year, rather than a trough of -1.6% of GDP in Q1 next year.
Given the much easier monetary conditions included in these projections, the RBNZ's forecasts also build in a much stronger cyclical rebound in activity next year. Indeed, the RBNZ now expects GDP to grow 3.3% over the 2025 calendar year up from 2.4% in the May MPS. As a result, the output gap is expected to shrink to -1.2% of GDP by the end of next year, which is slightly smaller than the -1.4% of GDP output gap projected in the May MPS. It is worth noting that this rebound is quite a bit stronger than forecast in our recent Economic Overview, albeit with our forecasts based on firmer monetary conditions than implied by the RBNZ's revised projections.
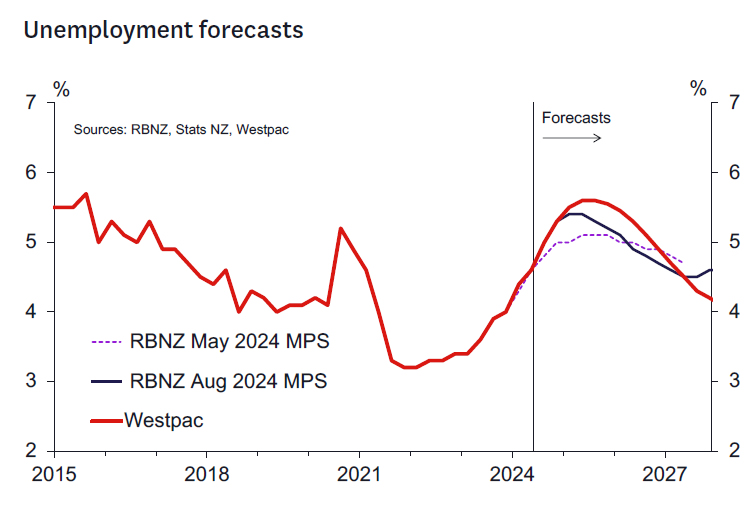
The RBNZ's labour market view
The RBNZ acknowledged the softening in the labour market, particularly in the near term – the sharp slowdown in job vacancies and the fall in filled jobs in the last few months were among the high-frequency activity indicators that the RBNZ highlighted in its Statement. They expect the unemployment rate to rise further in the coming quarters, reaching a peak of 5.4% in early 2025. That's higher than their previous forecast of a 5.1% peak, though it's within the range of forecasts that the RBNZ has produced over the last couple of years. Along with that increasing slack in the labour market, the RBNZ expects a faster moderation in wage growth.
RBNZ takes relatively sanguine view on impact of Budget 2024
The August MPS is the first to be released since Budget 2024 was unveiled in late May, and so the first to fully incorporate an estimate of the full impact of the new Government's policies. The RBNZ's view on the impact of fiscal policy is set out on Box B of the MPS. The RBNZ notes that spending reductions in the public sector will reduce inflationary pressure, and income tax threshold changes will increase inflationary pressure. A fiscal multiplier of 0.5 is assumed to apply to both spending reductions and tax revenue reductions – in line with estimates derived from past research in New Zealand, but this assumption is recognised as a source of uncertainty. The RBNZ also noted that tax cuts can also increase labour supply and affect wage bargaining, which may partially offset the inflationary pressure from higher spending.
Given that the May MPS had already implicitly accounted for a share of the lower government spending, the RBNZ's updated assumptions about fiscal policy have added slightly to medium-term inflationary pressure. However, those effects have clearly been swamped by other economic developments. Overall, the RBNZ concluded that the net impact for monetary policy is expected to be small and is highly uncertain. Over coming months, the RBNZ will refine its estimates in light of the emerging data.
Key domestic data to watch ahead of the RBNZ's October Review
The next RBNZ policy review will take place on 9 October. In addition to any important economic or financial developments offshore, there are several domestic economic data releases that will have a significant bearing on the outcome of that meeting. The most important are:
- The Q2 GDP report (19 September): The outcome of this report will be compared to the RBNZ's estimate, with any deviation having implications for the RBNZ's estimate of the output gap and perhaps also its view on near-term growth momentum.
- The Q3 QSBO survey (1 October): The focus will be on indicators of spare capacity and cost/ inflation pressures. It will also be interesting to see if confidence, hiring and investment indicators are lifting from low levels as monetary conditions ease.
- Selected price indexes for July/August (15 August/12 September): These indexes will cast light on some of the most volatile components of the CPI and thus on the certainty that the Q3 CPI (16 October) will show inflation back inside the 1-3% target band.
- Employment indicators for July/August (28 August/30 September): Developments in the labour market will remain a key focus for the RBNZ and these indicators will provide insight into the likely outcome of the Q3 labour surveys (released 6 November).
- The August Electronic Card Transactions report (12 September): This release will capture the first month of retail spending since the personal tax cuts took effect.
In addition to the above, key monthly activity indicators such as the Business NZ manufacturing and services indexes and the ANZ Business Outlook survey will also be of interest.
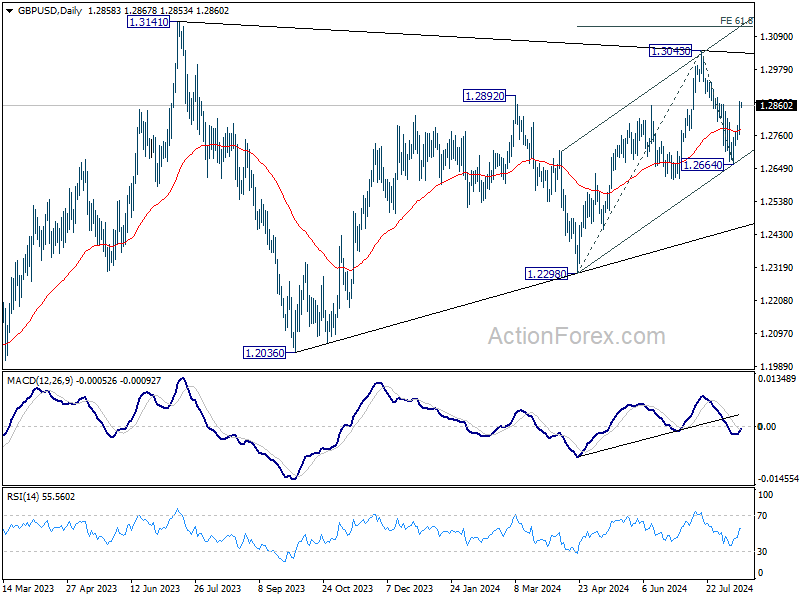
GBP/USD Daily Outlook
Daily Pivots: (S1) 1.2792; (P) 1.2833; (R1) 1.2903; More...
GBP/USD's extended rebound and break of 1.2839 resistance argues that pull back from 1.3043 has completed at 1.2664 already. Intraday bias is back on the upside for retesting 1.3043. firm break there will resume whole rally from 1.2998 to 61.8% projection of 1.2298 to 1.3043 from 1.2664 at 1.3124, which is close to 1.3141 high. For now, risk will stay on the upside as long as 1.2664 support holds, in case of retreat.
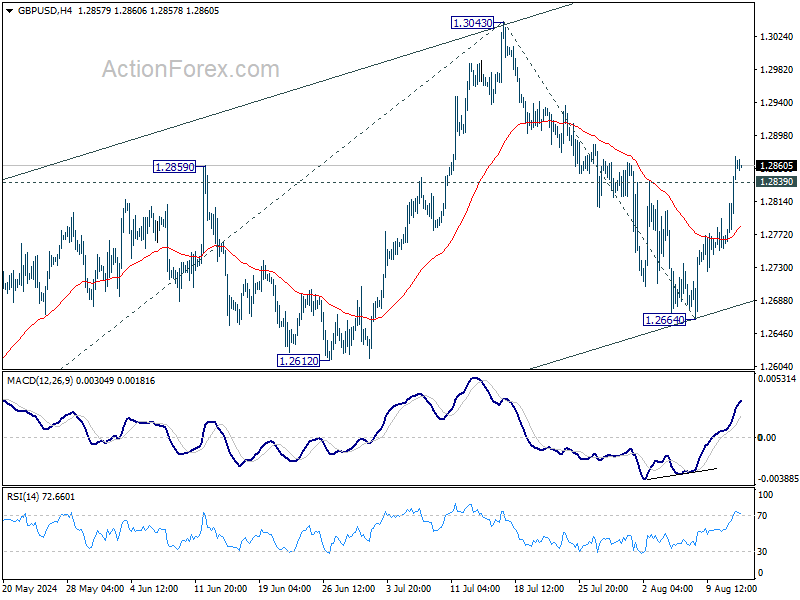
In the bigger picture, as long as 1.3141 resistance holds (2023 high), medium term corrective pattern from there could still extend with another falling leg. But even in that case, downside should be contained by 1.2036/2298 support zone. Meanwhile, decisive break of 1.3141 will confirm resumption of whole up trend from 1.0351 (2022 low).
NZD Tanks After RBNZ Cut, UK and US CPI for Next Volatility Wave
New Zealand Dollar plunged today after RBNZ unexpectedly cut interest rates by 25bps, marking the first reduction in this easing cycle. This move came much earlier than the market's anticipation of a rate cut in October or November. The selloff gained further momentum after RBNZ Governor Adrian Orr disclosed that a 50bps cut had been considered during the meeting. While the central bank's projections indicate one more 25bps cut by the end of the year, participants are now bracing for even more aggressive easing, with two additional cuts expected—one in October and another in November.
Market focus is now shifting towards crucial consumer inflation data from both the UK and the US. In the UK, July CPI report is highly anticipated, especially as there are concerns that inflation could reaccelerate from 2.0% to 2.3%. Such an outcome would likely tie BoE's hands, making it difficult to justify further rate cuts in the near term. The situation could be even more delicate if core CPI doesn't slow as forecasted to 3.4%. It's worth noting that BoE's decision to cut rates by 25bps this month was a narrow one, passing with a 5-4 vote. Any inflationary surprises today could push BoE to delay its next move.
In the US, the focus is on the July CPI report, where the headline inflation rate is expected to hold steady at 3.0%, while core inflation is projected to slow slightly to 3.2%. The market is already fully pricing in a 25bps rate cut by Fed in September, with more than 50% chance of a 50bps cut. However, most Fed officials have made it clear that they want to see more consistent disinflation before easing policy. Still, the picture remains fluid, with another non-farm payroll report and CPI release due before Fed's September meeting, which could sway the central bank's decision.
Overall in the currency markets, Kiwi is the worst performer for the day so far, followed by Aussie and Loonie. Dollar is the strongest, followed by Yen, and then Euro. Swiss Franc and Sterling are positioning in the middle. However, barring Kiwi pairs, all major pairs and crosses are stuck inside yesterday's range.
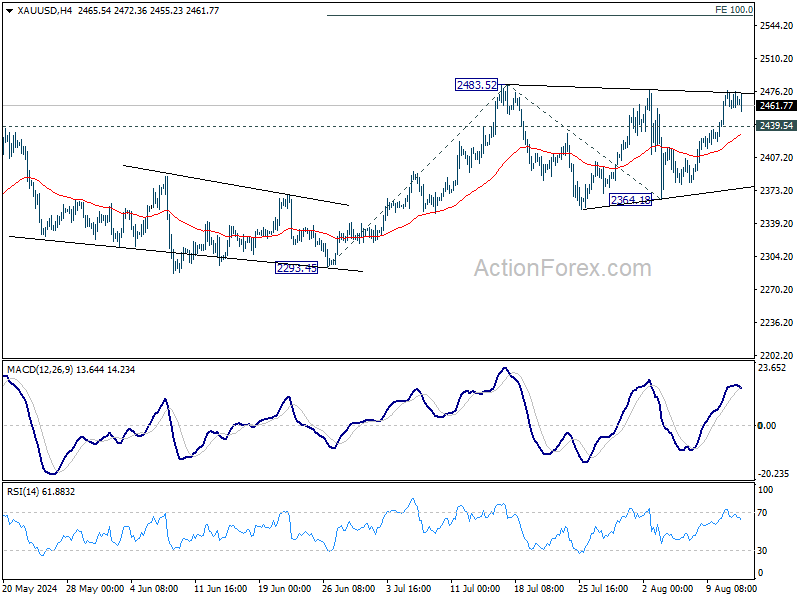
Technically, Gold looks ready to resume recent up trend to new record high. Firm break of 2483.52 will target 100% projection of 2293.45 to 2483.52 from 2364.18 at 2554.25. On the downside, break of 2439.54 minor support will delay the bullish case and bring more consolidations first. But an eventual upside breakout is expected as long as 2364.18 support holds.
In Asia, at the time of writing, Nikkei is down -0.06%. Hong Kong HSI is down -0.36%. China Shanghai SSE is down -0.35%. Singapore Strait Times is up 0.46%. Japan 10-year JGB yield is down -0.0308 at 0.816. Overnight, DOW rose 1.04%. S&P 500 rose 1.68%. NASDAQ rose 2.43%. 10-year yield fell -0.057 to 3.852.
RBNZ surprises with rate cut, signals another reduction this year
In an unexpected move, RBNZ lowered its Official Cash Rate by 25bps to 5.25% today, catching markets off guard. The central bank also unveiled new economic projections, which indicate the possibility of another rate cut later this year, followed by a total of 100bps in cuts throughout 2025.
RBNZ emphasized that the "pace of further easing" will hinge on confidence that pricing behavior remains aligned with a low-inflation environment and that inflation expectations stay anchored around the 2% target.
The minutes of the meeting reveal that "recent indicators give confidence that inflation will return sustainably to target within a reasonable time frame." The Committee agreed that with headline CPI inflation expected to return to the target band by the September quarter and growing excess capacity supporting a continued decline in domestic inflation, there was room to "temper the extent of monetary policy restraint."
The new economic projections suggest that OCR could drop further to 4.9% by Q4 2024, 3.8% by the end of 2025, and eventually reach 3.0% by mid-2027. Annual CPI inflation is forecasted to hover between 2.2% and 2.4% before settling at 2.0% by Q2 2026.
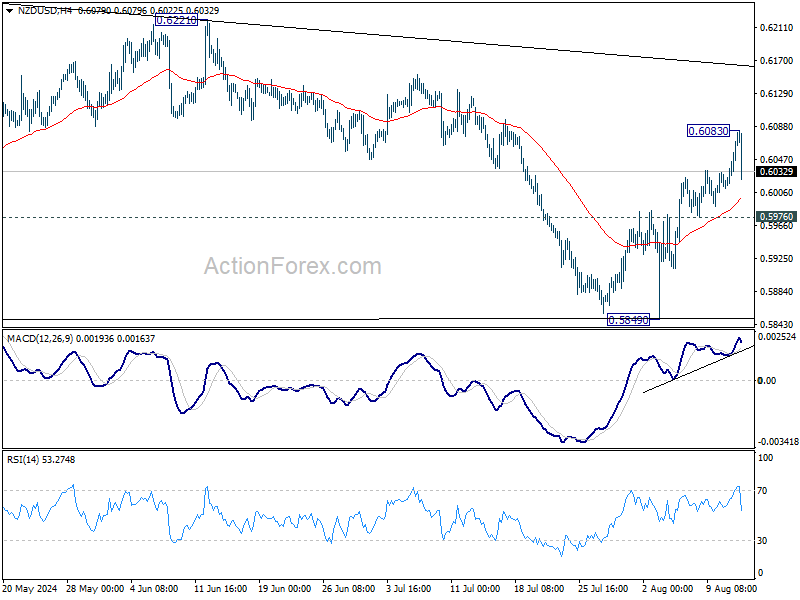
NZD/USD falls after RBNZ cut, but downside limited so far
NZD/USD fell notably after RBNZ's surprised rate cut but loss is so far limited. Some consolidations would be seen below 0.6083 temporary top first. But further rally would remain in favor as long as 0.5976 support holds. Above 0.6083 will resume the rise from 0.5849 towards falling trend line resistance (now at around 0.6165).
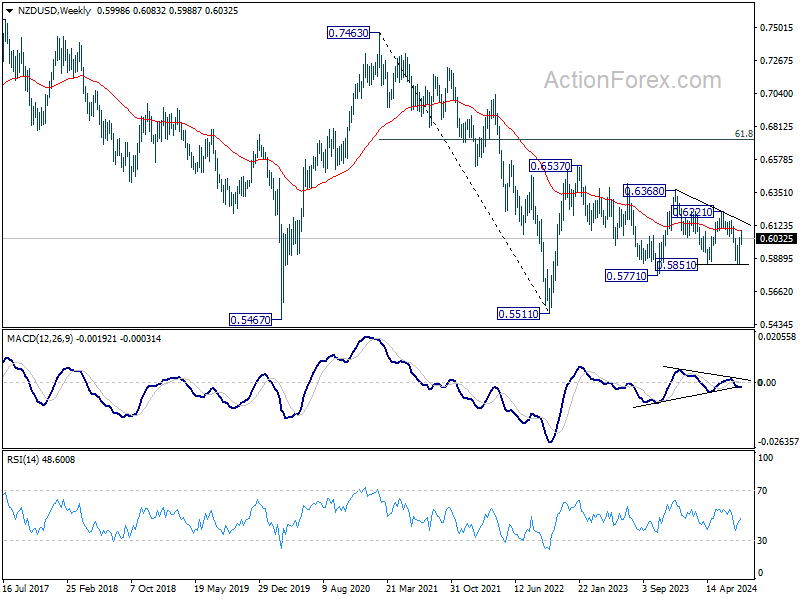
Overall, NZD/USD is seen as trading in converging range since hitting 0.5511 (2022 low) and rebounding to 0.6537 (2023 high). Outlook will be neutral until break at least a breakout from 0.5851/6221 range.
Fed's Bostic needs a little more data before supporting rate cuts
Atlanta Fed President Raphael Bostic emphasized a cautious approach regarding interest rate cuts, stating that he needs "a little more data" before supporting such a move. Bostic stressed the importance of ensuring that Fed doesn't prematurely lower rates, saying, "We want to be absolutely sure." He warned that it would be problematic if Fed cut rates and then had to reverse course by raising them again.
While Bostic acknowledged being encouraged by recent inflation readings, he reiterated that he might be ready to support a rate cut "by the end of the year." However, he remains watchful of labor market dynamics, expressing concern over the rise in unemployment. Bostic clarified that this increase is largely due to a growing labor force rather than a decline in demand, which he considers a "good problem to have."
GBP/USD Daily Outlook
Daily Pivots: (S1) 1.2792; (P) 1.2833; (R1) 1.2903; More...
GBP/USD's extended rebound and break of 1.2839 resistance argues that pull back from 1.3043 has completed at 1.2664 already. Intraday bias is back on the upside for retesting 1.3043. firm break there will resume whole rally from 1.2998 to 61.8% projection of 1.2298 to 1.3043 from 1.2664 at 1.3124, which is close to 1.3141 high. For now, risk will stay on the upside as long as 1.2664 support holds, in case of retreat.
In the bigger picture, as long as 1.3141 resistance holds (2023 high), medium term corrective pattern from there could still extend with another falling leg. But even in that case, downside should be contained by 1.2036/2298 support zone. Meanwhile, decisive break of 1.3141 will confirm resumption of whole up trend from 1.0351 (2022 low).
Economic Indicators Update
| GMT | Ccy | Events | Actual | Forecast | Previous | Revised |
|---|---|---|---|---|---|---|
| 02:00 | NZD | RBNZ Rate Decision | 5.25% | 5.50% | 5.50% | |
| 03:00 | NZD | RBNZ Press Conference | ||||
| 06:00 | GBP | CPI M/M Jul | 0.10% | |||
| 06:00 | GBP | CPI Y/Y Jul | 2.30% | 2.00% | ||
| 06:00 | GBP | Core CPI Y/Y Jul | 3.40% | 3.50% | ||
| 06:00 | GBP | RPI M/M Jul | 0.20% | |||
| 06:00 | GBP | RPI Y/Y Jul | 3.30% | 2.90% | ||
| 06:00 | GBP | PPI Input M/M Jul | -0.40% | -0.80% | ||
| 06:00 | GBP | PPI Input Y/Y Jul | -0.40% | |||
| 06:00 | GBP | PPI Output M/M Jul | 0.20% | -0.30% | ||
| 06:00 | GBP | PPI Output Y/Y Jul | 1.20% | 1.40% | ||
| 06:00 | GBP | PPI Core Output M/M Jul | 0.10% | |||
| 06:00 | GBP | PPI Core Output Y/Y Jul | 1.10% | 1.10% | ||
| 09:00 | EUR | Eurozone GDP Q/Q Q2 P | 0.30% | 0.30% | ||
| 09:00 | EUR | Eurozone Employment Change Q/Q Q2 P | 0.20% | 0.30% | ||
| 09:00 | EUR | Eurozone Industrial Production M/M Jun | 0.70% | -0.60% | ||
| 12:30 | USD | CPI M/M Jul | 0.20% | -0.10% | ||
| 12:30 | USD | CPI Y/Y Jul | 3.00% | 3.00% | ||
| 12:30 | USD | CPI Core M/M Jul | 0.20% | 0.10% | ||
| 12:30 | USD | CPI Core Y/Y Jul | 3.20% | 3.30% | ||
| 14:30 | USD | Crude Oil Inventories | -1.9M | -3.7M |
Gold Aims for Critical Upside Break, US CPI Next
Key Highlights
- Gold is attempting a fresh increase above the $2,440 support zone.
- A major bullish trend line is forming with support at $2,400 on the 4-hour chart.
- Oil prices extended gains and climbed above the $77.50 resistance.
- The US Consumer Price Index could increase by 2.9% in July 2024 (YoY), down from +3%.
Gold Price Technical Analysis
Gold prices found support near the $2,380 level against the US Dollar. The price formed a base and recently started a fresh increase above $2,420.
The 4-hour chart of XAU/USD indicates that the price settled above the $2,440 level, the 100 Simple Moving Average (red, 4 hours), and the 200 Simple Moving Average (green, 4 hours). It even surpassed the $2,465 resistance zone.
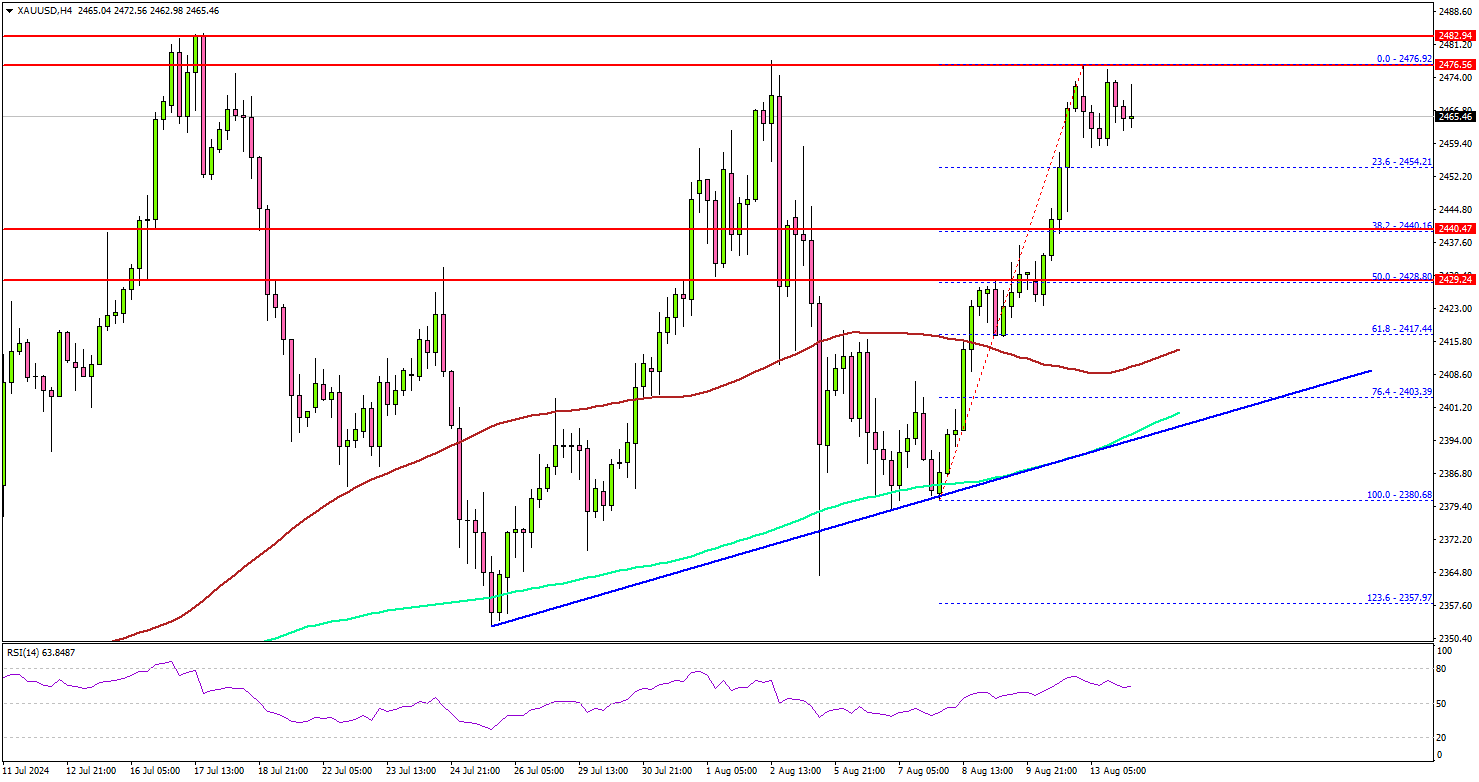
Finally, the bears appeared near the $2,475 zone. The price is now consolidating and eyeing for more upsides. Immediate resistance is near the $2,475 level.
The first major resistance sits near the $2,485 level. A clear move above the $2,485 resistance could open the doors for more upsides. The next major resistance could be near $2,500, above which the price could accelerate higher toward the $2,520 level. Any more gains might send Gold toward the $2,550 resistance.
On the downside, there is a key support forming near the $2,440 level. The main support is now near $2,400. There is also a major bullish trend line forming with support at $2,400 on the same chart.
A downside break below the $2,400 support might call for more downsides. The next major support is near the $2,380 level. Any more losses might send gold prices toward $2,365.
Looking at Oil, the bulls remained in action, and they were able to push the price above the $77.50 and $77.65 resistance levels.
Economic Releases to Watch Today
- US Consumer Price Index for July 2024 (MoM) – Forecast +0.2%, versus -0.1% previous.
- US Consumer Price Index for July 2024 (YoY) – Forecast +2.9%, versus +3% previous.
- US Consumer Price Index Ex Food & Energy for July 2024 (YoY) – Forecast +3.2%, versus +3.3% previous.
NZD/USD falls after RBNZ cut, but downside limited so far
NZD/USD fell notably after RBNZ's surprised rate cut but loss is so far limited. Some consolidations would be seen below 0.6083 temporary top first. But further rally would remain in favor as long as 0.5976 support holds. Above 0.6083 will resume the rise from 0.5849 towards falling trend line resistance (now at around 0.6165).
Overall, NZD/USD is seen as trading in converging range since hitting 0.5511 (2022 low) and rebounding to 0.6537 (2023 high). Outlook will be neutral until break at least a breakout from 0.5851/6221 range.
RBNZ surprises with rate cut, signals another reduction this year
In an unexpected move, RBNZ lowered its Official Cash Rate by 25bps to 5.25% today, catching markets off guard. The central bank also unveiled new economic projections, which indicate the possibility of another rate cut later this year, followed by a total of 100bps in cuts throughout 2025.
RBNZ emphasized that the "pace of further easing" will hinge on confidence that pricing behavior remains aligned with a low-inflation environment and that inflation expectations stay anchored around the 2% target.
The minutes of the meeting reveal that "recent indicators give confidence that inflation will return sustainably to target within a reasonable time frame." The Committee agreed that with headline CPI inflation expected to return to the target band by the September quarter and growing excess capacity supporting a continued decline in domestic inflation, there was room to "temper the extent of monetary policy restraint."
The new economic projections suggest that OCR could drop further to 4.9% by Q4 2024, 3.8% by the end of 2025, and eventually reach 3.0% by mid-2027. Annual CPI inflation is forecasted to hover between 2.2% and 2.4% before settling at 2.0% by Q2 2026.
(RBNZ) OCR 5.25% – Monetary restraint tempered as inflation converges on target
New Zealand's annual consumer price inflation is returning to within the Monetary Policy Committee's 1 to 3 percent target band. Surveyed inflation expectations, firms' pricing behaviour, headline inflation, and a variety of core inflation measures are moving consistent with low and stable inflation.
Economic growth remains below trend and inflation is declining across advanced economies. Some central banks have begun reducing policy interest rates. Imported inflation into New Zealand has declined to be more consistent with pre-pandemic levels.
Services inflation remains elevated but is also expected to continue to decline, both at home and abroad, in line with increased spare economic capacity. Consumer price inflation in New Zealand is expected to remain near the target mid-point over the foreseeable future.
The Committee agreed to ease the level of monetary policy restraint by reducing the OCR to 5.25 percent. The pace of further easing will depend on the Committee's confidence that pricing behaviour remain consistent with a low inflation environment, and that inflation expectations are anchored around the 2 percent target.
Media contact
James Weir
Senior Adviser External Stakeholders
Phone: +64 4 471 3962 | Mobile: 021 103 1622
Email: James.Weir@rbnz.govt.nz
Summary Record of Meeting – August 2024
The Monetary Policy Committee discussed recent economic and financial developments and their implications for monetary policy in New Zealand.
The Committee noted that the weakening in domestic economic activity observed in the July Monetary Policy Review has become more pronounced and broad-based. Headline inflation has declined, and business inflation expectations have returned to around 2 percent at medium- and longer-term horizons. Committee members agreed that monetary policy restraint can now begin to ease. The pace of loosening will depend on the extent to which price-setting behaviour continues to adapt to lower inflation and inflation expectations remain well anchored to the target mid-point.
Global growth remains below trend across advanced economies. Growth in China has been softer than expected, due to a depressed property market and weak consumer demand. While US growth has been firm, some indicators show emerging weakness. Recent volatility in global asset markets reflects nervousness about US economic prospects, geopolitical risks, and the outlook for international trade policy.
The Committee noted that global inflation has continued to decline but remains elevated in some parts of the services sector in many countries. The Committee noted that some central banks have recently begun cutting policy interest rates, reflecting lower core inflation, weaker activity, and softer labour markets. In this respect, New Zealand's economic activity and near-term inflation indicators now resemble those in countries in which central banks have started cutting policy rates.
While official economic statistics have evolved in line with expectations in the May Monetary Policy Statement, a broad range of high-frequency indicators point to a material weakening in domestic economic activity in recent months. These include various survey measures of business activity, electronic card transactions, vehicle traffic, house sales, filled jobs, and job vacancies. These indicators collectively provide a consistent signal that the economy contracted in recent months. The output gap is now assessed to be more negative than was assumed in the May Monetary Policy Statement, indicating increased spare capacity.
The Committee discussed possible reasons for the current economic weakness. Alongside restrictive monetary policy, an earlier or larger impact of tighter fiscal policy could be constraining domestic demand. Falling net migration may also be playing a role. The Committee noted that measurement challenges, including methodological changes by Statistics New Zealand in the national accounts, are creating additional uncertainty around the composition and likely persistence of this weakness.
The Committee discussed recent developments in the labour market. The June quarter data suggest that employment growth has slowed, with declines in private sector jobs, hours worked, and wage growth. The impact of government spending restraint and public sector job losses are expected to materialise in further weakening in employment growth over coming quarters.
In discussing fiscal policy, the Committee noted that government expenditure is declining as a share of the economy, with contractionary impacts already felt and expected to continue. However, whether tax cuts will boost consumption is more uncertain. While tax cuts could stimulate demand, it is also possible that households might be more cautious about spending in the current economic environment.
The Committee discussed global and domestic financial conditions. Weaker economic data globally have prompted markets to price in lower policy rates for the rest of the year, pushing down sovereign yields in most advanced economies. While domestic financial conditions remain restrictive, they have loosened over recent months. Market expectations for the forward path of the Official Cash Rate (OCR) have contributed to lower wholesale and borrowing rates, along with some depreciation in the nominal exchange rate. The Committee also noted that more households are choosing shorter pricing tenors, meaning that further reductions in mortgage interest rates will flow through to lower household interest costs relatively quickly.
The Committee noted that while credit remains available, demand for credit is weak. This provides a further signal of soft economic activity. High interest rates, sluggish housing market activity and low investment intentions have curbed demand for credit. The agriculture sector has also paid down debt, curbing credit demand.
The Committee considered risks to the financial system. With elevated debt servicing costs and weak economic conditions, some households and businesses are experiencing financial stress. The Committee noted that banks had tightened lending standards in recent years, increased loan loss provisions and were well capitalised, making the financial system more resilient. Non-performing loans have increased from a year ago but remain relatively low by historical standards, and banks are well positioned to support borrowers. In this environment, the Committee agreed that there is no material trade-off between meeting its inflation objectives and maintaining financial system stability.
The Committee discussed inflation developments. Inflation fell considerably in the June quarter, due mostly to lower tradables inflation, while domestic inflation declined in line with expectations. Members were encouraged that surveyed business inflation expectations have returned to around 2 percent at medium- and longer-term horizons. All measures of core inflation have fallen and the components of CPI that are sensitive to monetary policy have declined further. Together with the weaker high-frequency indicators of economic activity, these developments provide the Committee with more confidence that headline inflation is returning to the target band in the September 2024 quarter.
The Committee discussed upside risks to the inflation outlook. The persistence of domestic inflation and the pace at which price-setting behaviour will adjust to a low-inflation environment remain uncertain. Members noted the possibility that firms might adjust prices asymmetrically – changing prices quickly when inflation was high and rising, but more slowly when inflation is falling. The Committee noted uncertainty around the outlook for potential output, given weak productivity growth. If potential output grows more slowly than currently assumed, there will be less spare capacity and less downward pressure on domestic inflation.
Furthermore, ongoing geopolitical and trade tensions and the global reshoring of manufacturing activities could lead to higher import prices for New Zealand. Members also discussed the significant rise in global shipping costs, caused by ongoing disruptions to Red Sea and Panama Canal freight routes. Given New Zealand's relatively limited trade through these routes, the effect on shipping costs for New Zealand imports are assumed to be more moderate, and feed through to import prices with a lag.
The Committee discussed downside risks to the outlook. Members agreed that a weaker global economy, particularly in China, could dampen demand for New Zealand exports and reduce exporters' earnings. More subdued global demand could also lead to lower import prices.
Members also noted that domestic inflation could fall more quickly than projected if wage- and price-setting behaviour adjusts more rapidly to a low inflation environment. For example, headline inflation will fall sustainably back to the target mid-point more quickly if price and wage setters adjust more to expected future inflation rather than to past inflation.
The Committee discussed the reasons why inflation has been outside of the target range and the expected timeframe for inflation to return to the 2 percent target mid-point. Members noted the lingering effects on inflation from demand effects of monetary and fiscal stimulus, pandemic-related disruptions to supply, increased commodity prices and shipping costs from geopolitical tension, severe weather impacts on local food prices, and low productivity.
Conditional on the information available, the Committee felt that the OCR track in the projection reflected its view on the policy strategy that would best deliver on its remit. The Committee noted that monetary policy settings are consistent with annual headline CPI inflation remaining within the target band near the 2 percent mid-point over the forecast horizon.
The Committee observed that the balance of risks has progressively shifted since the May Monetary Policy Statement. With a broad range of indicators suggesting the economy is contracting faster than anticipated, the downside risks to output and employment that were highlighted in July have become more apparent. Members were also concerned about avoiding unnecessary near-term instability in output and employment given the evolution of recent indicators.
In discussing the appropriate stance of monetary policy, the Committee noted that recent indicators give confidence that inflation will return sustainably to target within a reasonable time frame. With headline CPI inflation expected to return to the target band in the September quarter and growing excess capacity expected to support a continued decline in domestic inflation, the Committee agreed there was scope to temper the extent of monetary policy restraint.
However, members noted that monetary policy will need to remain restrictive for some time to ensure that domestic inflationary pressures continue to dissipate. The pace of further easing will thus be conditional on the Committee's confidence that pricing behaviour is continuing to adapt to a low-inflation environment and that inflation expectations remain anchored around the 2 percent target. On Wednesday August 14, the Committee reached a consensus to reduce the Official Cash Rate by 25 basis points to 5.25 percent.
Attendees
MPC members: Adrian Orr (Chair), Bob Buckle, Carl Hansen, Christian Hawkesby, Karen Silk, Paul Conway, Prasanna Gai
Treasury Observer: Dominick Stephens
MPC Secretary: Calista Cheung
Fed’s Bostic needs a little more data before supporting rate cuts
Atlanta Fed President Raphael Bostic emphasized a cautious approach regarding interest rate cuts, stating that he needs "a little more data" before supporting such a move. Bostic stressed the importance of ensuring that Fed doesn't prematurely lower rates, saying, "We want to be absolutely sure." He warned that it would be problematic if Fed cut rates and then had to reverse course by raising them again.
While Bostic acknowledged being encouraged by recent inflation readings, he reitereated that he might be ready to support a rate cut "by the end of the year." However, he remains watchful of labor market dynamics, expressing concern over the rise in unemployment. Bostic clarified that this increase is largely due to a growing labor force rather than a decline in demand, which he considers a "good problem to have."
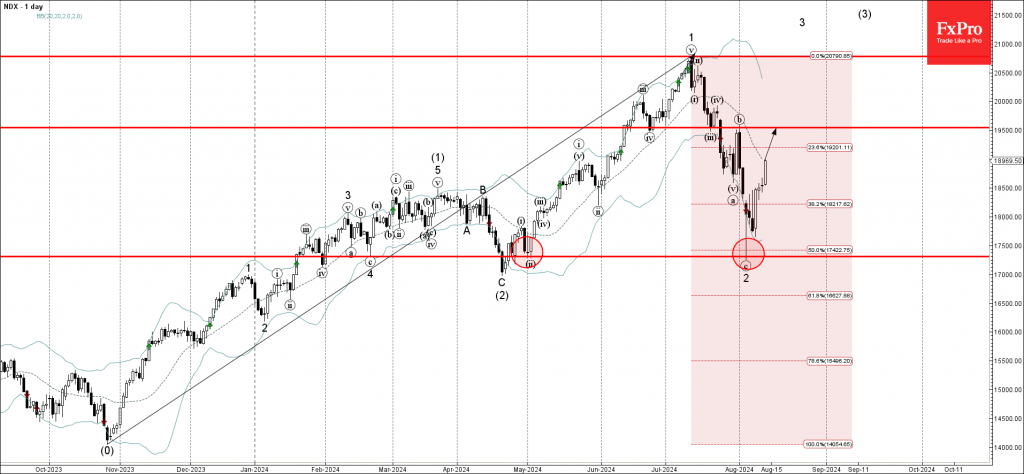
Nasdaq-100 Index Wave Analysis
- Nasdaq-100 index reversed from support zone
- Likely to rise to resistance level 19500.00
Nasdaq-100 index continues to rise inside the minor impulse wave 3, which started recently from the major support area set between the long-term support level 17300.00 (which has been reversing the index from February) and the 50% Fibonacci correction of the sharp upward impulse from last October.
The upward reversal from this support area is aligned with the intermediate impulse wave (3) from the end of April.
Given the clear daily uptrend, Nasdaq-100 index can be expected to rise further toward the next resistance level 19500.00 (which stopped the previous correction (b) in July).
AUDUSD Wave Analysis
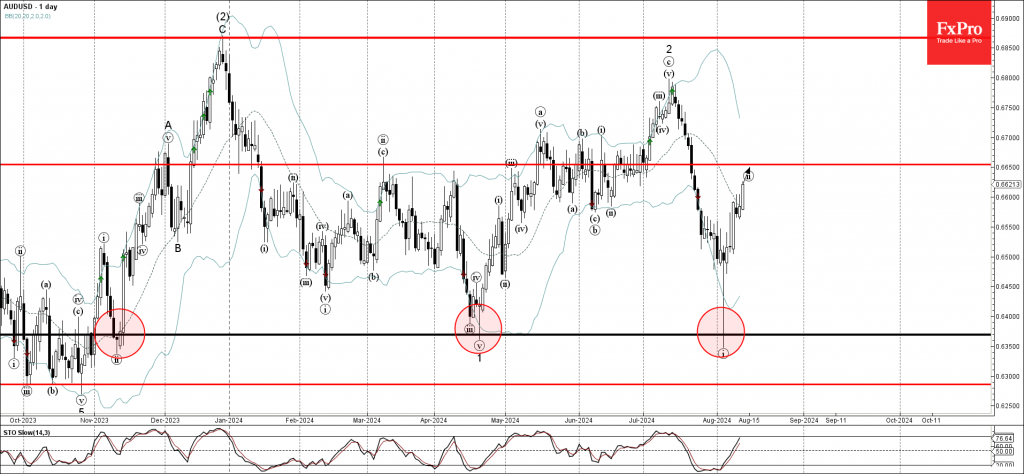
- AUDUSD reversed from support zone
- Likely to rise to resistance level 0.6650
AUDUSD currency pair recently reversed up from the powerful support area located between the long-term support level 0.6370 (which has been reversing the price from last November) and the lower daily Bollinger Band
The upward reversal from this support area created the daily Hammer which started the active ABC correction ii.
AUDUSD currency pair can be expected to rise further toward the next resistance level 0.6650 (target price for the completion of the active wave ii).