Sample Category Title
UK Labour Market Deteriorates Despite Falling Unemployment Rate
The British Pound jumped 0.25% against the Dollar and 0.33% against the Euro due to the employment data. Although key parameters of the report exceeded market expectations, the overall negative trend remains.
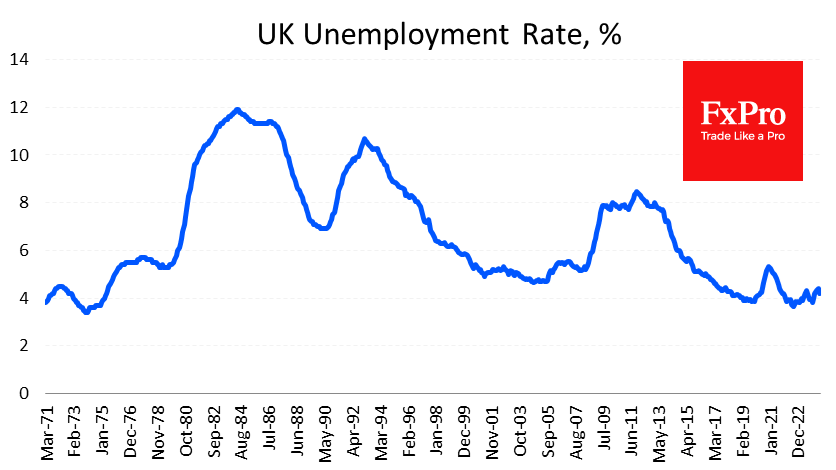
In the three months to June, the unemployment rate fell to 4.2%, in sharp contrast to the previous two months (4.4%) and beating the expected rise to 4.5%. Although the current data are well above the low of 3.6% recorded two years ago, markets have taken a positive view of the turnaround.
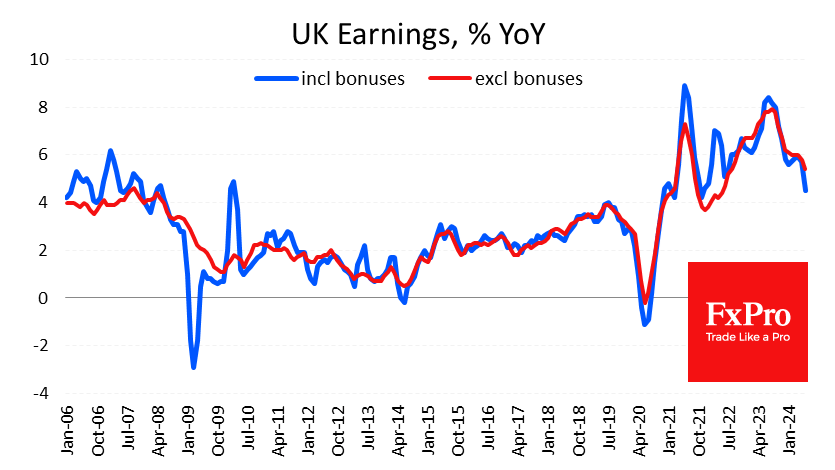
Wage growth excluding bonuses also beat expectations, rising 5.4% year-on-year in the three months to June, well above the 4.6% expected.
However, in our view, the market is too focused on looking for positives to confirm a general recovery in risk appetite. At the same time, negative signals from the labour market remain unaddressed.
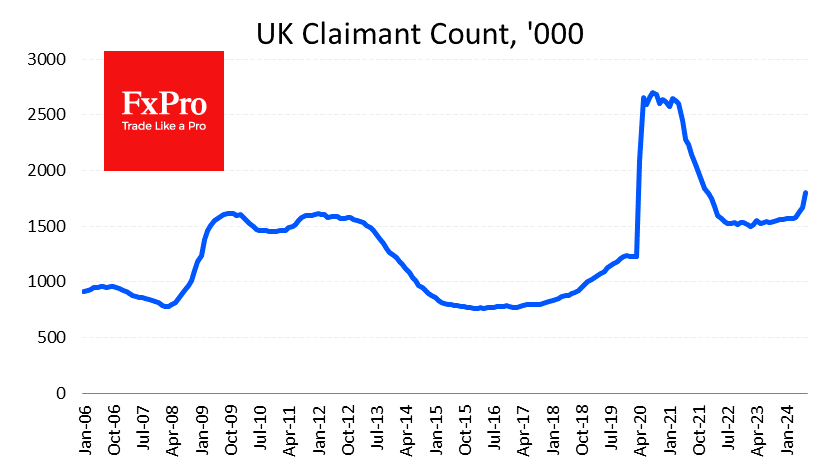
The claimant count rose by 135K in July. Month-on-month increases were higher only during the pandemic and at the beginning of 2009 because of the financial crisis.
Total earnings (i.e. including bonuses) rose by 4.5% 3m/y, the slowest pace since late 2021. We see the slowdown in this figure as a more important driver of spending pressures than payouts, excluding bonuses.
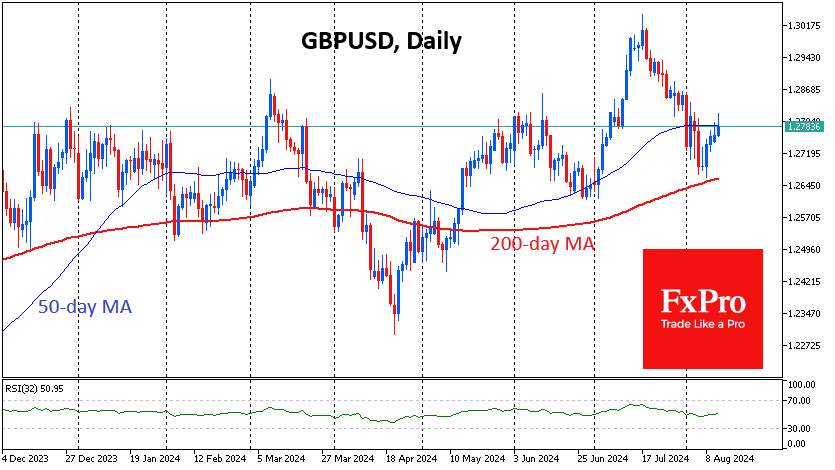
GBPUSD managed to hold above the 200-day moving average at 1.2650 early last week and is still trying unsuccessfully to break above the 50-day MA at 1.2780. The key technical level for us is the 1.2850 area, which is the 200-week MA that has acted as resistance for the past 13 months. The latest macroeconomic data tilts the scales towards the sellers.
Cryptocurrency Rally Loses Momentum
Market Picture
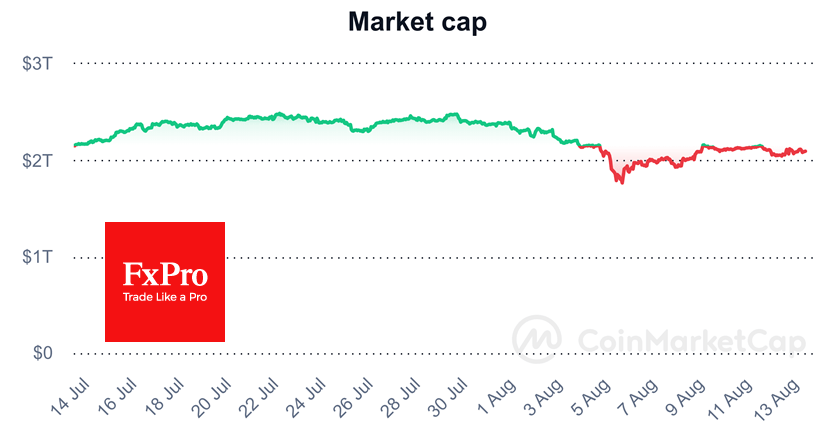
Over the past 24 hours, the cryptocurrency market has rallied 1.6% to $2.08 trillion, but in the past few hours, there has been a sell-off from a high of $2.15 – roughly the midpoint of the past 30 days’ range. Although cryptocurrency prices are higher on average than the previous day, there is a noticeable selling trend on the upside. The sentiment index stands at 31 (fear), up from 25 the previous day.
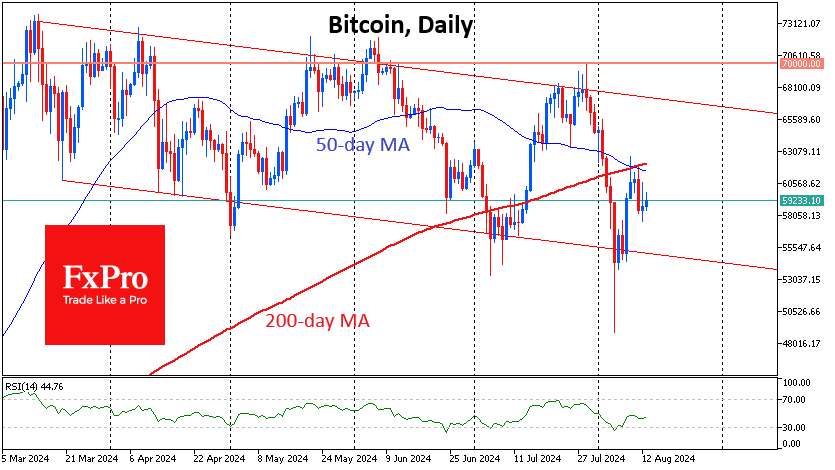
Bitcoin does not break above $60K and faces selling after it tried to break above the 50—and 200-day MAs late last week, showing seller dominance. Although sentiment has moved out of extreme fear territory, the RSI index on the daily timeframe has moved out of oversold territory, losing momentum for further strength. In this environment, Bitcoin is likely to fall by $5K rather than rise by the same amount.
Ethereum is up 4.5% in 24 hours, but on the daily chart, the 61.8% Fibonacci level from the 22nd of July high to the 5th of August low acts as the upper boundary of the technical correction.

A sharp move lower in cryptocurrencies could be a harbinger of renewed momentum pressure on equities, which are still recovering from the 5 August lows.
News Background
According to CoinShares, investments in crypto funds rose by $176 million last week after a notable weekly outflow of $528 million. Bitcoin investments were up just $13 million, Ethereum investments were up $155 million, and Solana investments were up $5 million.
Inflows are recovering from the market correction as investors saw the recent pullback as a buying opportunity. Ethereum benefited the most from the correction, bringing year-to-date inflows to $862 million, the highest since 2021. Outflows from ‘short bitcoin’ ETFs were the largest since May 2023, showing a significant investor exit, CoinShares noted.
The US SEC said it needed more time to study the rationale and legal implications of simultaneously launching a universal ETF focused on Bitcoin and Ethereum.
MARA (formerly Marathon Digital) will raise $250 million through convertible notes to buy Bitcoin and for general corporate purposes. In July, MARA increased its holdings of the first cryptocurrency by 2,282 BTC to 20,818 BTC ($1.14 billion). MARA CEO Fred Thiel said the company is committed to a “full steam ahead” strategy.
According to Blockchain.com, bitcoin miners’ revenues have slumped to a one-year low. Bitcoin mining has been pushed to the brink of profitability by marketers without access to cheap electricity, according to BlocksBridge Consulting.
Keith, who has owned 1 million Ethereum since the ICO, transferred 5,000 coins ($13.2 million) to OKX. Over the month, he sent 48,500 ETH ($154 million) to the exchange at an average price of $3176,” Lookonchain noted.
Gold Price Near Historic High Today
As shown on the XAU/USD chart, the gold price is near $2,460 today, despite the 8th August candle opening around $2,385. This means that in just over three full trading sessions, the price per ounce has risen by approximately 3.3%. It is now only about 1.6% away from the psychological level of $2,500.
Bullish sentiment is being driven by rising geopolitical tensions. According to Trading Economics:
→ Israeli airstrikes on Khan Yunis on Monday killed at least 18 people, with several others injured.
→ Ukrainian forces last week breached the Russian border and are holding positions in the Kursk region.
Technical Analysis of the XAU/USD Chart
The gold price is forming a trading channel (indicated in blue), with:
→ the current rise pushing the RSI indicator into overbought territory;
→ the price reaching the upper boundary of the blue channel;
→ in similar past situations (marked by yellow circles), a pullback to the channel’s median has consistently occurred, but this does not guarantee the same outcome this time;
→ the $2,436 level may act as support for the current price, having shown resistance signs on Friday before being breached by bulls.
It is possible that the gold price could set a new all-time high, driven by volatility spikes in the coming days.
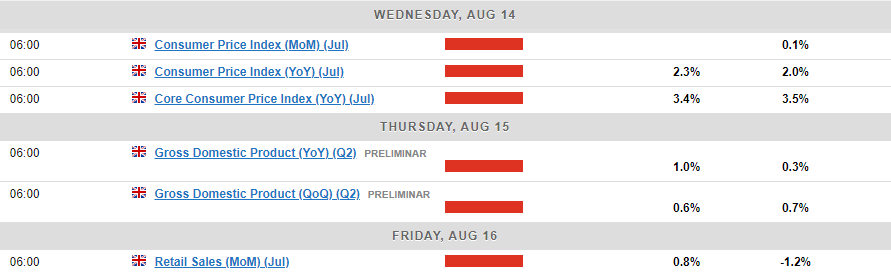
The current bullish sentiment may be supported by market participants positioning themselves ahead of key US economic news: the Consumer Price Index (CPI) report will be released tomorrow (at 15:30 GMT+3), and on Thursday (also at 15:30 GMT+3), Core Retail Sales data and unemployment news will follow.
According to Dow Jones Newswires, Axis Securities research analyst Deven Gaglani believes that “a break above the $2,483 high and a weekly close above this level would be a bullish signal, potentially pushing prices to $2,550.” He also suggests that news of easing inflation could lead to a rise in gold prices.
Start trading commodity CFDs with tight spreads. Open your trading account now or learn more about trading commodity CFDs with FXOpen.
This article represents the opinion of the Companies operating under the FXOpen brand only. It is not to be construed as an offer, solicitation, or recommendation with respect to products and services provided by the Companies operating under the FXOpen brand, nor is it to be considered financial advice.
German ZEW plummets to 19.2, economy breaking down
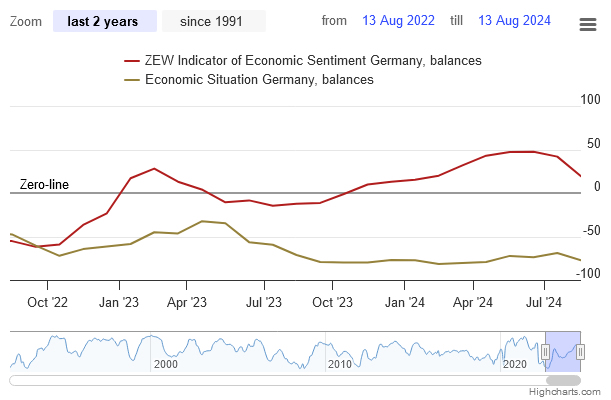
Germany's ZEW Economic Sentiment index took a significant hit in August, falling sharply from 41.8 to 19.2, well below the expected 30.6. This marks the steepest monthly decline since July 2022. Current Situation Index also worsened, dropping from -68.9 to -77.3.
Similarly, Eurozone's ZEW Economic Sentiment index fell from 43.7 to 17.9, missing expectations of 35.4. However, Current Situation Index for Eurozone showed a slight improvement, rising by 3.7 points to -32.4, although it remains in negative territory.
ZEW President Achim Wambach noted that the economic outlook for Germany is "breaking down." He highlighted that this month's survey revealed the sharpest decline in economic expectations over the past two years, not just for Germany, but also for the Eurozone, the US, and China.
Wambach pointed out that expectations for "export-intensive" sectors in Germany are particularly bleak. He attributed this deterioration to ongoing high uncertainty, driven by unclear monetary policy directions, disappointing business data from the US, and escalating concerns about the Middle East conflict.
GBP/USD Edges Higher as Wage Growth Hits Lowest Level in 2 Years
- Unemployment rate fell to 4.2%, with a decrease in both short-term and long-term unemployment.
- UK wage growth slowed to its lowest level in two years, yet surpassed market expectations.
- Despite positive jobs data, BoE policymakers warn of potential inflation rebound in H2 2024, supported by a slight increase in grocery inflation.
- Cable edged higher but key resistance levels up ahead.
Cable has continued to edge higher this morning following the UK jobs report. The data was mixed with unemployment improving substantially while pay growth hit its lowest level in two years.
According to the Office of National Statistics (ONS), preliminary data for July 2024 shows a 0.8% increase in payrolled employees compared to July 2023, translating to an additional 252,000 workers. The health and social work sector saw the most significant annual growth, adding 163,000 employees.
In the UK, regular pay excluding bonuses increased by 5.4% year-on-year, reaching GBP 645 per week in the three months leading up to June 2024. This marks the smallest rise since August 2022, down from a 5.8% increase in the previous three months, yet surpassing market expectations of 4.6%.
Wage growth slowed in both the private sector (5.2% vs. 5.6%) and the public sector (6.0% vs. 6.4%). The finance and business services sector experienced the highest annual regular wage growth rates at 6.2%, followed by manufacturing at 6.0% and services at 5.5%. When adjusted for inflation, real-term wage growth for regular pay excluding bonuses slightly decreased to 2.4% from 2.5%.
The surprise came from the unemployment rate which fell to 4.2% with estimates of a 4.5% print. The number of unemployed individuals fell by 51,000, reaching a total of 1.44 million, primarily due to declines among those unemployed for up to 6 months, bringing the figure below last year’s levels.
Furthermore, the number of people unemployed for over 6 months and up to 12 months, as well as those unemployed for over 12 months, also decreased but remained higher than last year’s estimates. Concurrently, the number of employed individuals rose by 97,000 to 33.1 million, mainly driven by an increase in part-time employees and self-employed workers, partially offset by a reduction in full-time employees.
In the three months leading up to June 2024, the number of employed individuals in the United Kingdom rose by 97,000, marking the second consecutive period of growth following a 19,000 increase in the previous three months.
This period also saw the highest job creation rate since the three months ending in November 2023, primarily due to an uptick in part-time employees and self-employed workers. Conversely, the number of full-time employees declined during the latest quarter.
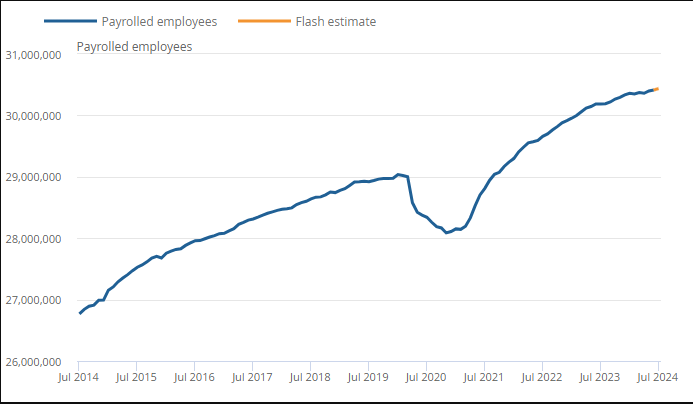
Source: ONS
The Bank of England (BoE) Policymakers Issue Inflation Warning
Despite the generally positive jobs report, BoE Policymaker Catherine Mann reiterated her concerns about a potential rebound in inflation during the second half of 2024. This echoes the sentiments expressed by Governor Bailey at the latest BoE MPC meeting.
Both Mann and Bailey’s comments were supported this morning as industry data showed grocery inflation rising for the first time since March 2023. According to market researcher Kanta, annual grocery inflation was 1.8% for the four weeks ending August 4, compared to 1.6% in the previous four-week period.
UK inflation data is expected tomorrow, and the recent rise in inflation may not yet be reflected in the figures. However, there is cause for concern. Despite various improving metrics in the UK, such as household savings, citizens remain cautious about the outlook for the next six months.
Technical Analysis
From a technical standpoint, GBP/USD has risen since last Thursday’s low of approximately 1.2665.
Observing the daily chart, the overall trend is still bullish, with a daily candle close below the 1.2618 support level required to signal a structural change.
After breaking the ascending trendline, GBP/USD is now retesting this level, where there is resistance around the 1.2800 mark.
A move upward will encounter resistance at 1.2850 and 1.2950. Conversely, any downward movement will find immediate support at 1.2750, followed by significant confluence and support around the 1.2690-1.2660 range.
GBP/USD Chart, August 13, 2024
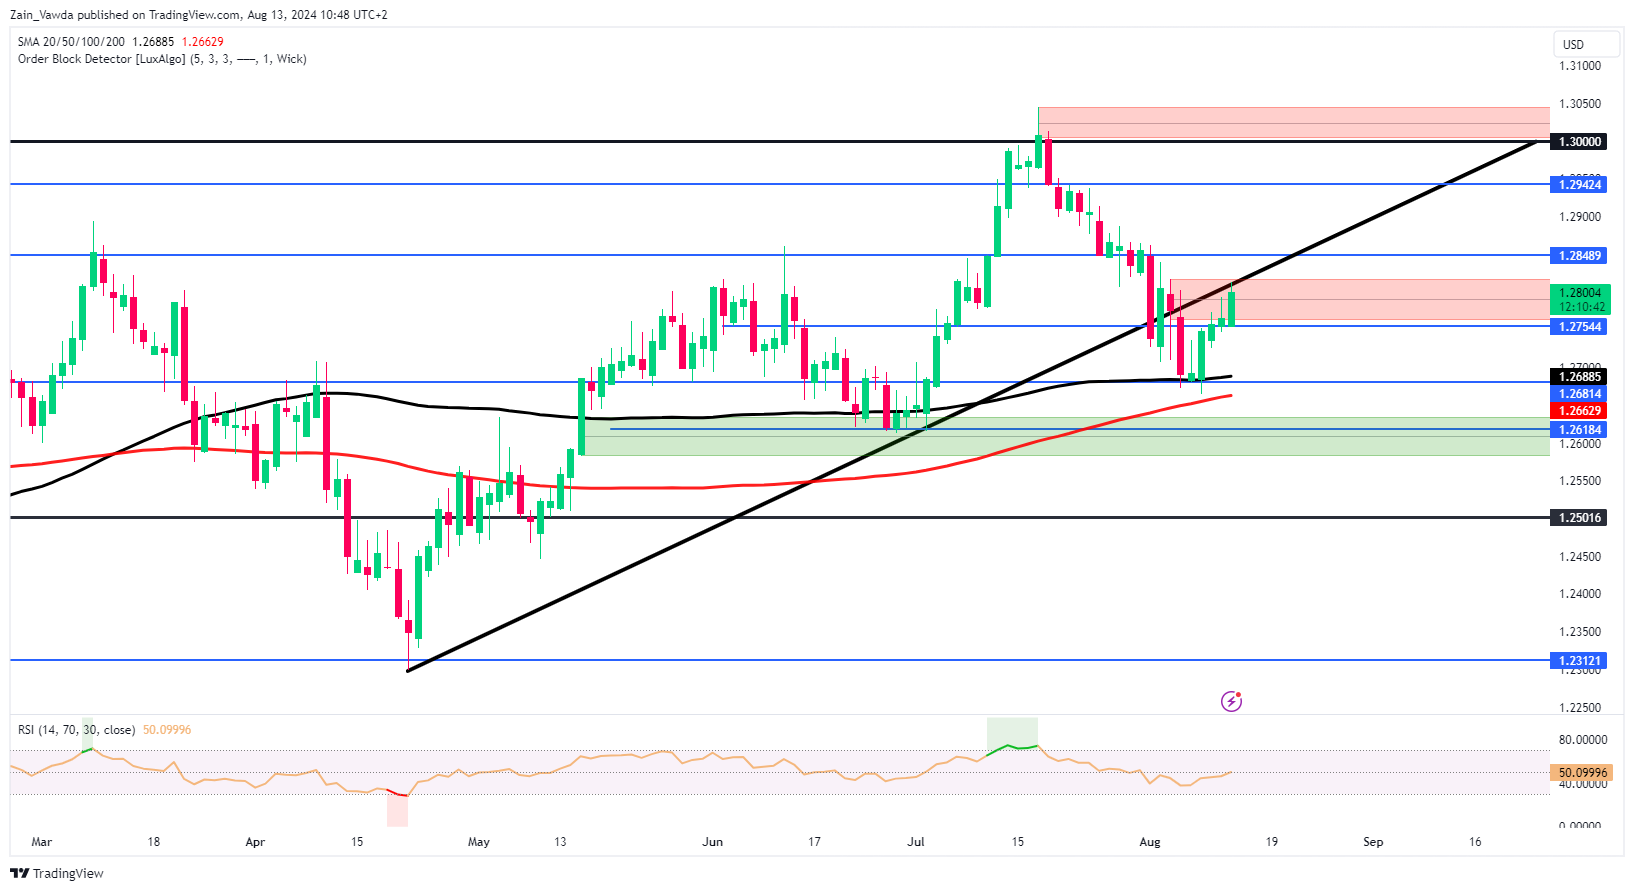
Source: TradingView (click to enlarge)
Support
- 1.2750
- 1.2690
- 1.2600
Resistance
- 1.2850
- 1.2950
- 1.3000
EUR/USD Outlook: In Quiet Mode, Awaiting Economic Data for Fresh Ssignals
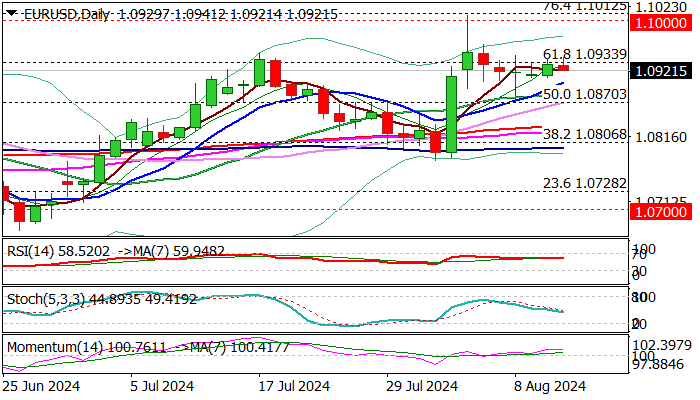
EURUSD is holding within a narrow congestion, capped by Fibo resistance at 1.0933 (Fibo 61.8% of 1.1139/1.0601), as markets slowed ahead of key release this week – US inflation report.
German ZEW economic sentiment (July f/c 32.6 vs June 41.8) due in a while, would also impact Euro’s sentiment.
Technical picture is predominantly bullish on daily chart (strong positive momentum / 10-20DMA bull-cross), but firm break of 1.0933 pivot is required to revive larger bulls after consolidation and expose key barriers at 1.1000 zone (psychological / Fibo 76.4%) where the action faced strong upside rejection last week.
Near-term bias is expected to remain bullish above rising 10DMA (1.0901), guarding lower pivots at 1.0882/70 (20DMA / broken 50% retracement) loss of which would weaken near term structure and risk further drop.
Res: 1.0933; 1.0945; 1.0962; 1.1000.
Sup: 1.0901; 1.0882; 1.0870; 1.0832.
Brent Crude Oil Faces Demand Concerns Despite Recent Gains
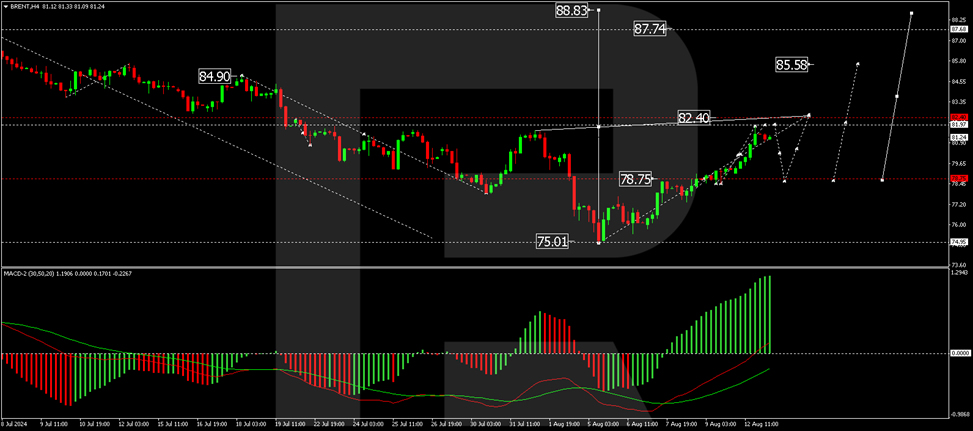
After five consecutive days of upward movement, Brent crude oil is now experiencing a consolidation phase, with prices retreating slightly to 81.80 USD per barrel on Tuesday. Market sentiment is being influenced by renewed concerns over global oil demand, particularly following OPEC's downward adjustment of its demand forecasts for 2024 and 2025. This adjustment reflects weaker-than-expected economic data from China and reduced regional demand projections.
OPEC now estimates global oil demand will grow by 2.11 million barrels per day (bpd) in 2024, down from its previous forecast of 2.25 million bpd. For 2025, the projection has been revised to 1.78 million bpd from 1.85 million bpd. These revisions are mainly due to the sluggish economic indicators emerging from China, a significant driver of global oil demand.
The ongoing conflict in the Middle East keeps market participants on edge. A new round of negotiations could be scheduled for Thursday, although there remains uncertainty about whether they will occur. Market players are particularly concerned about the potential for escalated conflicts involving Israel and Iran, which could disrupt oil supplies from the region and create further volatility in oil prices.
Technical analysis of Brent crude oil
The technical forecast on the Brent crude shows that the price is forming a consolidation range around 78.75 USD, with a recent upward breakout continuing the growth trend towards 81.97 USD. This level serves as a local target. Upon reaching this level, a correction back to 78.75 USD may occur, followed by a potential rise towards 82.40 USD. This bullish scenario is supported by the MACD indicator, which, despite being below zero, shows a clear upward trajectory.
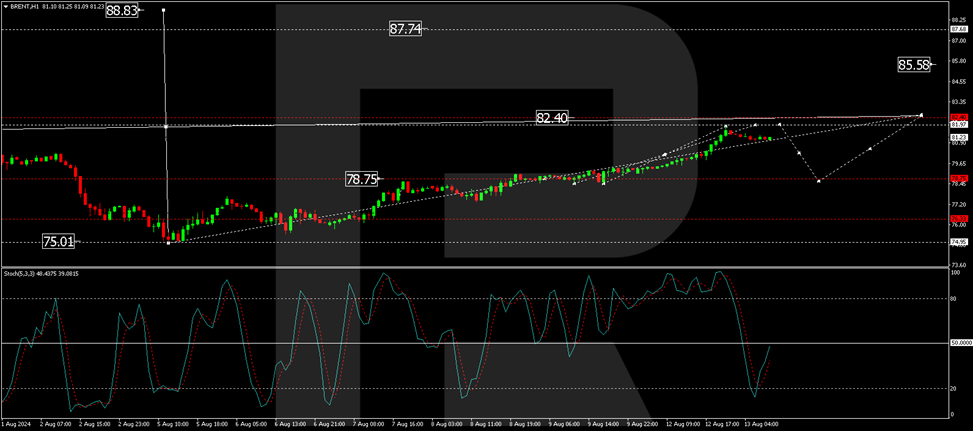
On the H1 chart, Brent found support at 78.44 USD and is developing a growth structure towards 81.97 USD. Having already reached a local target at 81.90 USD, a corrective move to at least 80.17 USD could follow before resuming the upward trend. The stochastic oscillator, positioned near the 20 mark, indicates potential for upward movement, aligning with the broader bullish sentiment observed on the H4 chart.
EURUSD Bulls Don’t Want to Give Up
- EURUSD maintains sideways move as 1.0940 barrier blocks the way up
- Technical risk is on the positive side; eyes on 1.0970 too
- US PPI due at 12:30 GMT; FOMC member Bostic speaks today
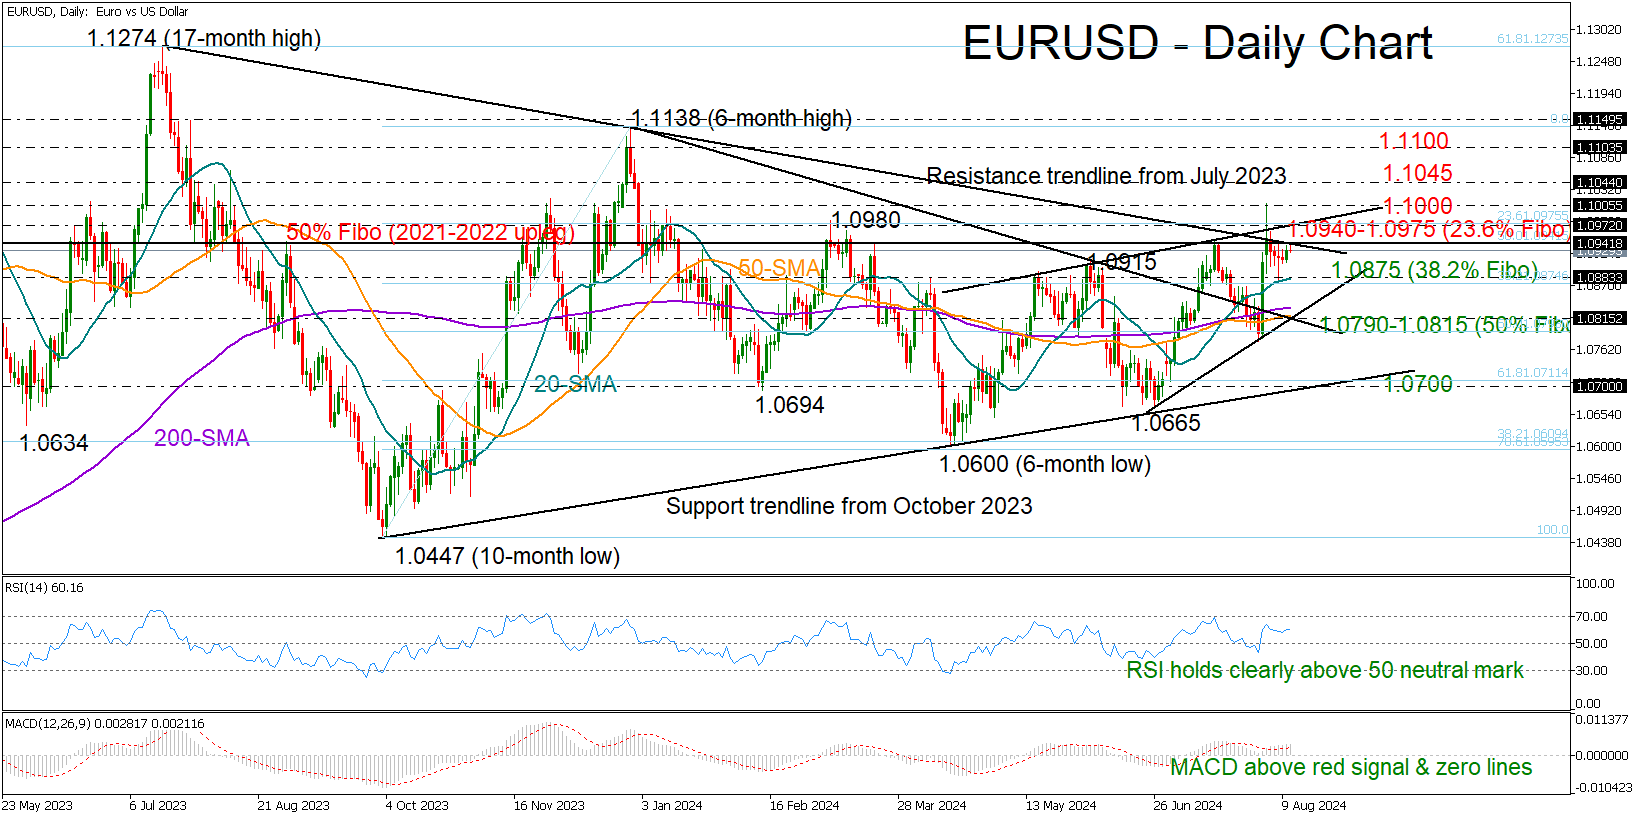
EURUSD continues to face restrictions near the 1.0940 level and the resistance trendline from July 2023, which squeezed the price below a seven-month low of 1.1007 last week.
The RSI has yet to reach overbought levels, remaining elevated within the bullish area. Similarly, the MACD is staying comfortably above its red signal line, implying that the bulls might continue to defend the bounce off the 20-day SMA.
A decisive close above the 1.0940-1.0970 area could provide direct access to the 1.1000 psychological mark, while an extension above the 1.1045 barrier could open the door for the 1.1100 round level. The 1.1150 region could be the next destination if upside forces persist.
On the downside, the 20-day SMA coupled with the 38.2% Fibonacci retracement of the October-December upleg may hinder selling pressure near 1.0875, preventing a drop into 1.0790-1.0815. Should the bears breach the latter, the decline could pick up steam towards the 1.0700 mark.
All in all, EURUSD might have some extra bullish fuel in the tank. Whether this will be sufficient to surpass the strong resistance range of 1.0940-1.0970 remains to be seen.
GBPUSD Battles With 50-day SMA
- GBPUSD advances after its bounce off 200-day SMA
- A potential breach of 50-day SMA could improve outlook
- Oscillators suggest strengthening positive momentum
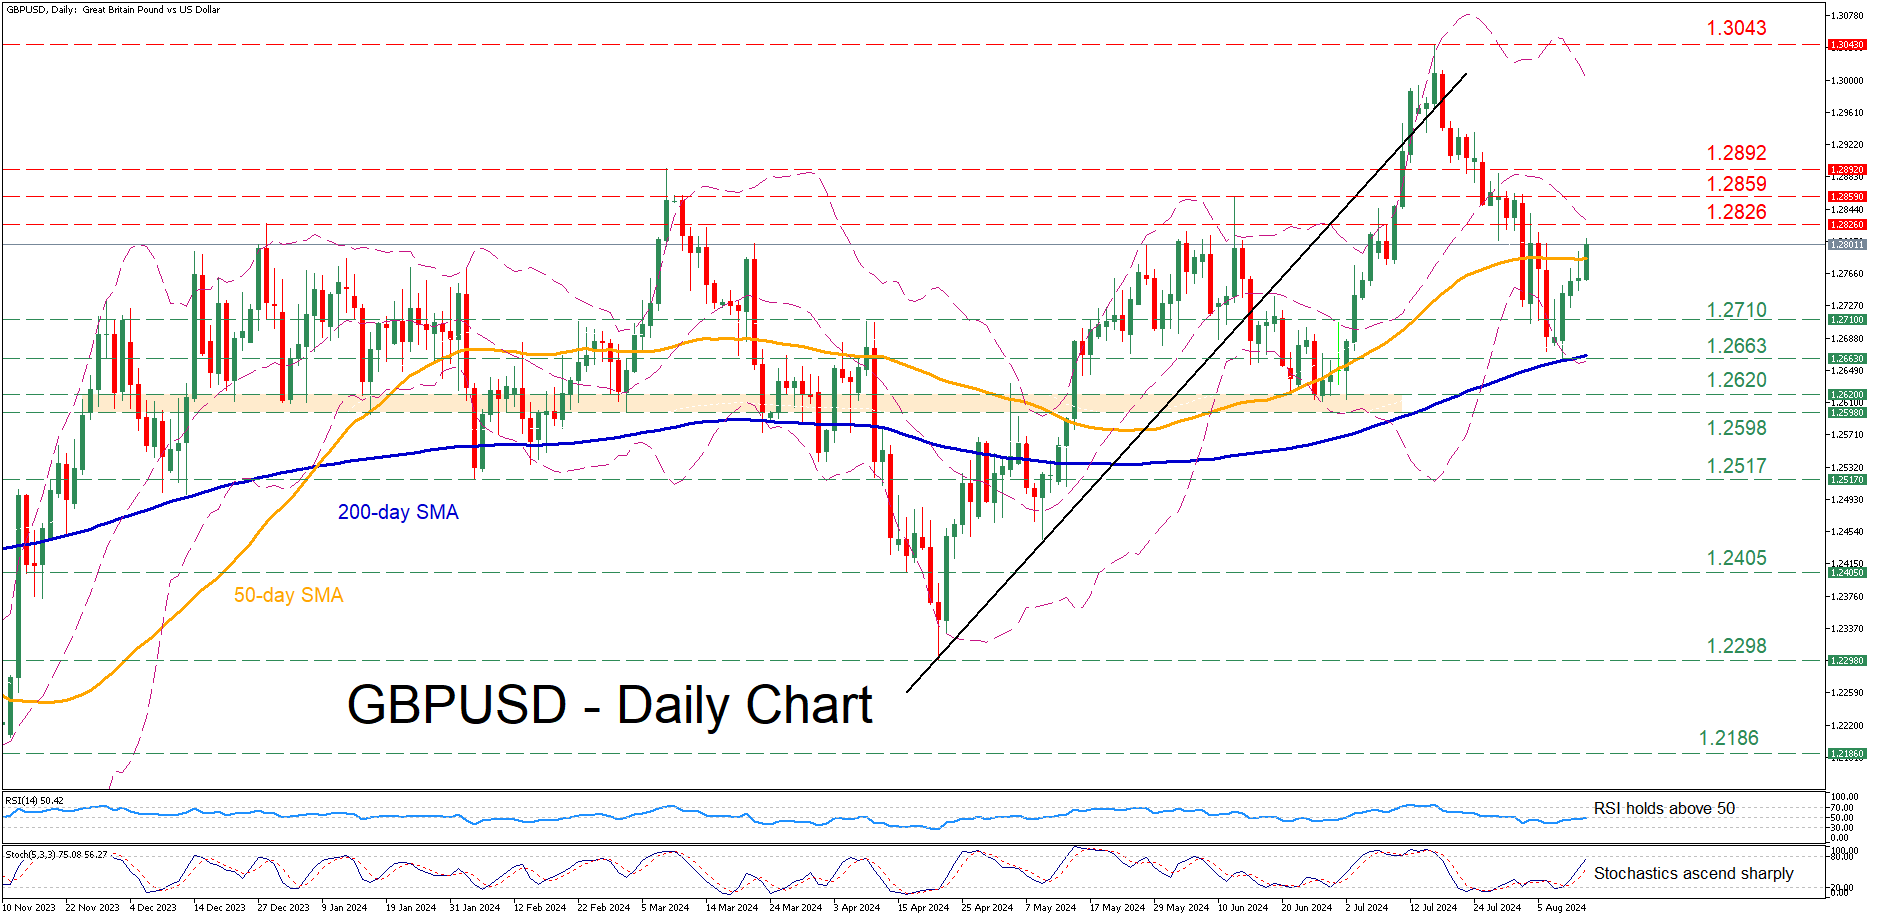
GBPUSD had been on the rise following its deflection at the 200-day simple moving average (SMA) on August 8. After four consecutive daily green candlesticks, the pair is on track to reclaim its 50-day SMA as the momentum indicators are hinting at an improving positive bias.
If the price extends its recent rebound, immediate resistance might be found at the December 2023 high of 1.2826. Higher, the June peak of 1.2859 may prove to be the next barricade for the bulls to clear. A break above that zone could open the door for the March high of 1.2892.
On the flipside, initial declines could pause at 1.2710, a region that provided resistance multiple times in the recent past but could now serve as support. Slicing through that wall, the pair may challenge the August low of 1.2663, which overlaps with the 200-day SMA. Failing to halt there, the pair might descend towards the 1.2620-1.2598 range, which is framed by the June and March lows.
Overall, GBPUSD has been gaining ground in the past few sessions after finding its feet at the crucial 200-day SMA. However, a failure to claim the 50-day SMA, which is currently under scrutiny, could lead to the pair reversing back lower.
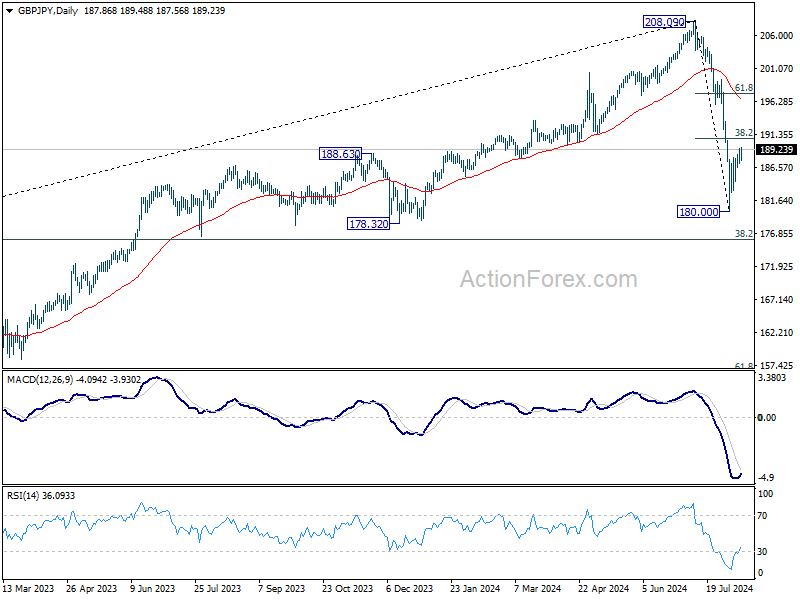
GBP/JPY Daily Outlook
Daily Pivots: (S1) 186.87; (P) 188.10; (R1) 189.15; More...
Intraday bias in GBP/JPY stays neutral and outlook remains bearish with 38.2% retracement of 208.09 to 180.00 at 190.73 intact. On the downside, below 184.46 minor support will turn intraday bias back to the downside for retesting 180.00 low. Break there will resume the fall from 208.90 to 178.32 support next. However, firm break of 190.73 will extend the rebound to 61.8% retracement at 197.35, even as a corrective move.
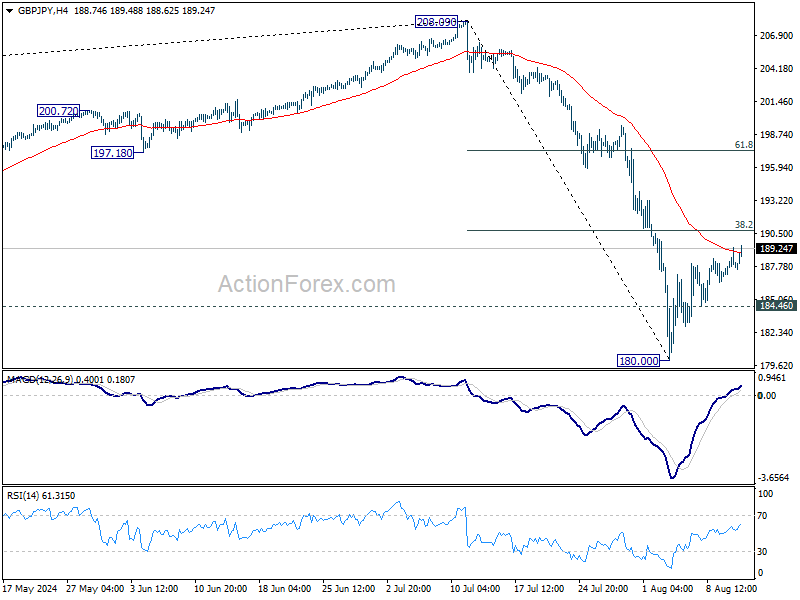
In the bigger picture, fall from 208.09 medium term top is seen as correcting the up trend from 123.94 (2020 low). Deeper decline is in favor as long as 55 W EMA (now at 189.18) holds. But strong support could emerge between 178.32 and 38.2% retracement of 123.94 to 208.09 at 175.94 to bring rebound. Meanwhile, sustained trading above 55 W EMA will suggest that the range for the medium term corrective pattern is already set.