Sample Category Title
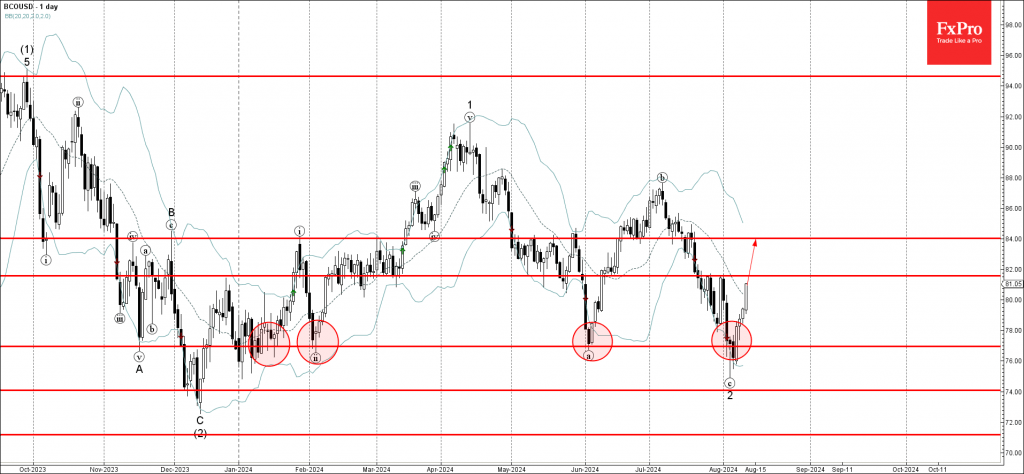
Brent Crude Oil Analysis
- Brent crude oil reversed from support zone
- Likely to rise to resistance levels 81.60 and 84.00
Brent crude oil recently reversed up from the support zone set between the strong support level 77,00 (which has been reversing the price from January) and the lower daily Bollinger Band.
The upward reversal from this support area created the daily Hammer and then the daily Piercing Line – which highlights the strength of this area.
Brent crude oil can be expected to rise further toward the next resistance level 81.60, the breakout of which can lead to further gains toward 84.00.
NASDAQ (NQ_F) Nice Reaction Higher From Blue Box Area
In this technical blog, we will look at the past performance of the 4-hour Elliott Wave Charts of NASDAQ (NQ_F). We presented to members at the elliottwave-forecast. In which, the rally from the 13 October 2022 low unfolded as an impulse structure and showed a green right side tag. Suggested that the index should see more upside extension to complete the impulse sequence. Therefore, we advised members not to sell the index & buy the dips in 3, 7, or 11 swings at the blue box areas. We will explain the structure & forecast below:
NASDAQ (NQ_F) 4-Hour Elliott Wave Chart From 8.04.2024
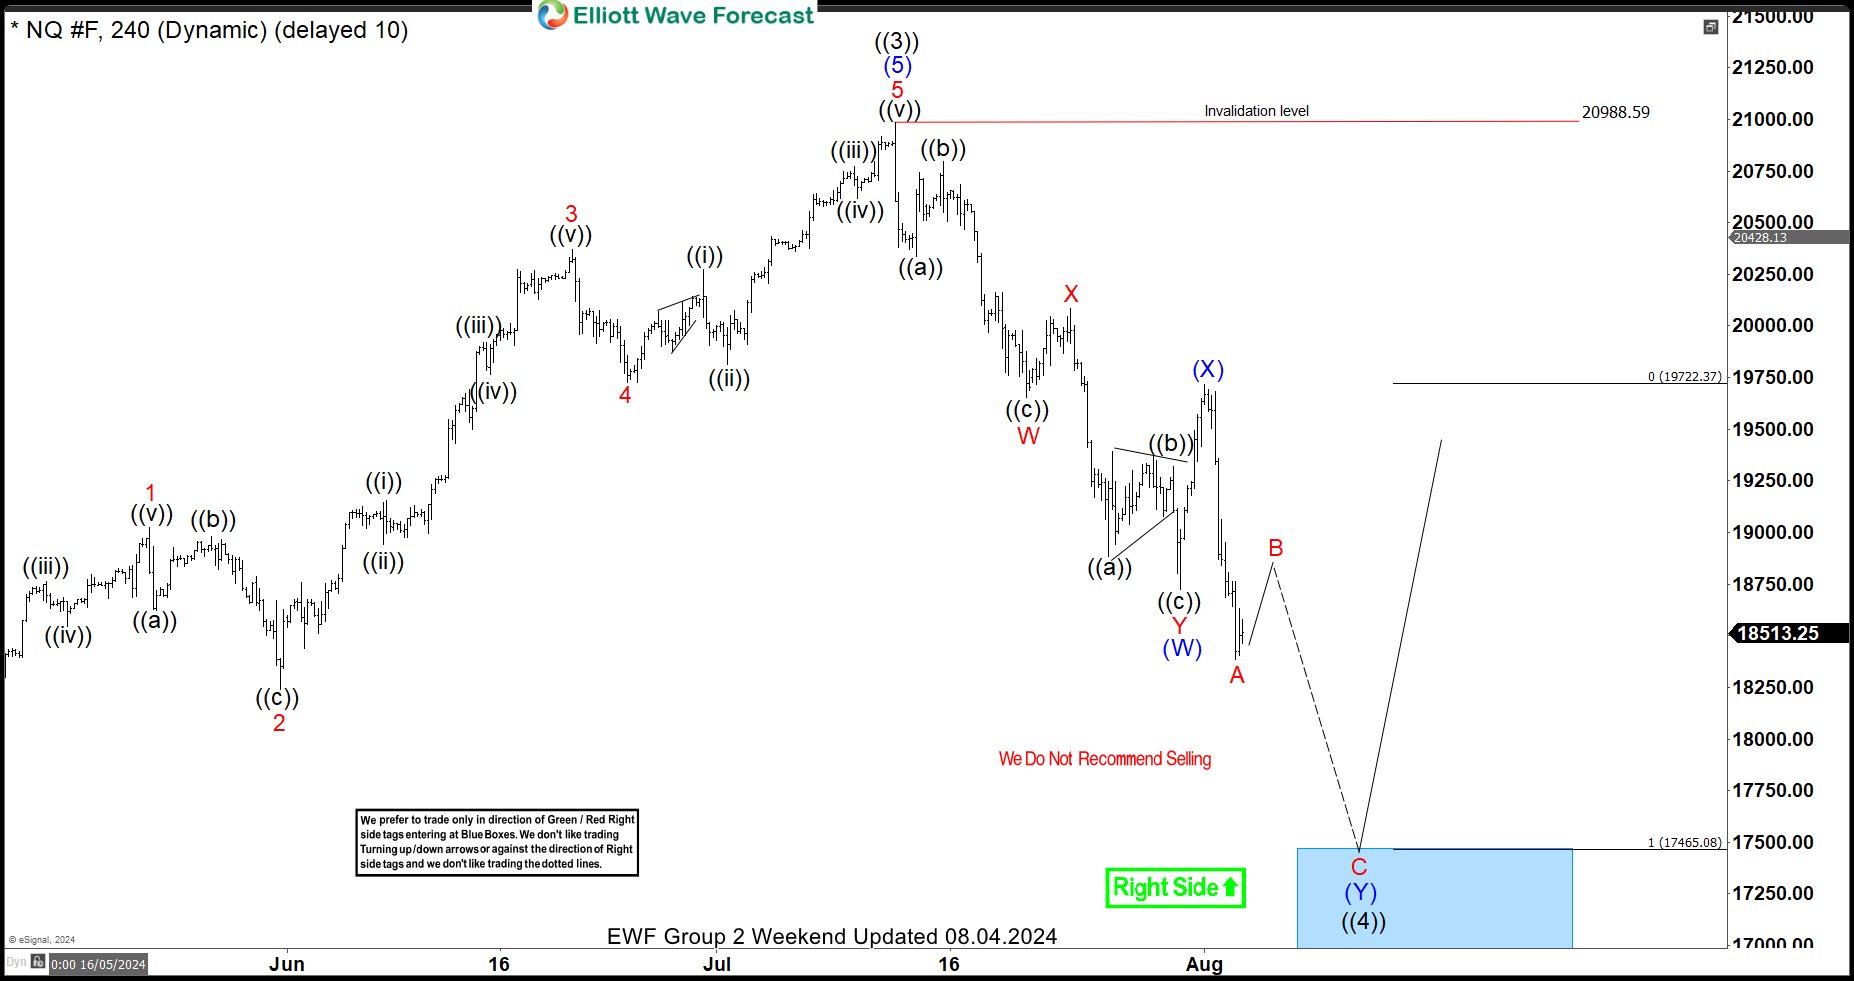
Here’s the 4-hour Elliott wave chart from the 8.04.2024 Weekend update. In which, the short-term cycle from the 1.06.2023 low ended in wave ((3))) as impulse at $20988 high. Down from there, the index made a pullback in wave ((4)) to correct that cycle. The internals of that pullback unfolded as Elliott wave double three structure where wave (W) ended at $18725 low. Wave (X) bounce ended at $19717 high and wave (Y) managed to reach the blue box area at $17465- $16942. From there, buyers were expected to appear looking for the next leg higher or for a 3 wave bounce minimum.
NASDAQ (NQ_F) Latest 4-Hour Elliott Wave Chart From 8.11.2024
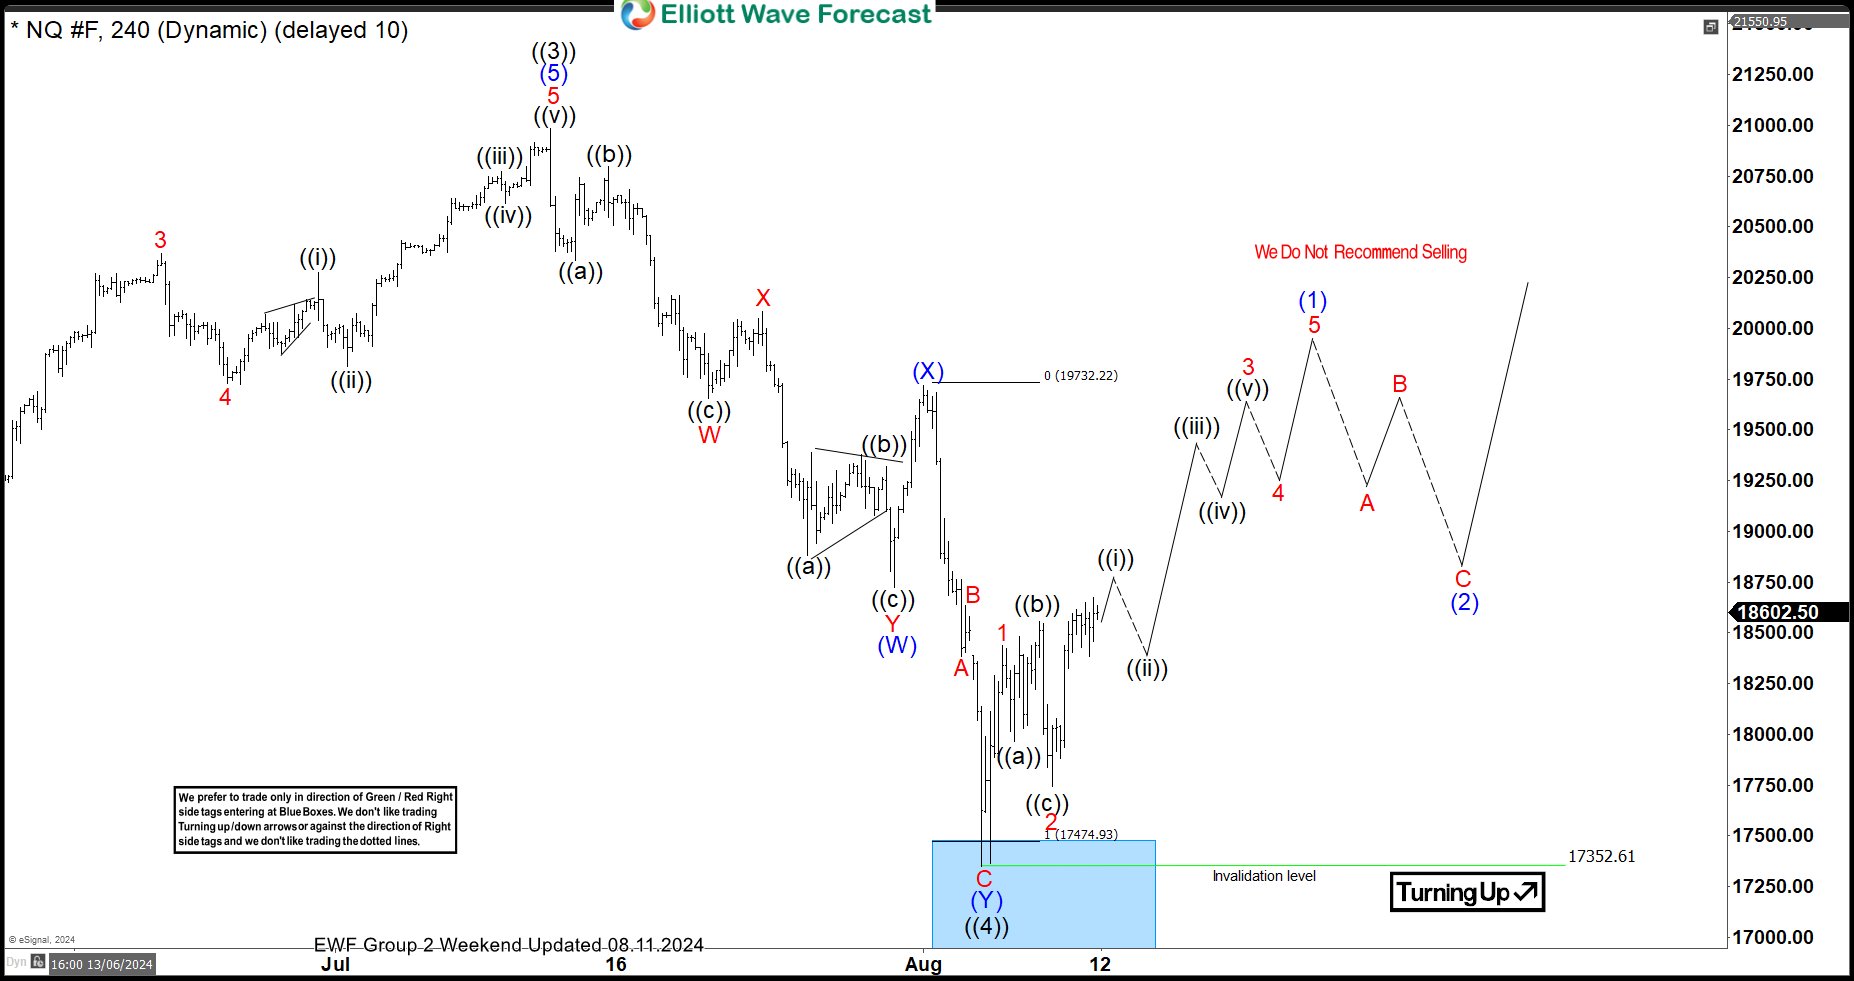
This is the latest 4-hour Elliott wave Chart from the 8.11.2024 Weekend update. In which the index is showing a reaction higher taking place, right after ending the double correction within the blue box area. Allowed members to create a risk-free position shortly after taking the long position at the blue box area. However, a break above $20988 high is still needed to confirm the next extension higher & avoid double correction lower.
New Zealand Dollar Higher, Focus on RBNZ
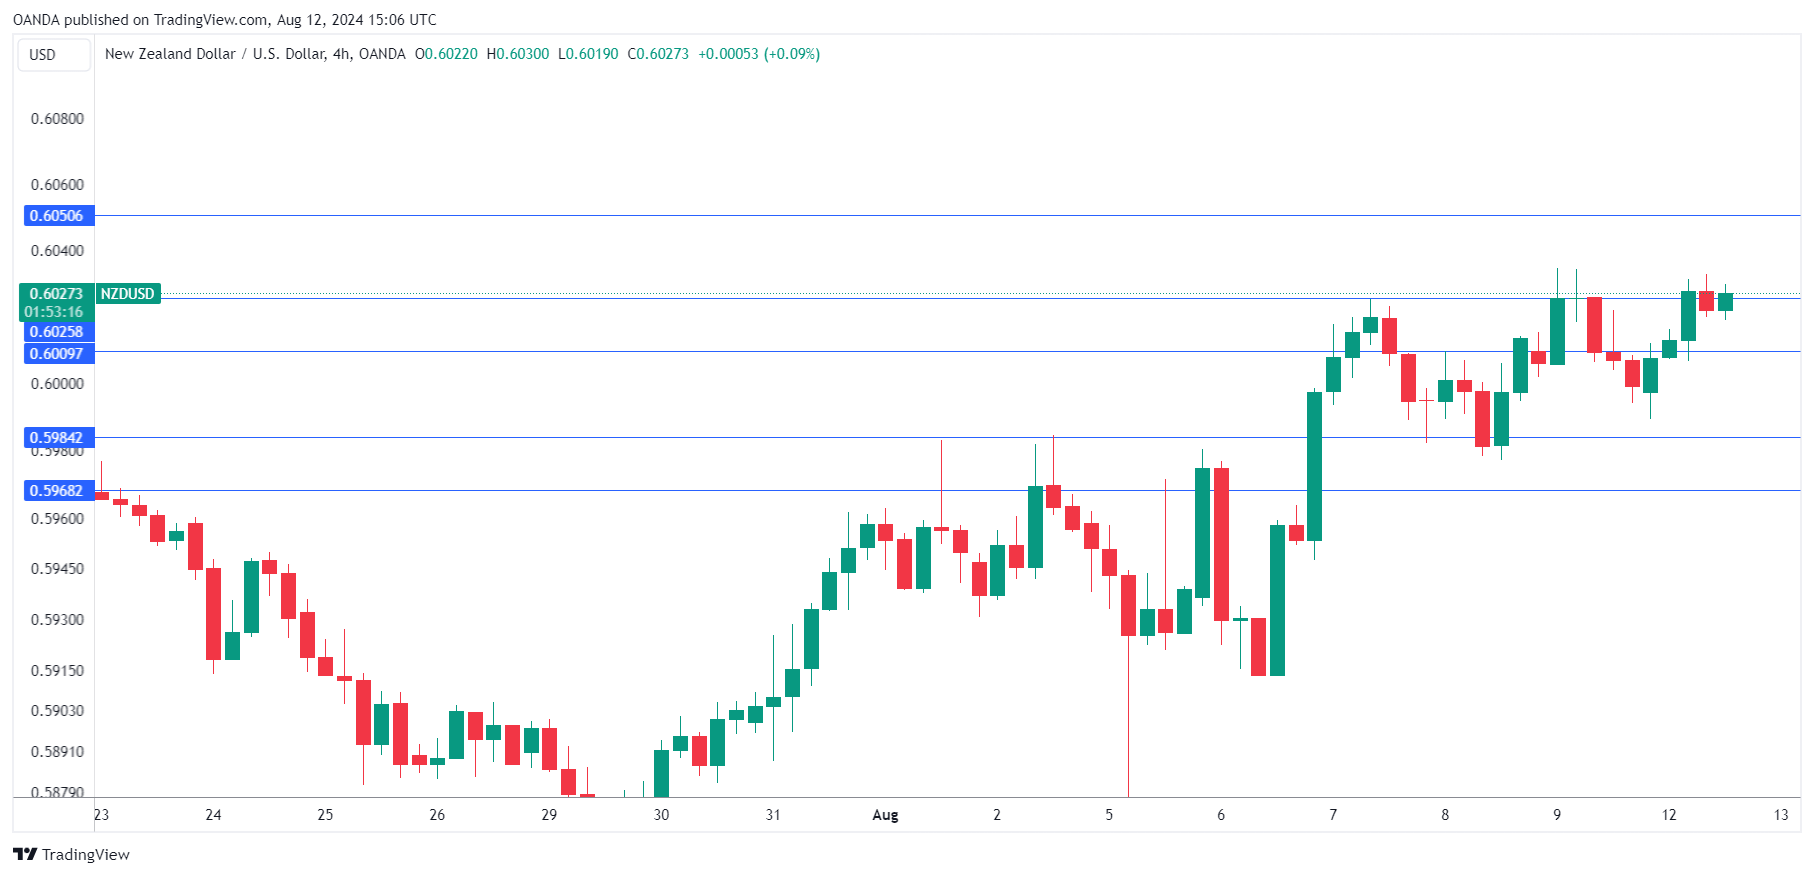
The New Zealand dollar has started the week with gains. NZD/USD is trading at 0.6026 in the North American session, up 0.45% at the time of writing.
Will the RBNZ lower rates this week?
The Reserve Bank of New Zealand meets on Wednesday and it’s a live meeting as the decision is expected to be a close call. Will the central bank hold rates for a ninth straight time or will it take the plunge and cut rates? Inflation remains sticky and the RBNZ projected in May that it would not cut rates until 2025. On the other hand, the economy has cooled and is likely to fall into a third recession in just two years, putting pressure on the central bank to provide some relief with a rate cut.
If the Bank decides not to lower rates, it could put a dovish spin on the meeting and say that it discussed lowering rates at the meeting and is open to a cut in October or November. The swap markets are somewhat bullish on a rate cut this week and have priced in a 70% chance of a quarter-point rate cut.
The Federal Reserve will almost certainly cut next month, but by how much? Just one month ago, the markets had priced in a quarter-point cut at 90%, according to the CME’s FedWatch, but that was before the US posted weak numbers and the financial markets melted. This has boosted the likelihood of a half-point cut, which on Friday was around a 50/50 split with a quarter-point cut.
Still, not everybody is on board with a rate cut. Fed Governor Michelle Bowman, a voting member on the FOMC, said on Friday that she is hesitant about cutting rates, since inflation is “uncomfortably above” the 2% target and the labor market remains strong.
NZD/USD Technical
- NZD/USD has pushed above resistance at 0.6009 and 0.6025. Above, there is resistance at 0.6050
- There is support at 0.5984 and 0.5968
Silver Could Be Bottoming
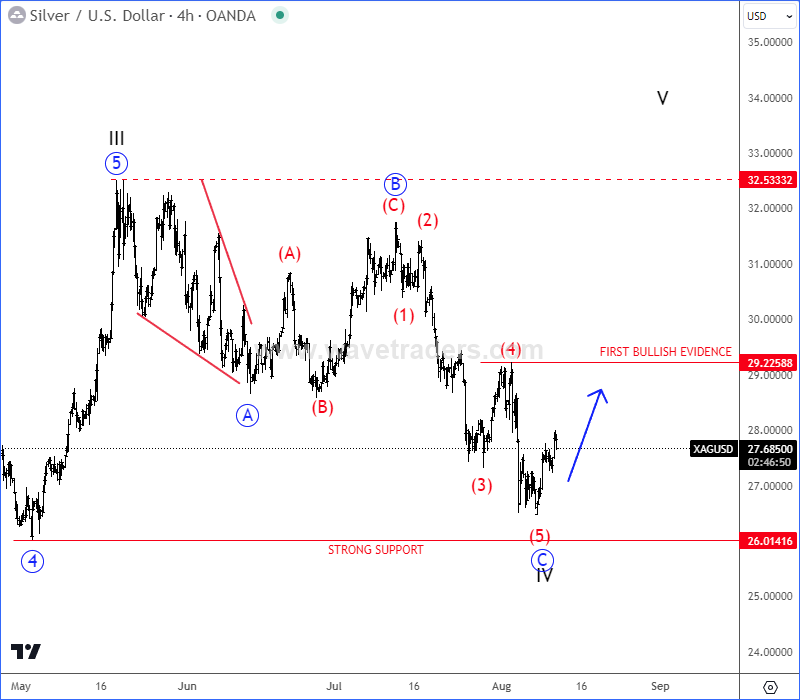
Silver has been slowing down for the last three months, but drop on 4h time frame is in three waves A-B-C, which indicates for a corrective decline within higher degree wave IV. It’s now potentially finishing final subwave (5) of C at 26,50 – 26,00 strong and key support area. If we get sharp or five-wave impulsive recovery back above 29,22 first bullish evidence level, then it can easily send the price back to highs for wave V.
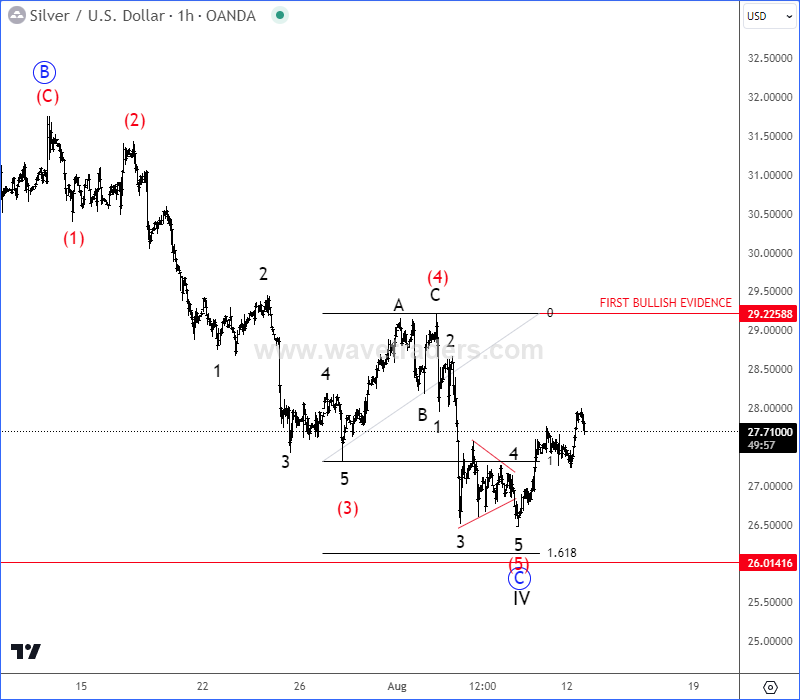
On the intraday basis silver nicely spiked into final wave 5 of a lower degree impulse within wave (5) of C as expected, from where we may now see a bullish reversal, but we still need sharp or impulsive five-wave recovery to confirm a bullish reversal.
British Pound Calm ahead of UK Jobs Report
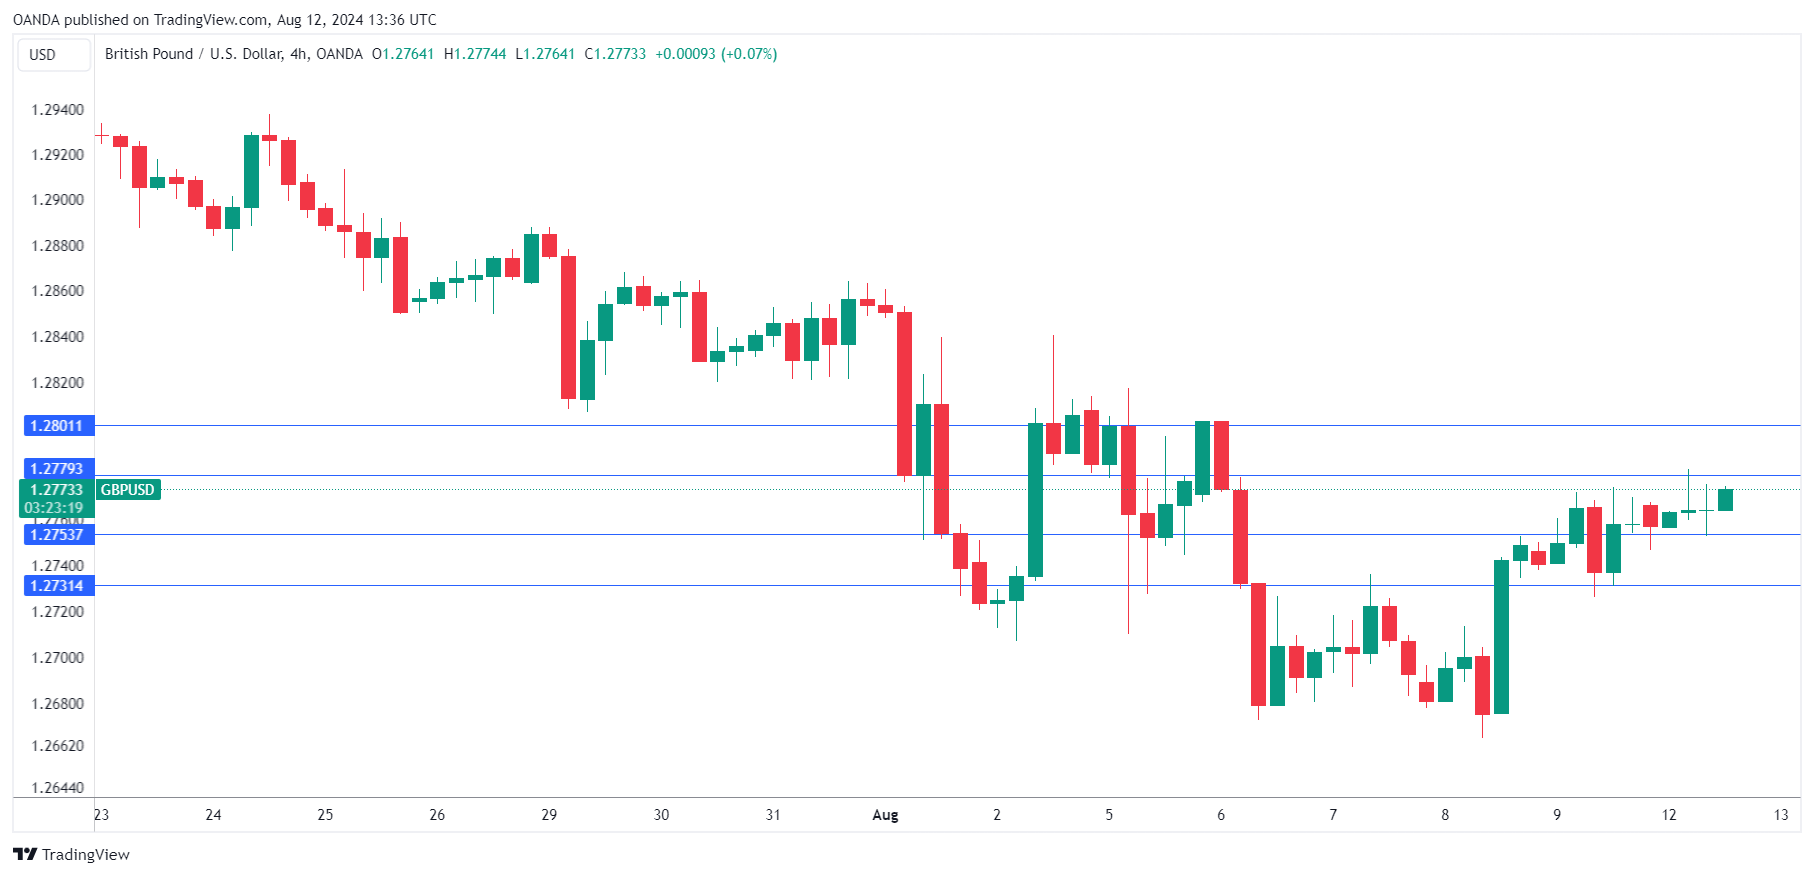
The British pound is drifting on Monday. GBP/USD is trading at 1.2768 early in the North American session, up 0.08% on the day.
Wage growth expected to slide
The UK releases the employment report for the three months to June and we could see signs of a cooling labour market. Annualized average earnings including bonuses, which has hovered between 5.5%-6% all year, is expected to fall sharply to 4.6%. The previous reading came in at 5.7%, the lowest since September 2022.
The unemployment rate has remained unchanged at 4.4% for the past two readings, the highest since September 2021. Unemployment is expected to nudge up to 4.5% in the three months to June. This would signal that the labor market is weakening and would make
If wage growth declines and the unemployment rate rises in tomorrow’s report, it would support the case for the Bank of England delivering another rate cut, perhaps as soon as next month. The BoE meets on September 19, just one day after the Federal Reserve is widely expected to cut rates by at least a quarter-point. The BoE joined the central bank trend of cutting rates earlier this month when it lowered rates by a quarter-point to 5%. We have entered a new phase of the central bank cycle, with most of the major central banks having already lowered rates.
The Federal Reserve will almost certainly lower rates at the September meeting, but by how much? Just one month ago, the markets had priced in a quarter-point cut at 90%, according to the CME’s FedWatch, but then the US posted some weak numbers and the financial markets sank. This has boosted the likelihood of a half-point cut, which on Friday was around a 50/50 split with a quarter-point cut.
Still, not everybody who has a say is urging a rate cut. Fed Governor Michelle Bowman, a voting member on the FOMC, said on Friday that she is hesitant about cutting rates, since inflation is “uncomfortably above” the 2% target and the labor market remains strong.
GBP/USD Technical
- GBP/USD is testing resistance at 1.2779. Above, there is resistance at 1.2801
- 1.2753 was tested in support earlier. The next support level is 1.2731
US CPI and Retail Sales Data to Test Fed Rate Cut Bets
- Investors panicked after NFP report
- But incoming data eased fears and rate cut bets
- Still, market pricing remains overly dovish
- Focus turns to US CPI on Wednesday and retail sales on Thursday, at 12:30 GMT
Latest data ease recession fears
Following the weaker-than-expected US employment report for July, market participants entered panic mode as recession fears resurfaced. The dollar tumbled, the commodity-linked currencies suffered, the yen extended its rally, and stocks slipped.
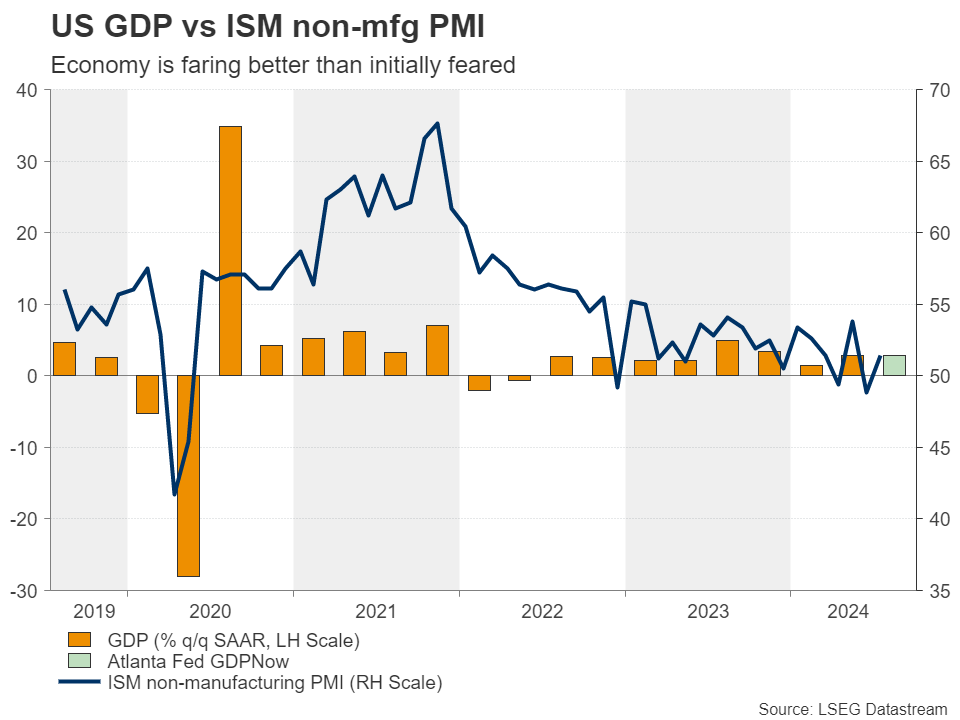
However, incoming data after the jobs numbers suggested that the US economy may not be on the verge of a recession as it was instantly feared. The ISM non-manufacturing PMI returned to expansionary territory, while the Atlanta Fed GDPNow model pointed to a 2.8% q/q SAAR growth rate in Q3. What’s more, initial jobless claims saw their largest drop in nearly a year during the week that ended on August 2.
But Fed rate cut bets remain overly dovish
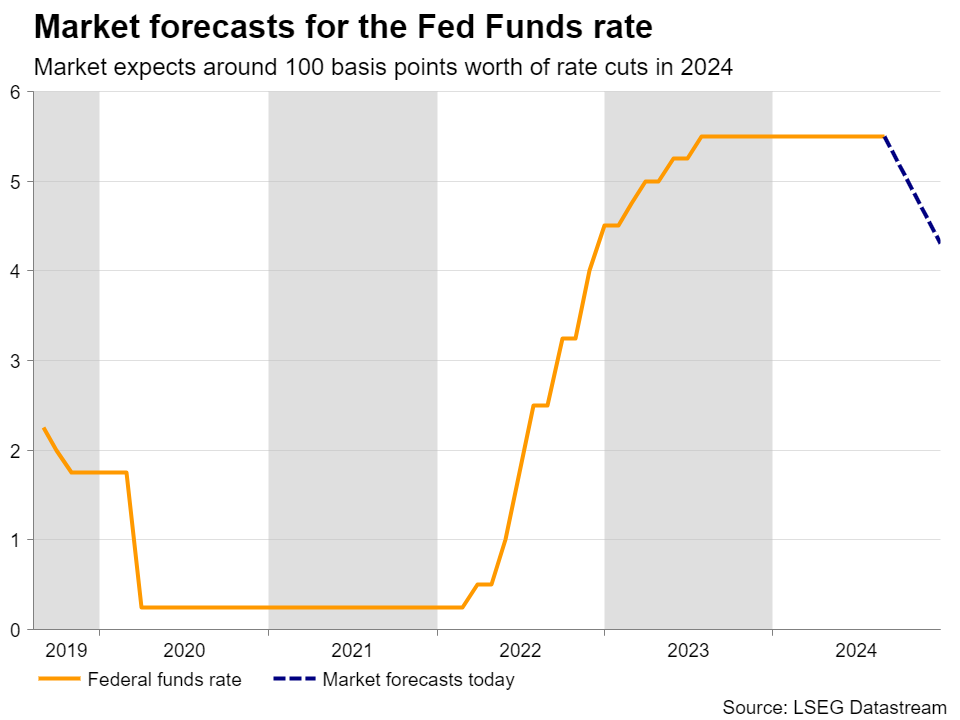
Just after the NFP data were out, market participants started ramping up their rate cut bets, penciling in as many as 125bps worth of reductions by the end of the year. However, as new information was incorporated into their calculations, they decided to scale back their expectations, now expecting around 100bps worth of cuts. Yet, this remains an overly dovish bet as it means a reduction at each of the remaining meetings of the year, including a 50bps cut.
CPI and retail sales data pose upside risks
With all that in mind, investors are now likely to turn their gaze to the US CPI data for July on Wednesday and the retail sales numbers for the same month on Thursday. Expectations are for the headline CPI rate to have held steady at 3.0% y/y and for the core rate to have ticked down to 3.2% y/y from 3.3%. However, the prices subindices of both the ISM manufacturing and non-manufacturing PMIs increased in July, suggesting that the risks surrounding inflation may be tilted to the upside.

Combined with a potential improvement in retail sales on Thursday as the forecast suggests, this could ease recession fears even further and convince market participants that the Fed does not need to cut interest rates so aggressively, as deep cuts may risk allowing inflation to get out of control again.
Fewer basis points worth of rate cuts could translate into higher Treasury yields and a stronger US dollar, but also higher equities as investors become even less worried about the performance of the world’s largest economy, even if this means borrowing costs ending the year higher than expected.
Euro/dollar could slip back into a range
A strong dollar could push euro/dollar back below the key area of 1.0900, a move that could signal the pair’s return within the sideways range that had been containing the price action since the beginning of the year.
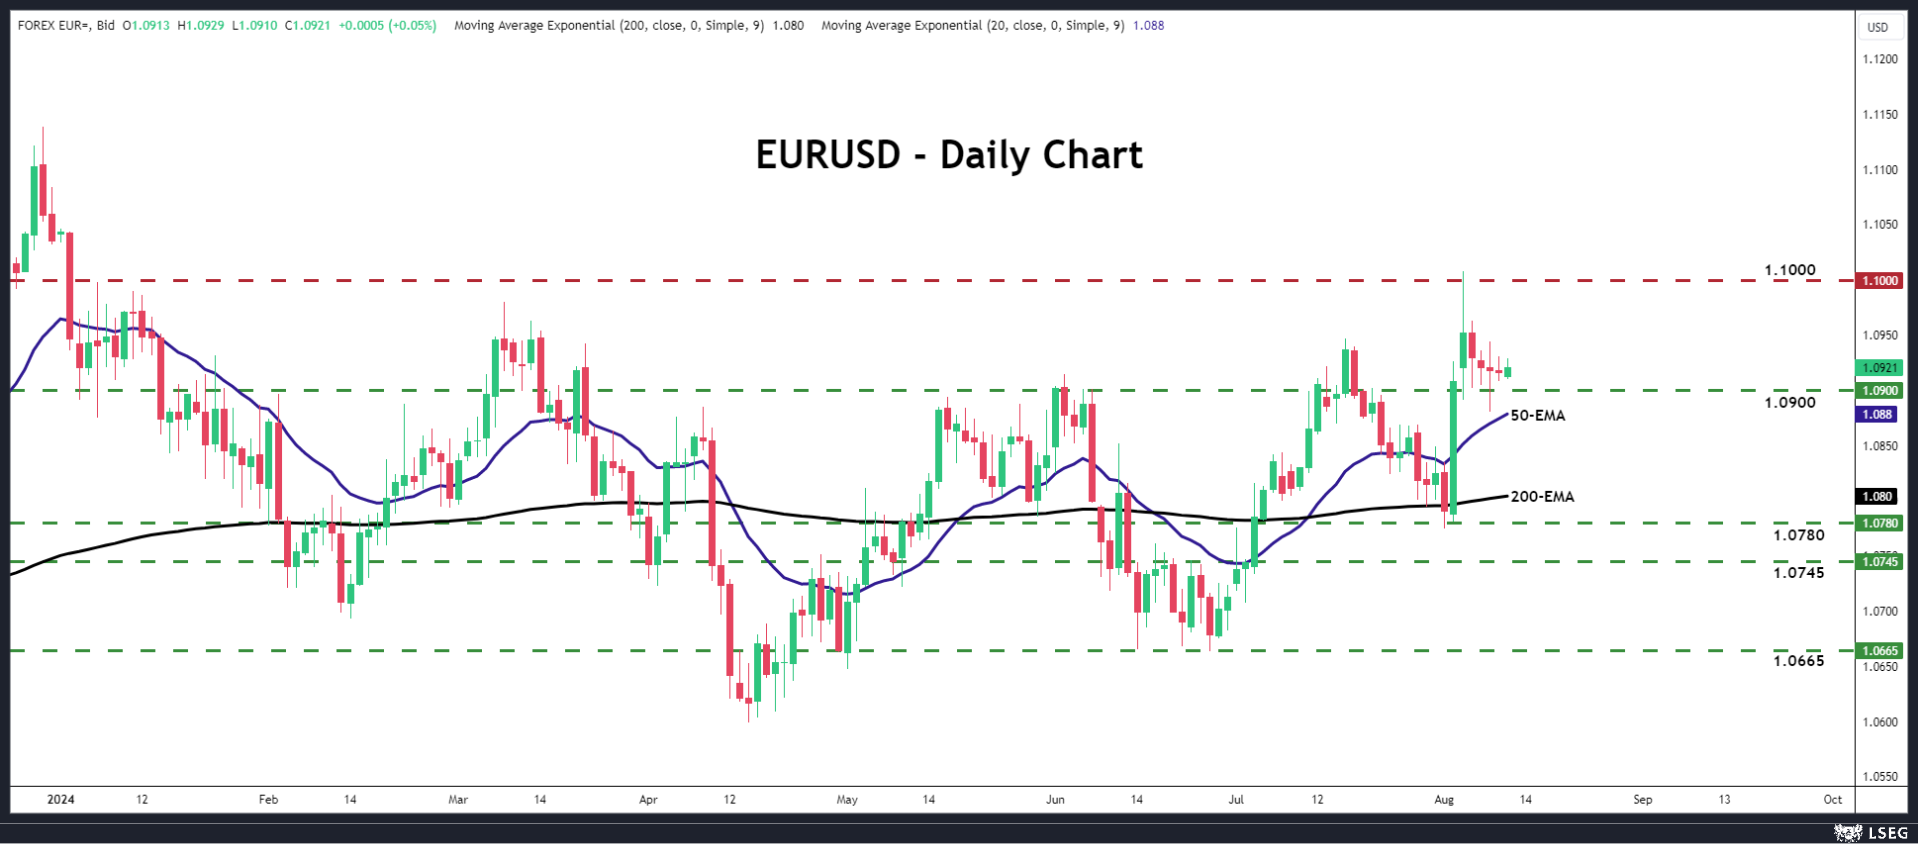
If so, the bears could feel comfortable driving the action towards the low of August 2 at around 1.0780, or towards the 1.0745 zone. If neither zone stops them, the decline may continue until they test the lower boundary of the range, at around 1.0665.
On the upside, the move signaling that the bulls are in charge may be a strong break above the round number of 1.1000.
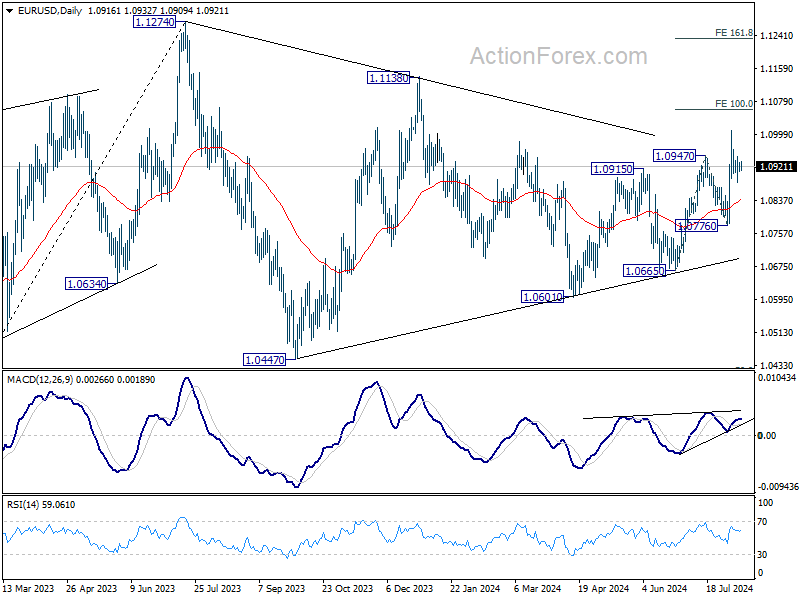
EUR/USD Mid-Day Outlook
Daily Pivots: (S1) 1.0906; (P) 1.0919; (R1) 1.0929; More.....
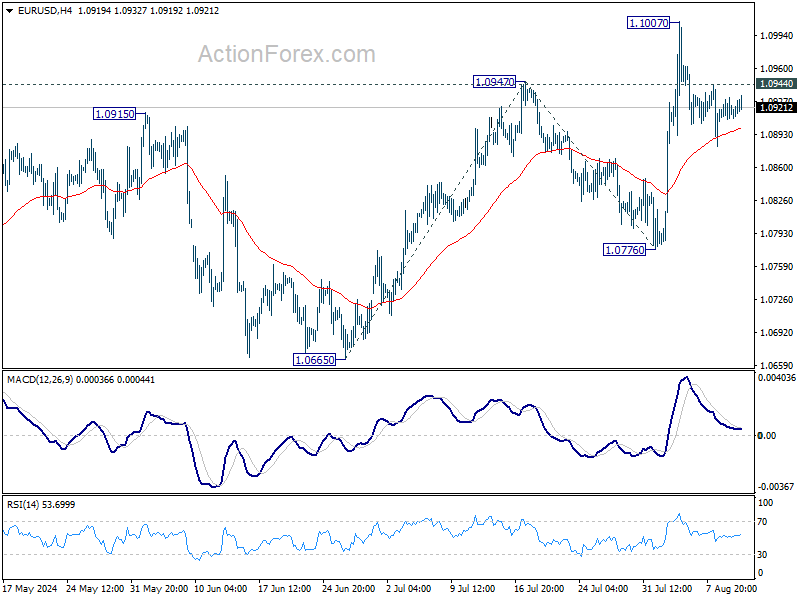
Outlook in EUR/USD is unchanged and intraday bias stays neutral. While deeper retreat cannot be ruled out, downside should be contained well above 1.0776 support. On the upside, above 1.0944 minor resistance will bring retest of 1.1007 first. Further break there will resume rally from 1.0665 to 100% projection of 1.0665 to 1.0947 from 1.0776 at 1.1056 next.
In the bigger picture, price actions from 1.1274 are viewed as a corrective pattern that's still be in progress. Break of 1.1138 resistance will be the first signal that rise from 0.9534 (2022 low) is ready to resume through 1.1274 (2023 high). However, break of 1.0776 support will extend the correction with another falling leg back towards 1.0447 support.
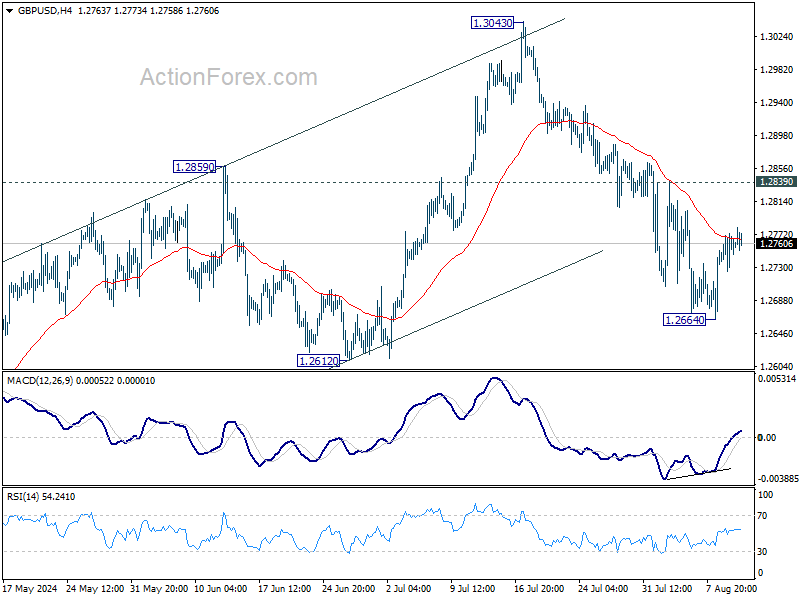
GBP/USD Mid-Day Outlook
Daily Pivots: (S1) 1.2731; (P) 1.2753; (R1) 1.2779; More...
Range trading continues in GBP/USD and intraday bias stays neutral. Another fall is in favor as long as 1.2839 resistance holds. Below 1.2664 will target 1.2612 support. Decisive break there should confirm that rise from 1.2298 has completed, and target this support next. However, break of 1.2839 resistance will argue that the pull back from 1.3043 has completed and turn bias back to the upside.
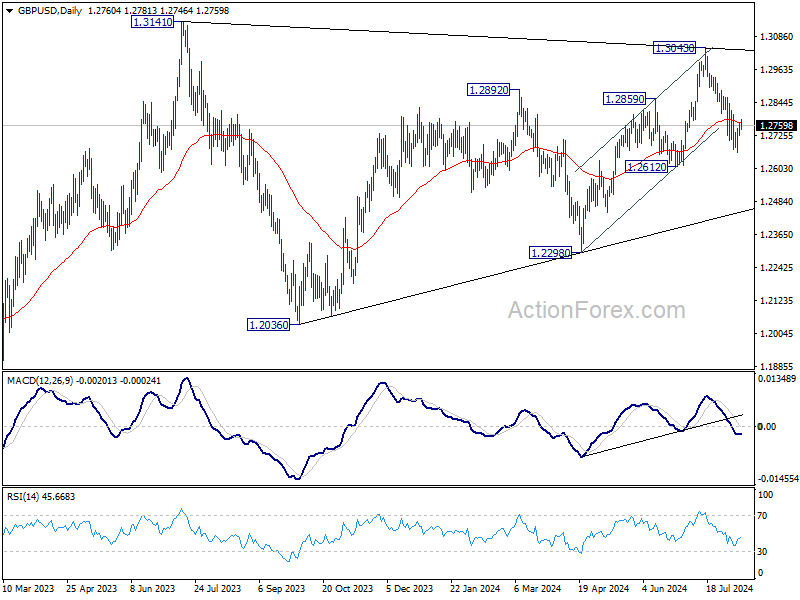
In the bigger picture, current development suggests that corrective pattern from 1.3141 is extending with fall from 1.3043 as another leg. Break of 1.2612 support would strengthen this case. But still, downside should be contained by 1.2036/2298 support zone even in case of deep decline. Rise from 1.0351 (2022 low) remains in favor to resume at a later stage.
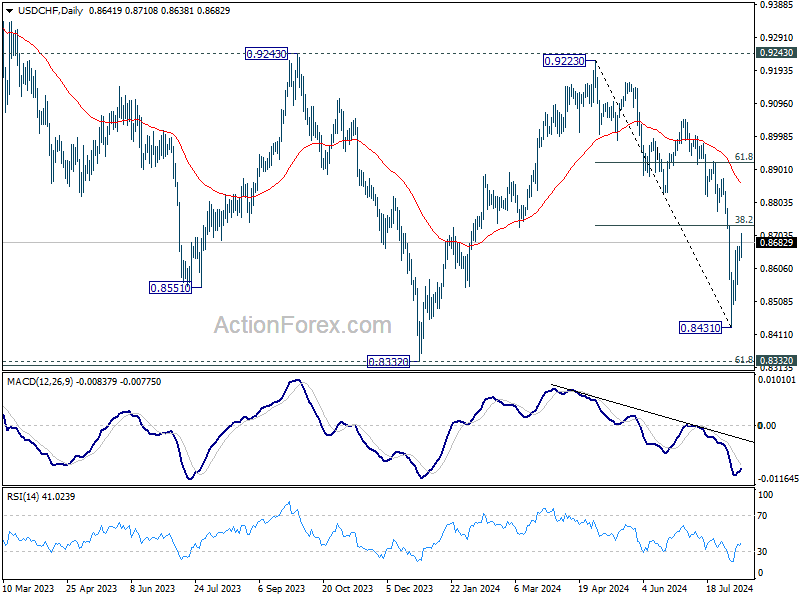
USD/CHF Mid-Day Outlook
Daily Pivots: (S1) 0.8632; (P) 0.8652; (R1) 0.8673; More…
USD/CHF's recovery from 0.8431 extends higher today but stays below 38.2% retracement of 0.9223 to 0.8431 at 0.8734. Intraday bias remains neutral and further decline is still expected. On the downside, below 0.8631 minor support will bring retest of 0.8431 first. Break there will resume the fall from 0.9223 to 0.8332 low. Nevertheless, firm break of 0.8734 will bring stronger rally to 61.8% retracement at 0.8920, even as a corrective move.
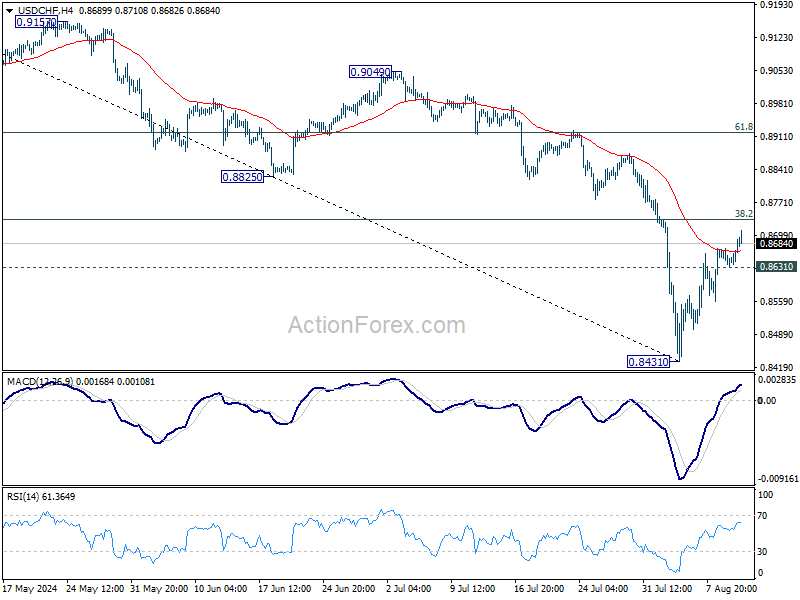
In the bigger picture, price actions from 0.8332 (2023 low) are currently seen as a medium term corrective pattern, with fall from 0.9223 as the second leg. Strong support could be seen from 0.8332 to bring rebound. Yet, overall outlook will continue to stay bearish as long as 0.9243 resistance holds. Firm break of 0.8332, however, will resume larger down trend from 1.0146 (2022 high).