Sample Category Title
US initial jobless claims fall to 233k, below exp 245k
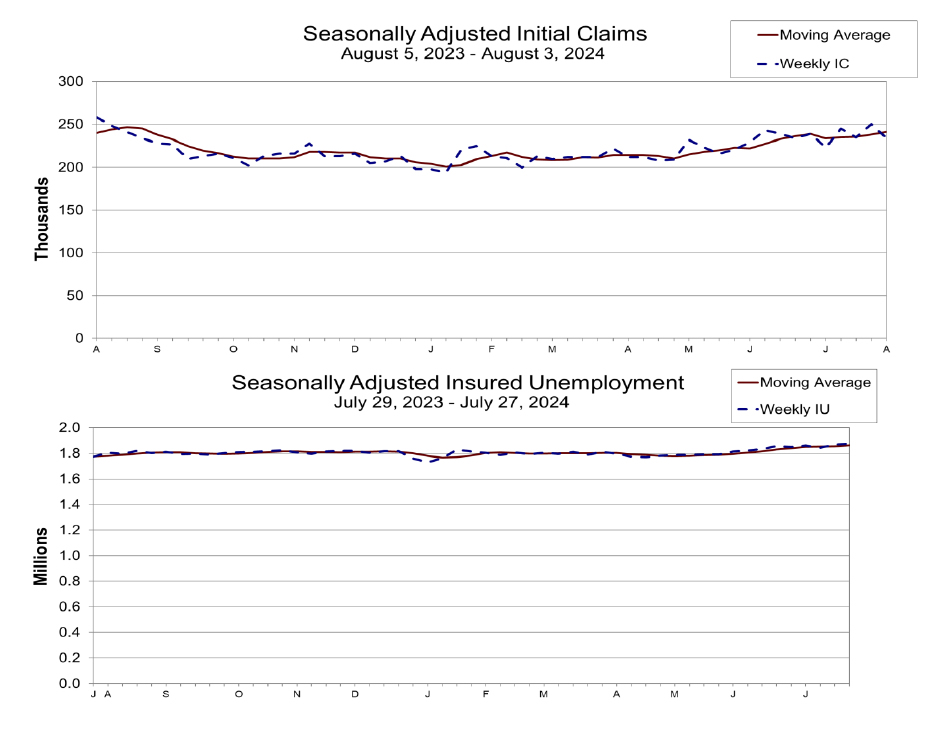
US initial jobless claims fell -17k to 233k in the week ending August 3, lower than expectation of 245k. Four-week moving average of initial claims rose 2.5k to 241k.
Continuing claims rose 6k to 1875k in the week ending July 27, highest since November 21, 2021. Four-week moving average of continuing claims rose 7k to 1869k, highest since November 27, 2021 too.
Japanese Yen (JPY) Price Action: Following Dovish BoJ Comments, What Does Price Action Tell Us?
- The Bank of Japan (BoJ) released their summary of opinions, accompanied by bearish comments from BoJ policymakers.
- Geopolitical concerns could bolster the Yen, but the safe haven appeal might be divided among the US Dollar, Yen, and Swiss Franc.
The Bank of Japan (BoJ) has released their summary of opinions, accompanied by some bearish comments from BoJ policymakers. BoJ Deputy Governor Shinichi Uchida softened some of Governor Ueda’s more aggressive remarks, aiding in market stabilization.
The BoJ noted that the probability of reaching the inflation target has risen, but the Central Bank also anticipates some upward pressure. The BoJ projects that inflation will hit the target by the second half of 2025. This scenario presents an intriguing question for market participants and could position the Yen strongly next year.
While central banks worldwide are cutting rates, the BoJ plans to tighten and raise rates. This could propel the Yen to the forefront of gains in 2025. Although there is a considerable journey ahead, it is something to keep in mind.
In the short term, Yen pairs remain interesting yet face downside pressure. Geopolitical concerns could bolster the Yen. However, the safe haven appeal might be divided among the US Dollar, Yen, and Swiss Franc, potentially negating Yen gains against the Dollar but benefiting it against the Euro and GBP.
Technical Analysis
USD/JPY
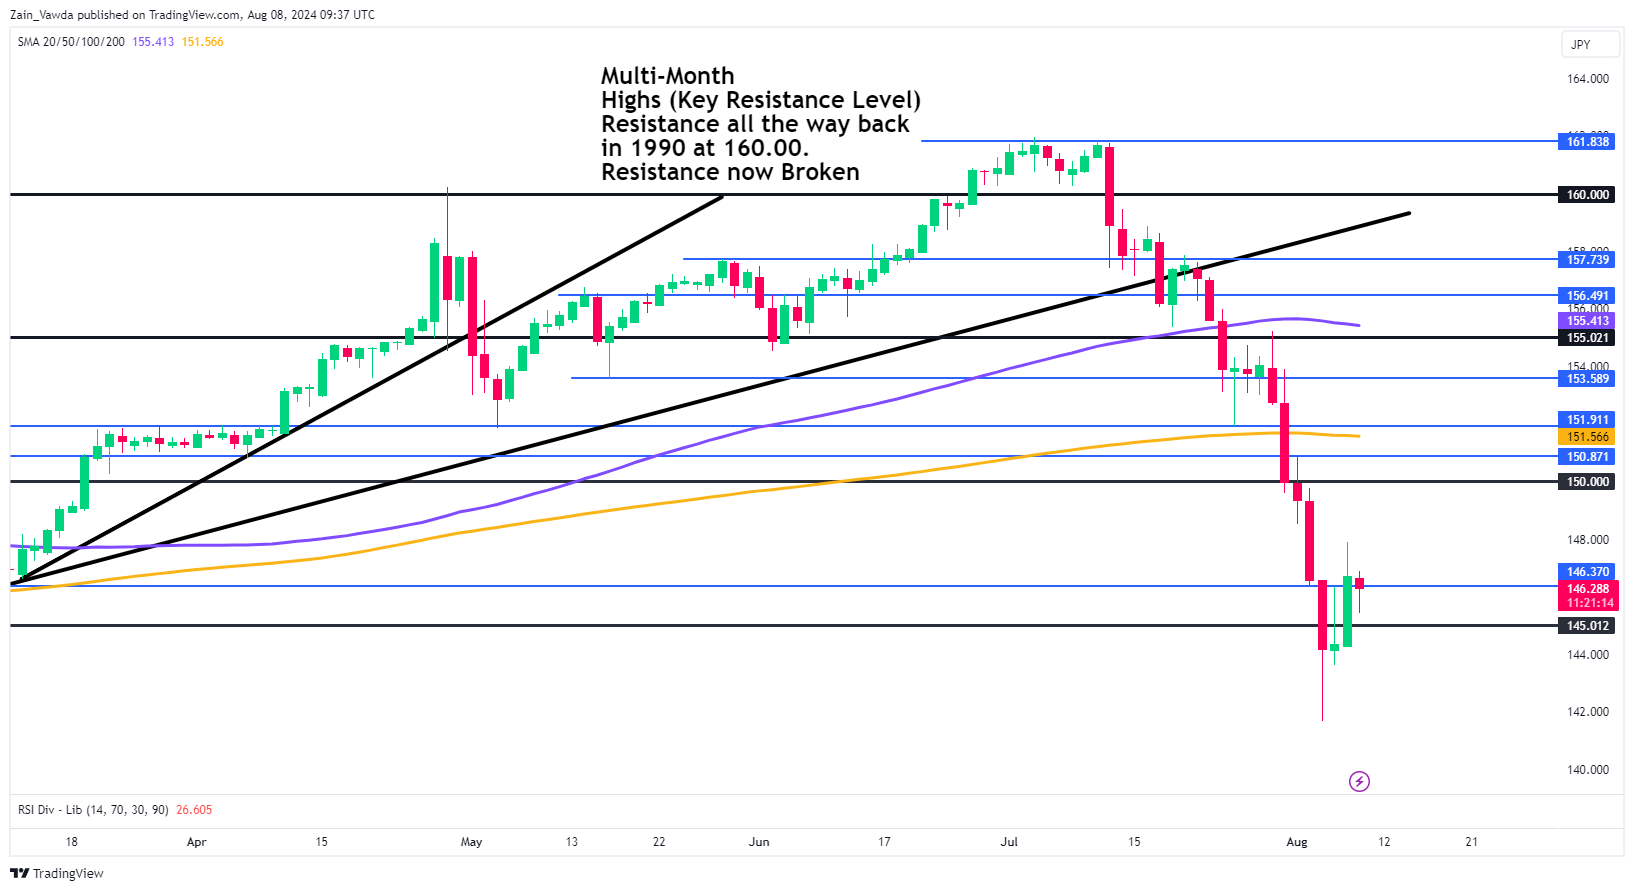
From a technical perspective, USD/JPY has rebounded strongly and formed an imperfect morning star candlestick pattern. Typically, such a pattern signals a bullish move, but various factors need to be considered.
From a price action viewpoint, the H4 chart has shown higher highs and higher lows since bottoming out at 141.67 on Monday, suggesting a potential return to the 150.00 level in the coming days.
What could invalidate the bullish move? An H4 candle closing below the recent lower swing high around 144.25 would invalidate the bullish outlook. This would break the current structure and could drive the Yen to retest the psychological 140.00 level.
A move higher from here faces immediate resistance at 148.00 before the 150.00 psychological level comes into focus.
USD/JPY Daily Chart, August 8, 2024
Source: TradingView (click to enlarge)
Support
- 145.00
- 144.00
- 141.65
Resistance
- 148.00
- 150.00 (psychological level)
- 150.87
GBP/JPY
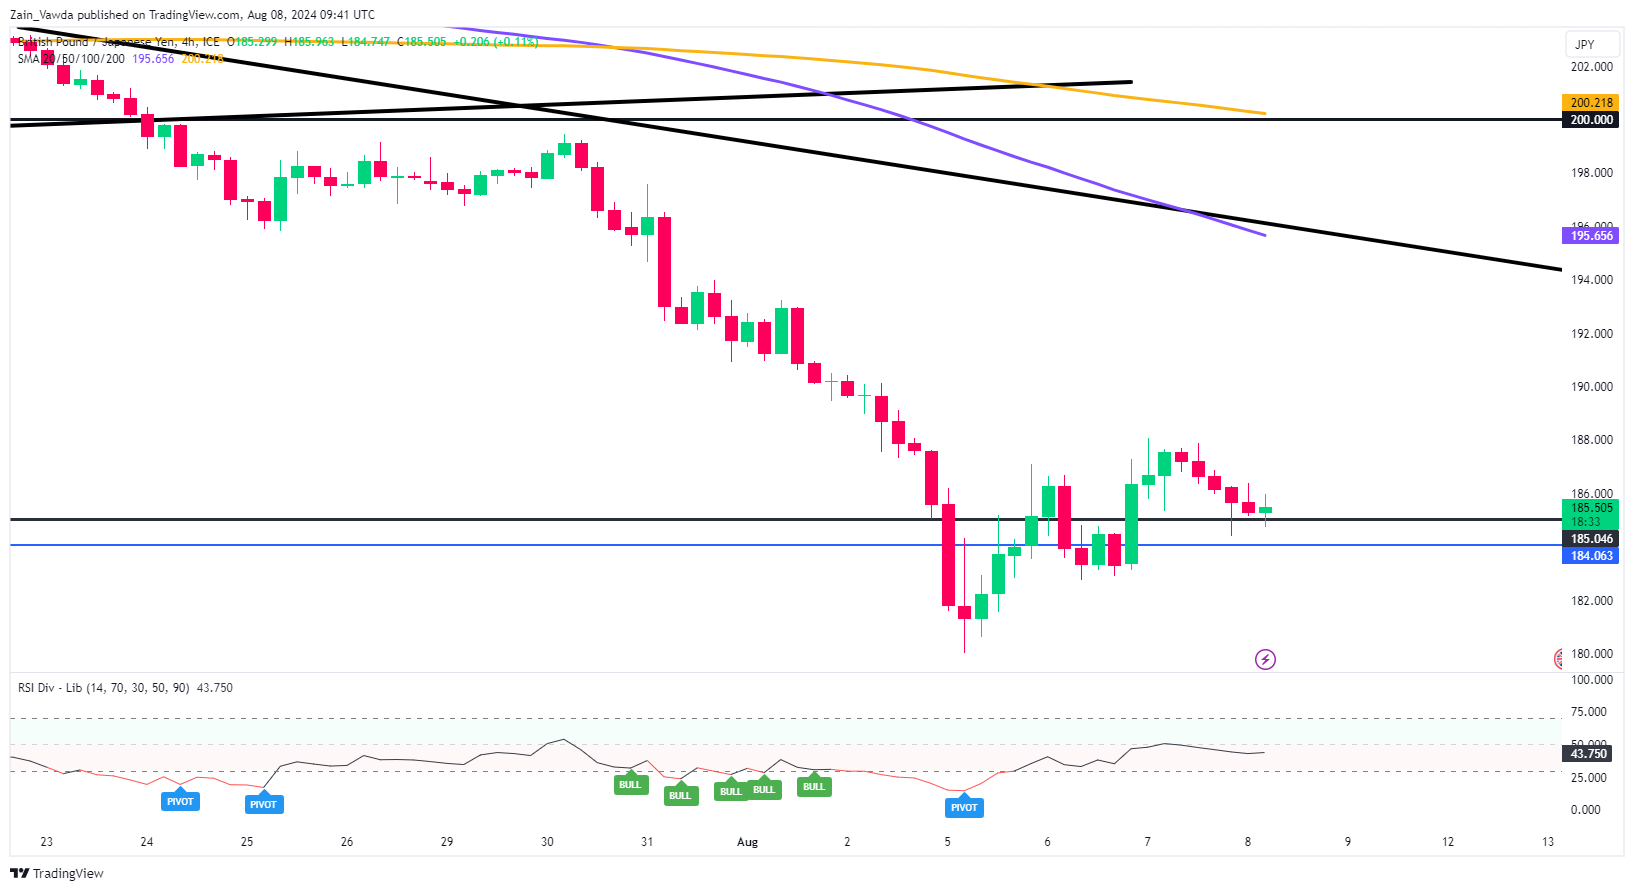
GBP/JPY is mirroring the USD/JPY chart, currently trading just above the important support level at 185.00. The H4 chart shows a similar pattern to USD/JPY, with higher highs and higher lows since Monday’s dip just below the 180.00 mark.
Bulls are in control for the moment, but a break and H4 candle close below 183.30 would invalidate the bullish structure. This could lead to a retest of recent lows and possibly a move towards the 175.00 level.
On the upside, resistance is found at 187.65, followed by the 190.00 mark. Beyond 190.00, there’s a resistance zone around 192.00 before the descending trendline becomes relevant.
GBP/JPY Four-Hour (H4) Chart, August 8, 2024
Source: TradingView (click to enlarge)
Support
- 185.00
- 183.30
- 180.00
Resistance
- 187.65
- 190.00
- 192.00
EUR/JPY
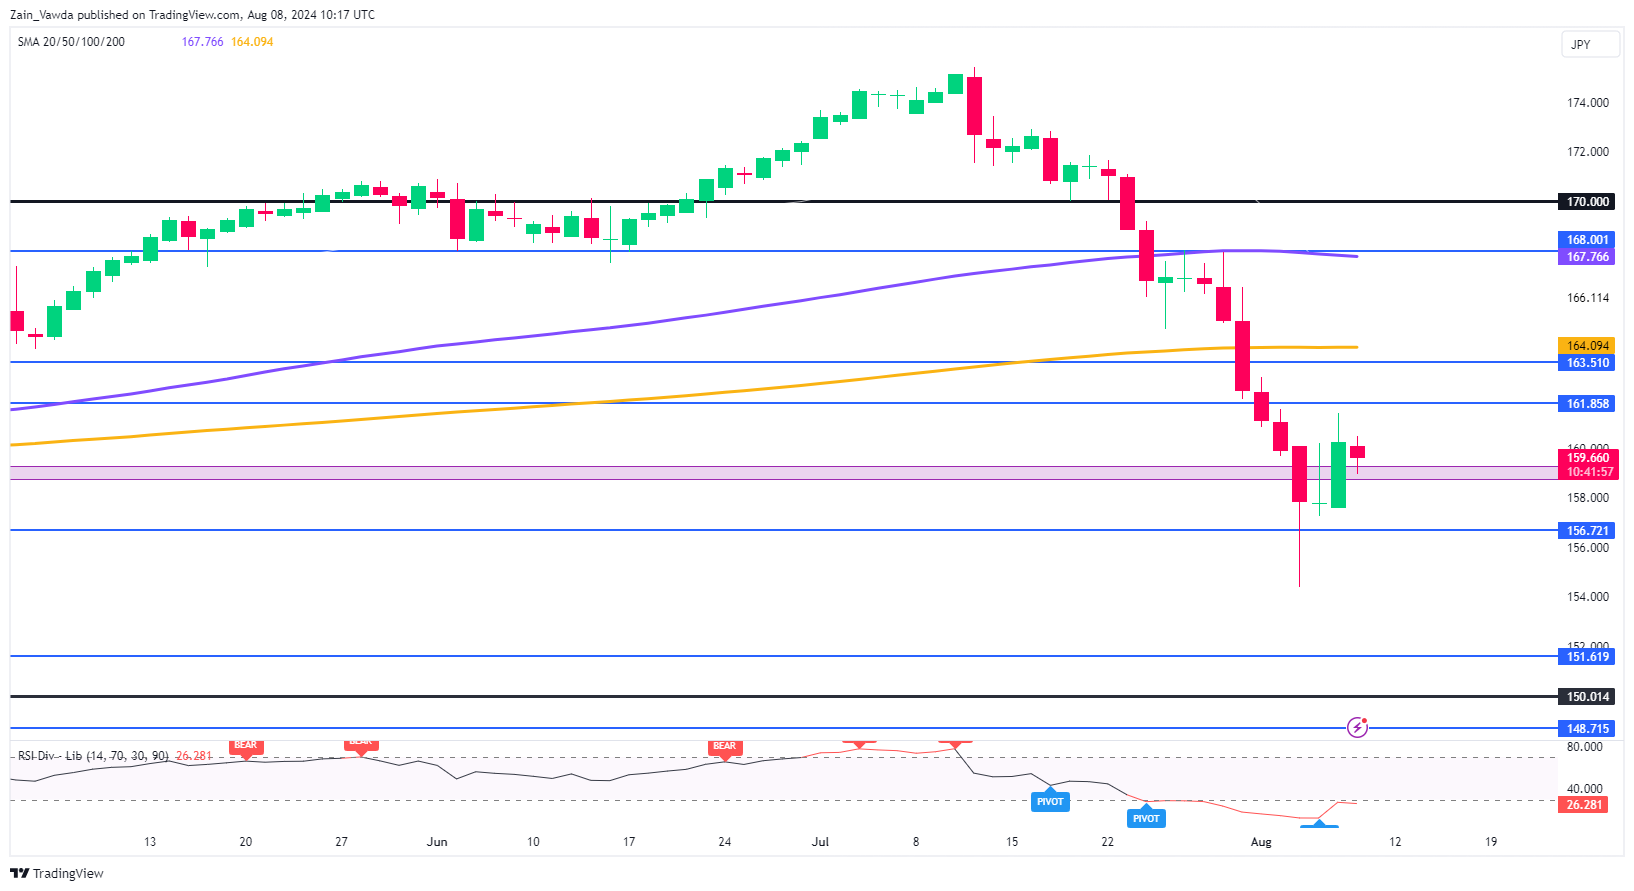
Once again, the chart nearly mirrors USD/JPY and GBP/JPY, with the daily chart displaying an imperfect morning star candlestick pattern. This morning, EUR/JPY retested the support area around the 159.00 level before bouncing back to trade at 159.66 at the time of writing.
On the H4 timeframe, a candle close below the recent lower swing high at 157.50 would invalidate the current bullish trend, potentially leading to a retest of the recent lows around the 154.40 level. There is some support at 156.72 that would need to be breached for a retest of the recent lows to occur.
On the upside, immediate resistance lies at 160.00, followed by the 161.86 level. Beyond this, the 163.51 zone could be crucial, as it also aligns with the 200-day moving average just above.
EUR/JPY Daily Chart, August 8, 2024
Source: TradingView (click to enlarge)
Support
- 159.00
- 156.72
- 154.40
Resistance
- 160.00
- 161.85
- 163.50
Dollar Index: Limited Recovery Likely to Precede Fresh Weakness as Rate Outlook Weighs
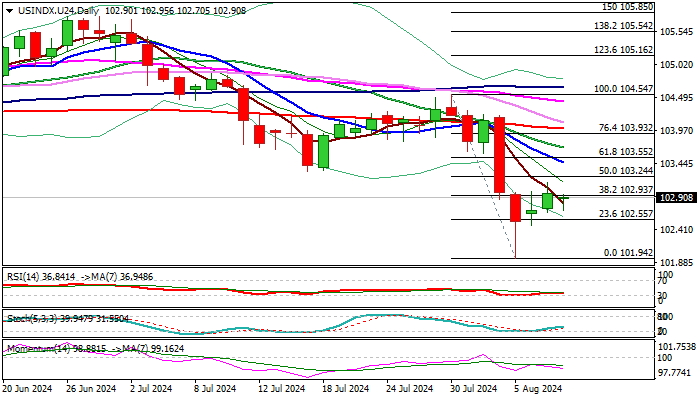
The dollar index ticked lower in European trading on Thursday, after bounce from 8-month low (101.94, posted on Monday) started to lose traction.
Weak picture on daily chart (MA’s in bearish configuration / strong negative momentum) warn of limited recovery before bears regain control.
The dollar was hit by the recent strong rally of yen, which was the one of key factors of the latest drop, with outlook for the Fed action on interest rates, turning more dovish and expected to add pressure on the US currency.
The latest economic data signaled that the US economy is slowing and recession threats, narrowed space for the central bank’s action and resulted in sharp rise in bets for 50 basis cut in September (against initial expectations for 25 basis points rate cut) and even spreading rumors that the Fed would opt for emergency rate cut before the September meeting.
Partial stabilization of the situation in the markets eased tensions for now, but outlook remains darkened by all these factors.
Markets await release of US July inflation report (due next week) and the speech of Fed Chair Powell at the Jackson Hole symposium (due Aug 22/24) for more information.
Immediate support lays at 102.55, loss of which would further weaken near term structure, while lift above upper pivot at 13.24 would sideline downside risk.
Res: 103.24; 103.55; 103.64; 103.93.
Sup: 102.70; 102.55; 101.94; 101.75.
Gold (XAU/USD) Recovers Amid Rate Cut Expectations
Gold (XAU/USD) prices have rebounded to 2394 USD per troy ounce, paring previous losses as the likelihood of a US Federal Reserve rate cut increases. Market sentiment is increasingly cautious amid recession fears, influencing stock market dynamics and bolstering the appeal of non-yielding assets like gold.
Current market indicators, notably the CME FedWatch tool, suggest an almost certain probability of a rate reduction by the Federal Reserve in September. Such monetary easing typically enhances the allure of gold, which does not offer interest income.
Investor focus is now on upcoming US unemployment claims data, which will provide further insight into employment market conditions. Recent statistics from China revealed that the People’s Bank of China did not purchase gold bullion in July, marking the third consecutive month without an increase in gold reserves. This suggests a shift towards domestic economic stimulation as the Chinese economy faces challenges.
Ongoing tensions in the Middle East also underscore gold’s status as a safe-haven asset.
Technical analysis of XAU/USD
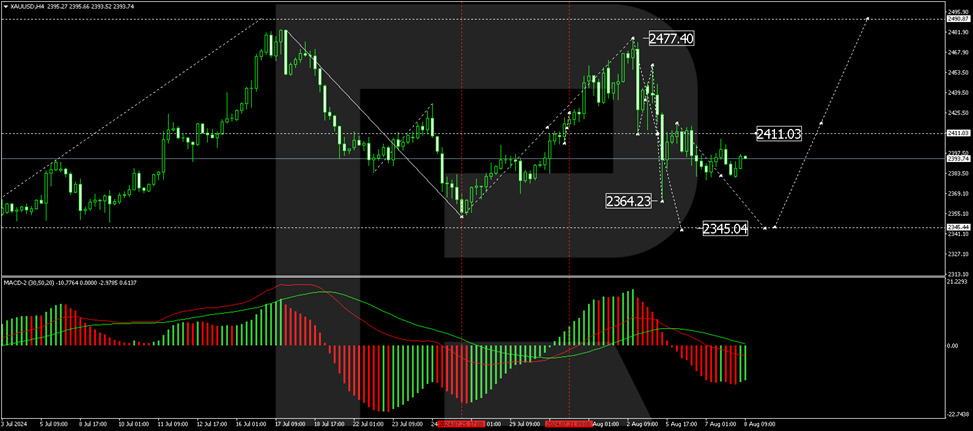
The H4 chart shows a declining trend towards the 2345.00 level, with a local target recently reached at 2364.23, followed by a correction to 2411.00. The market is anticipated to continue this downward trajectory towards 2355.80 before potentially rebounding to 2381.60. A further decline to 2345.00 is likely, aligning with the primary downtrend target. This bearish outlook is supported by the MACD indicator, which shows the signal line trending downwards from above zero.
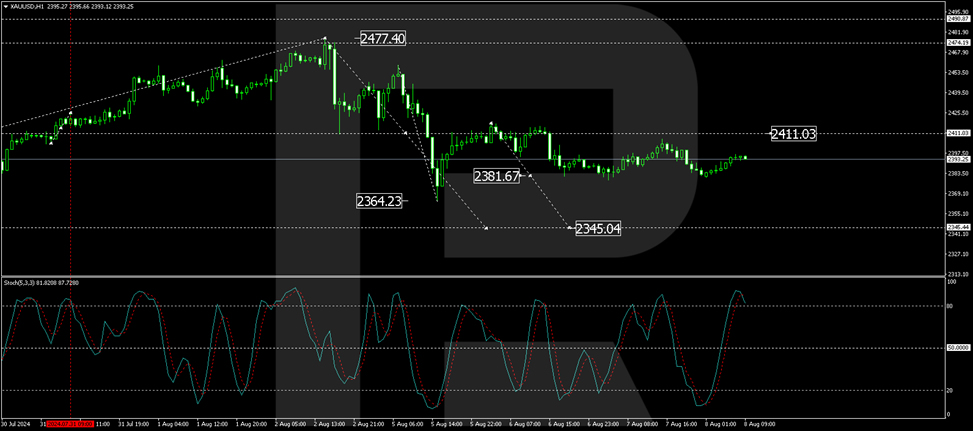
On the H1 chart, gold is currently consolidating above 2381.60. A downward breakout towards 2355.80 is expected, which would serve as a local target. Subsequent retesting of 2381.60 from below may occur before the downward movement continues to 2345.00. This bearish scenario is corroborated by the Stochastic oscillator, with the signal line poised to drop from above 80, suggesting a potential decline.
As investors and traders navigate these dynamics, gold’s status as a hedge against uncertainty remains a key theme in its valuation.
EUR/USD Outlook: Looks for Clearer Direction Signal
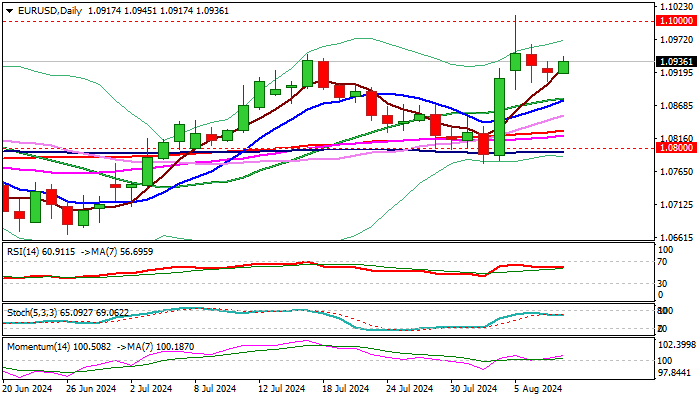
EUR/USD edged higher in Asia / early Europe on Thursday, hinting that pullback from Monday’s spike high (1.1009) might be over.
Signals of formation of a higher base at 1.0900 zone add to positive near-term outlook, as technical studies on daily chart are predominantly bullish, though sustained break above 1.0950/60 zone needed to confirm.
On the other hand, hourly studies are weakening, and recovery attempts may face headwinds on approach to 1.0950 pivot (hourly cloud top / 50% retracement of 1.1009/1.0892 pullback).
This would keep the downside vulnerable, especially on loss of 1.0925 pivot (hourly cloud base / hourly Kijun-sen), which would risk retest of 1.0900 and open way for deeper pullback on break.
Look for clearer direction signal.
Res: 1.0950; 1.0965; 1.0981; 1.1000.
Sup: 1.0925; 1.0890; 1.0875; 1.0850.
EUR/USD Daily Outlook
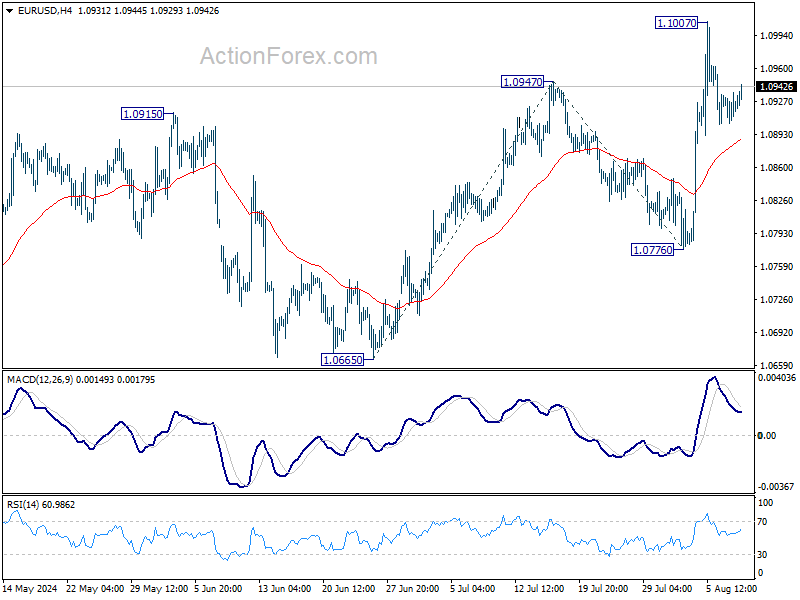
Daily Pivots: (S1) 1.0907; (P) 1.0922; (R1) 1.0938; More.....
EUR/USD is extending the consolidation from 1.1007 and intraday bias remains neutral. While deeper retreat cannot be ruled out, downside should be contained well above 1.0776 support. On the upside, break of 1.1007 will resume recent rally from 1.0665 to 100% projection of 1.0665 to 1.0947 from 1.0776 at 1.1056 next.
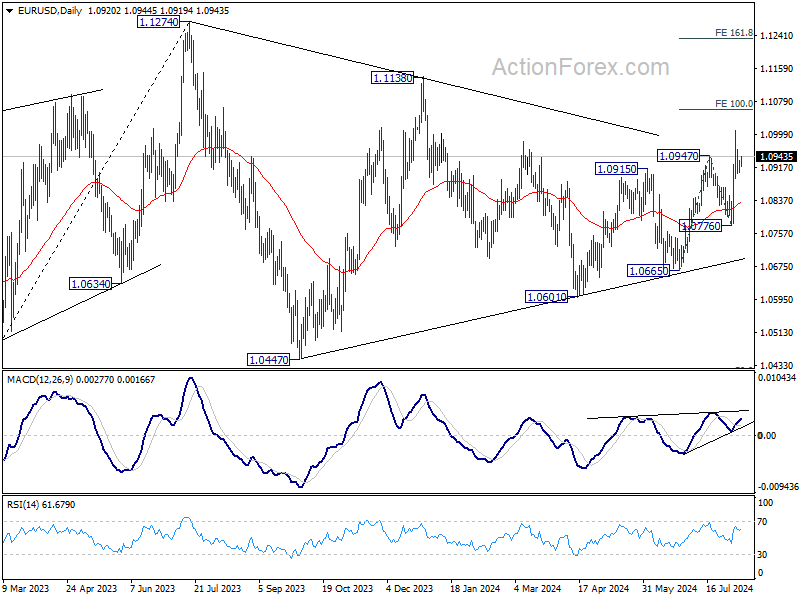
In the bigger picture, price actions from 1.1274 are viewed as a corrective pattern that's still be in progress. Break of 1.1138 resistance will be the first signal that rise from 0.9534 (2022 low) is ready to resume through 1.1274 (2023 high). However, break of 1.0776 support will extend the correction with another falling leg back towards 1.0447 support.
GBP/USD Daily Outlook
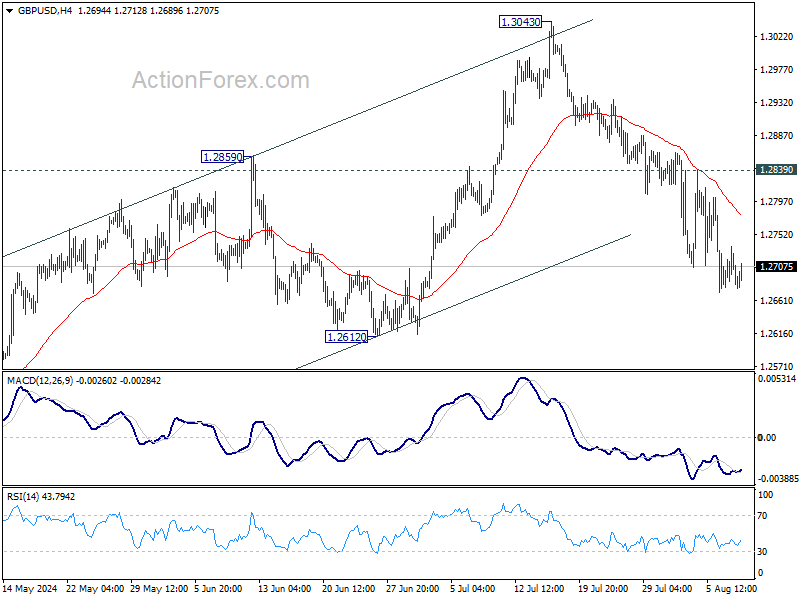
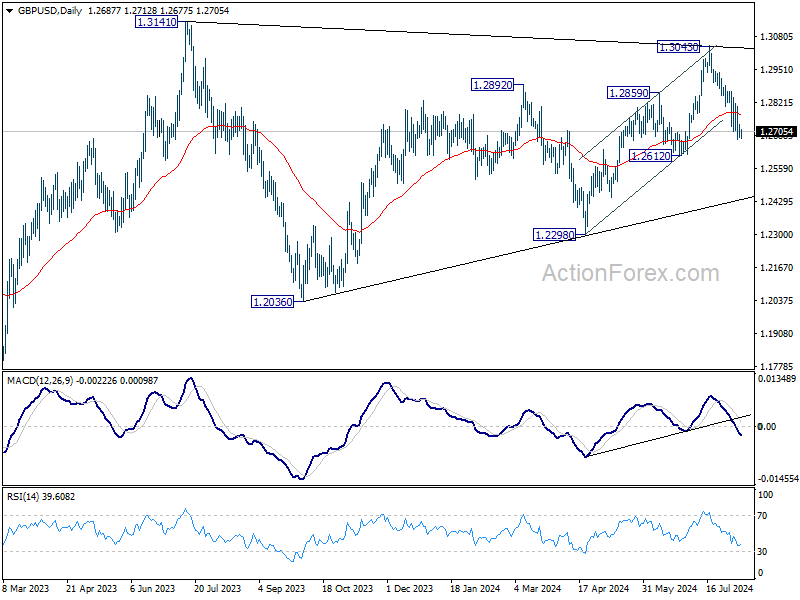
Daily Pivots: (S1) 1.2669; (P) 1.2703; (R1) 1.2726; More...
Intraday bias in GBP/USD stays on the downside despite some loss of momentum. Fall from 1.3043 should continue to 1.2612 support. Decisive break there should confirm that rise from 1.2298 has completed, and target this support next. However, break of 1.2839 resistance will argue that the pull back from 1.3043 has completed and turn bias back to the upside.
In the bigger picture, current development suggests that corrective pattern from 1.3141 is extending with fall from 1.3043 as another leg. Break of 1.2612 support would strengthen this case. But still, downside should be contained by 1.2036/2298 support zone even in case of deep decline. Rise from 1.0351 (2022 low) remains in favor to resume at a later stage.
USD/CHF Daily Outlook
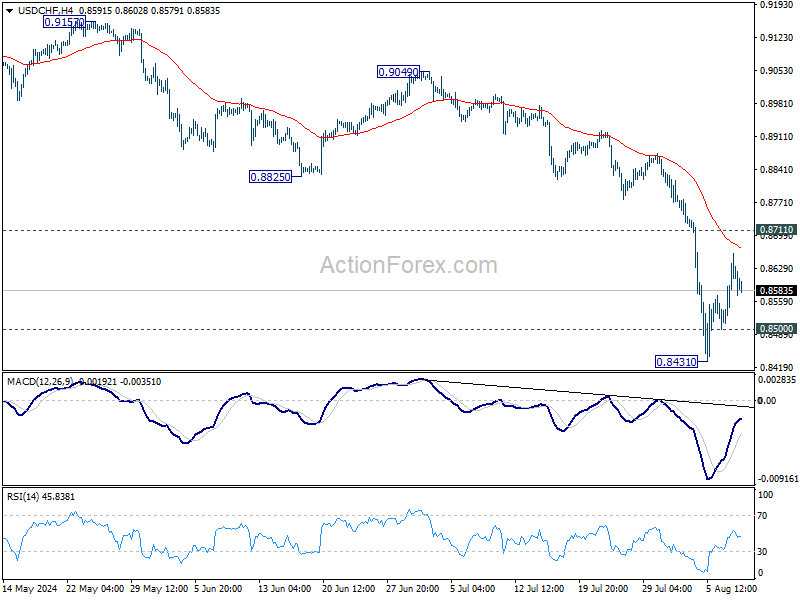
Daily Pivots: (S1) 0.8530; (P) 0.8596; (R1) 0.8683; More…
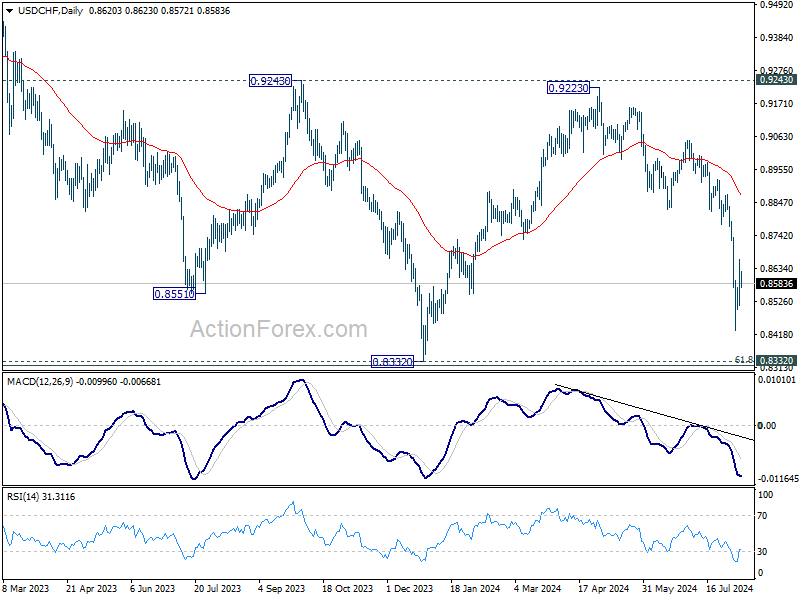
Intraday bias in USD/CHF remains neutral and further decline is expected with 0.8711 resistance intact. On the downside, below 0.8500 will bring retest of 0.8431 first. Break there will resume the decline from 0.9223 to retest 0.8332 low.
In the bigger picture, price actions from 0.8332 (2023 low) are currently seen as a medium term corrective pattern, with fall from 0.9223 as the second leg. Strong support could be seen from 0.8332 to bring rebound. Yet, overall outlook will continue to stay bearish as long as 0.9243 resistance holds. Firm break of 0.8332, however, will resume larger down trend from 1.0146 (2022 high).
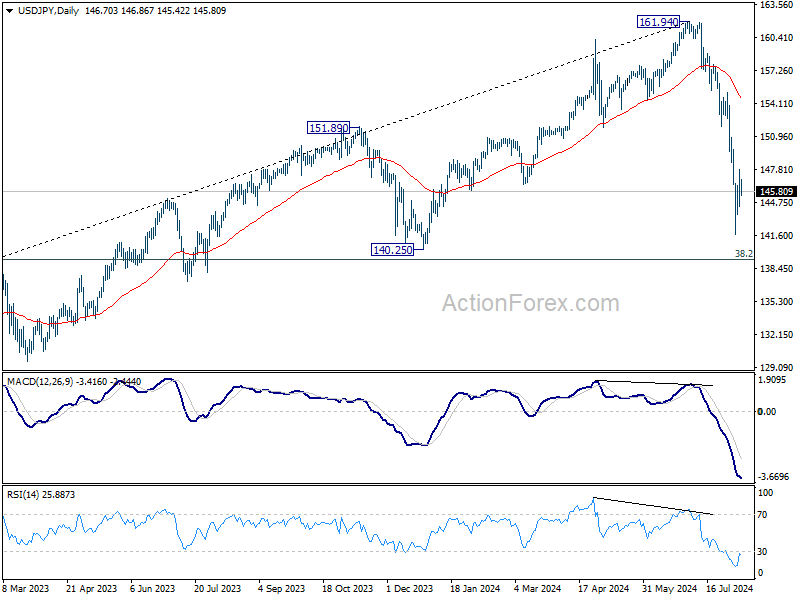
USD/JPY Daily Outlook
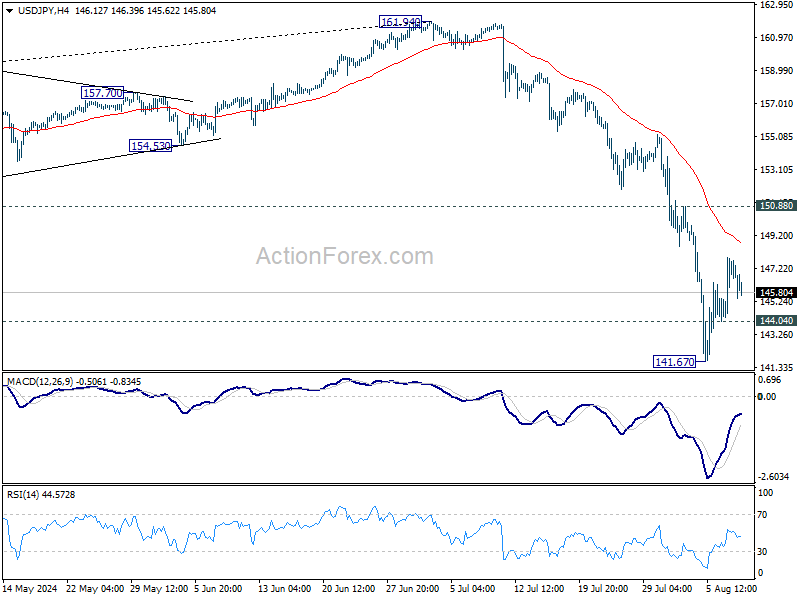
Daily Pivots: (S1) 144.69; (P) 146.30; (R1) 148.31; More...
Intraday bias in USD/JPY remains neutral an further decline is expected with 150.88 resistance intact. On the downside, below 144.04 minor support will bring retest of 141.67 first. Break there will resume the fall from 161.94 to 140.25 support next.
In the bigger picture, the strong break of 55 W EMA (now at 149.98) argue that fall from 161.94 medium term is correcting whole up trend from 102.58 (2021 low). Deeper decline could be seen to 38.2% retracement of 102.58 to 161.94 at 139.26, which is close to 140.25 support. In any case, risk will stay on the downside as long as 55 W EMA (now at 149.83) holds. Nevertheless, firm break of 55 W EMA will suggest that the range for medium term corrective pattern is already set.
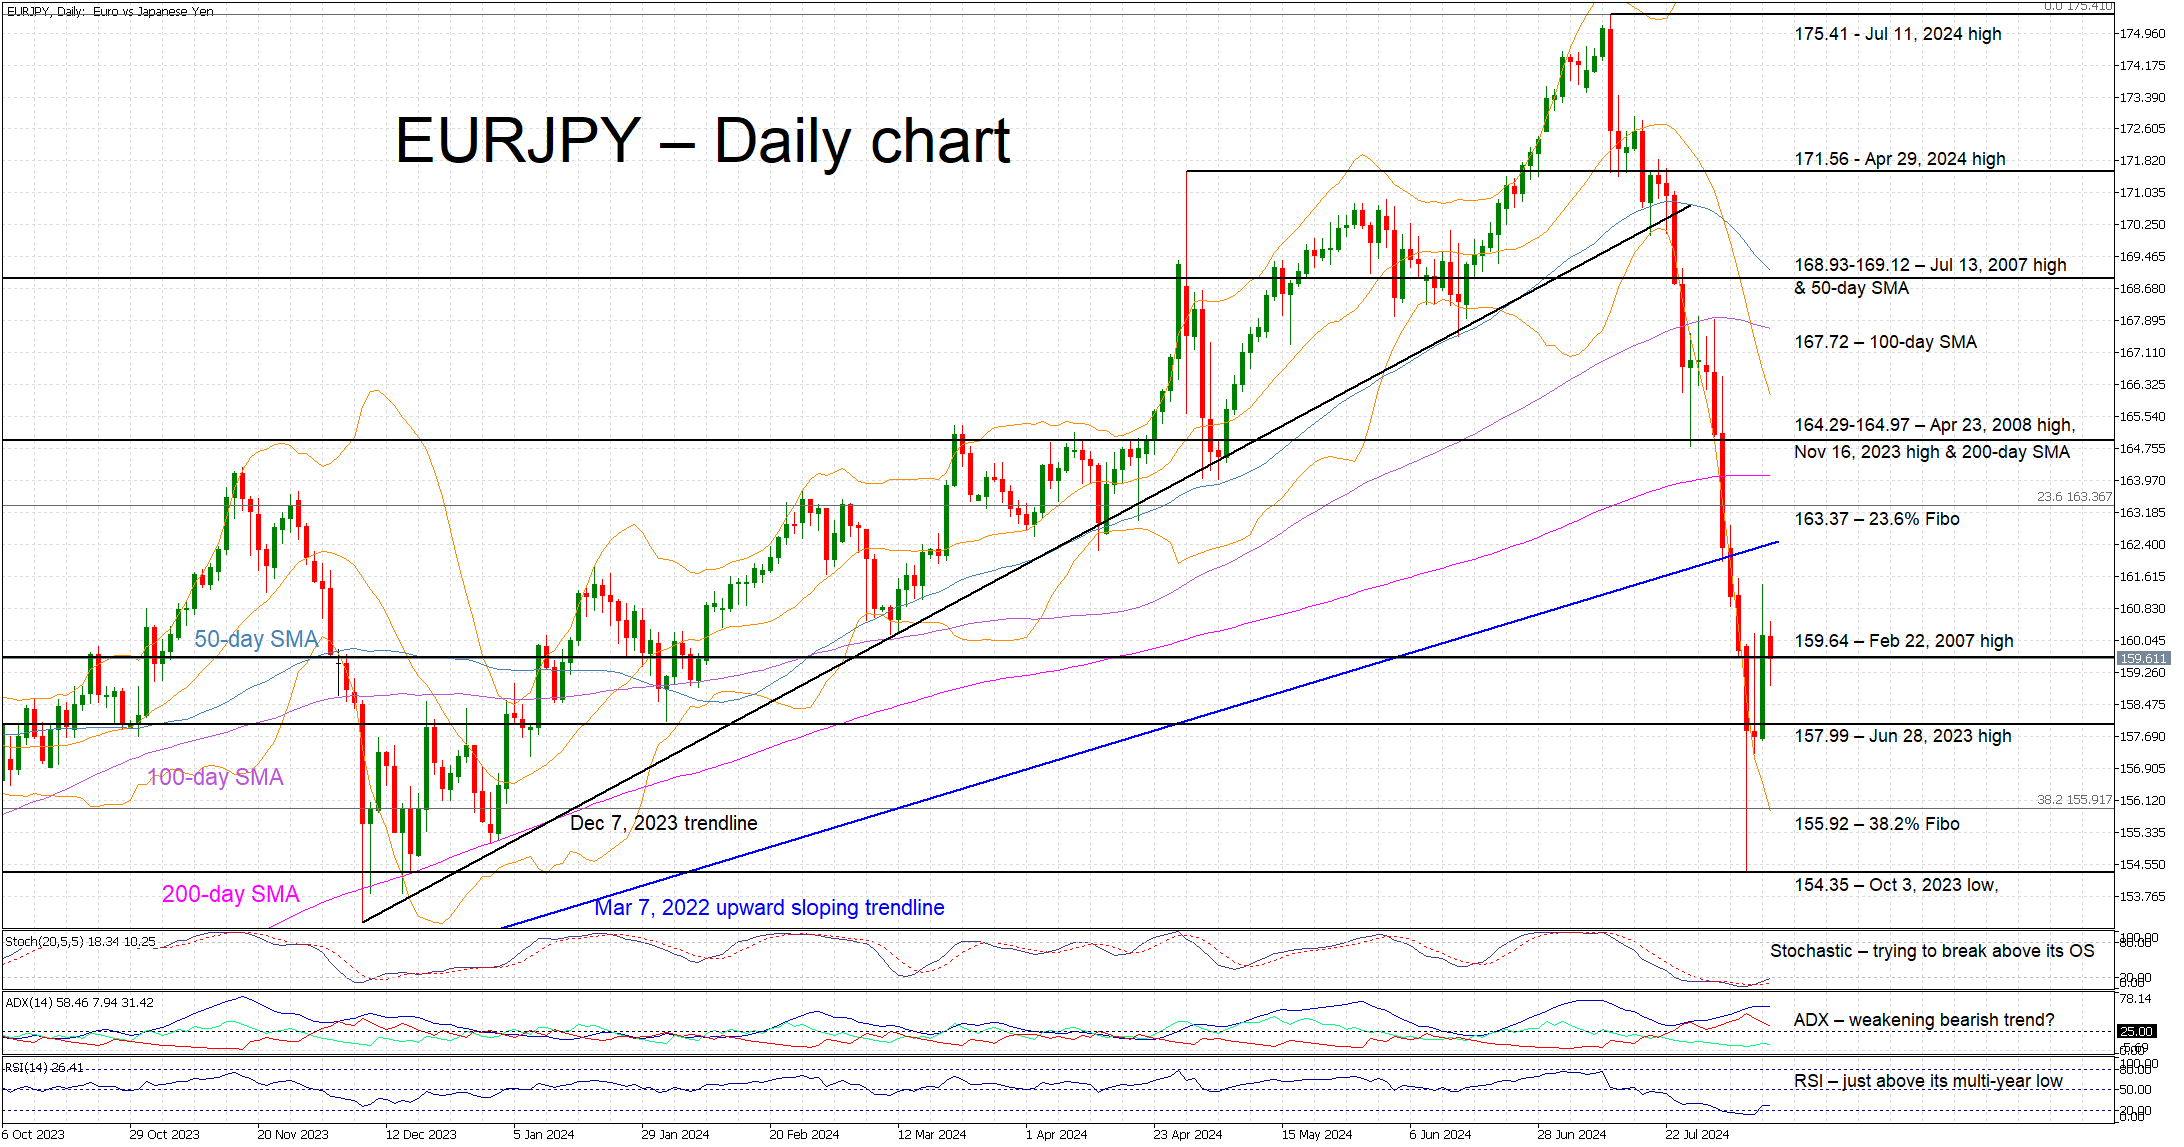
Does Recent EURJPY Correction Have Legs?
- EURJPY is hovering around the 159.64 level
- It is trading around 9% lower from its recent high
- Momentum indicators are mixed, all eyes on stochastics
EURJPY is trading lower today, close to the 159.64 level and considerably above the August 5 low of 154.38. The market is clearly trying to find its footing following the recent rout that was triggered by the bigger-than-expected rate hike by the BoJ and fears about an imminent US recession. JPY was the primary beneficiary of this acute market reaction with EURJPY dropping around 9% from the all-time high of 175.41.
In the meantime, momentum indicators are mostly mixed. More specifically, the RSI is edging higher, but remains very close to its multi-year low. Similarly, the Average Directional Movement Index (ADX) is moving sideways, potentially signaling a weakening bearish trend in EURJPY. More importantly, the stochastic oscillator has surpassed its moving average, and it is preparing to cross above its oversold territory (OS). Should this move take place, it could be seen as a strong bullish signal.
Should the bulls remain confident, they would try to keep EURJPY above the February 22, 2007 high at 159.64 and then gradually stage a rally towards the 23.6% Fibonacci retracement level of March 7, 2022 – July 11, 2024 downtrend at 163.37. The next key resistance area could then come at the busy 164.29-164.97 region.
On the other hand, should the bears remain hungry, they would try to break below 159.64 and then push EURJPY towards the June 28, 2023 high at 157.99. If successful, they could then test the support set by the 38.2% Fibonacci retracement level at 155.92, a tad above the 2024 low of 154.38.
To sum up, the bulls are trying to recover part of their strong losses but EURJPY’s correction might still have legs.