Sample Category Title
Australian Dollar Falls to 3-Week Low
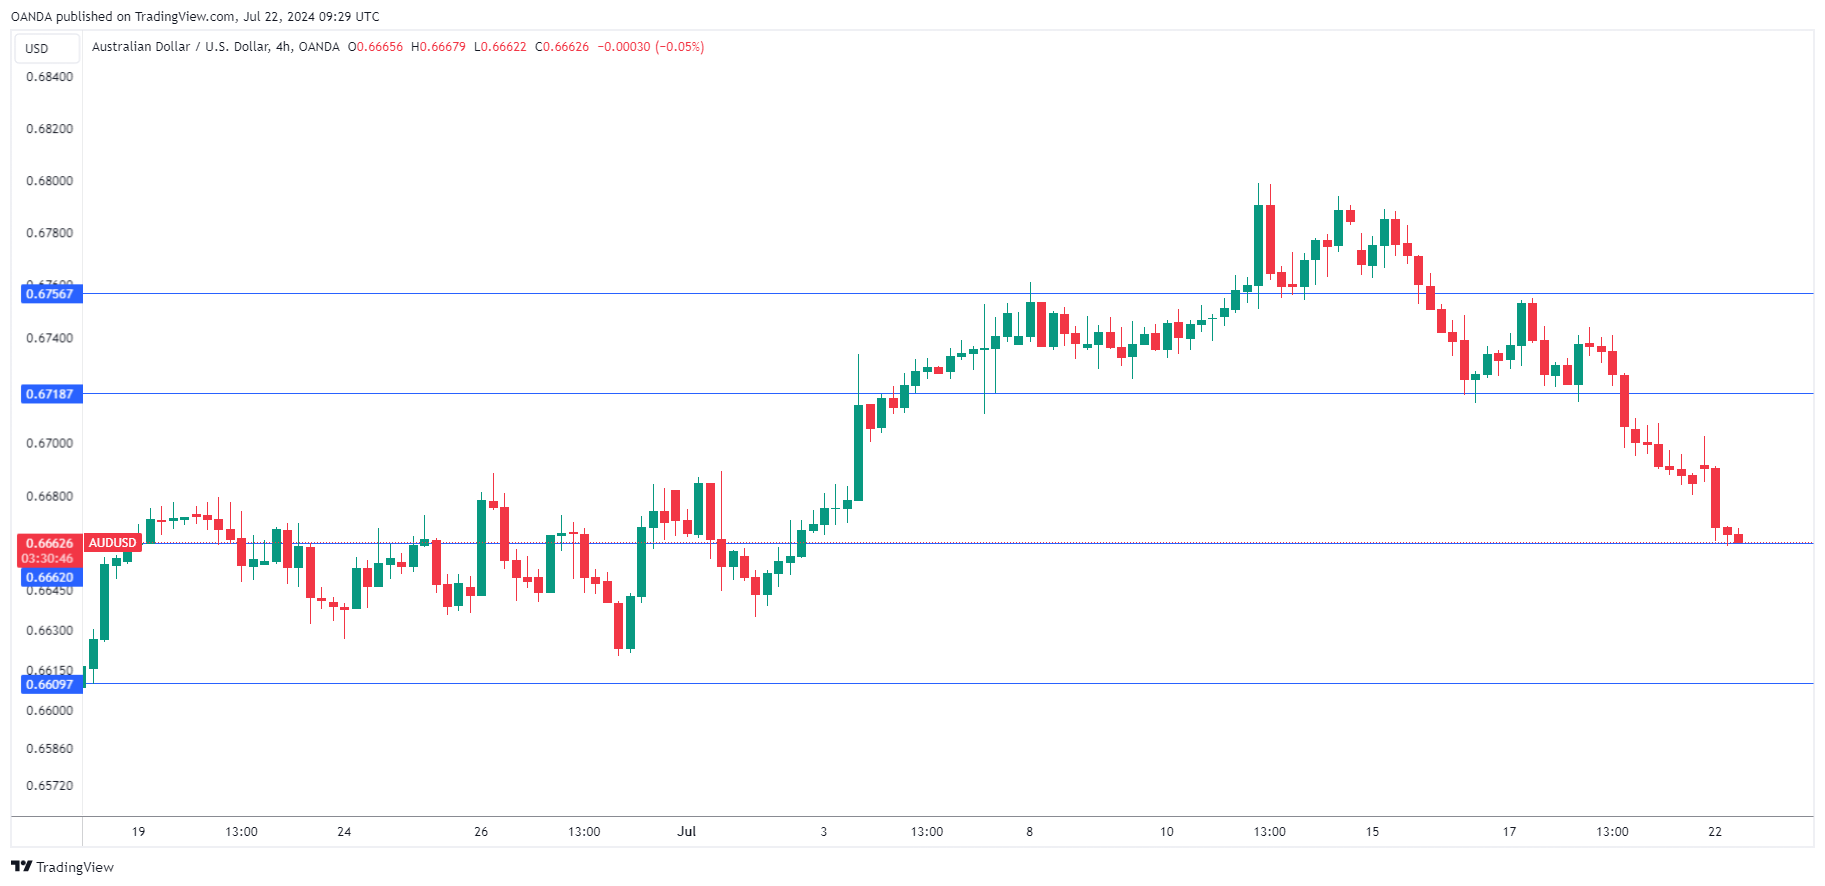
The Australian dollar is coming off a rough week with losses of 1.45% and the downtrend has continued on Monday. AUD/USD is trading at 0.6664 in the European session, down 0.30% on the day at the time of writing. The Aussie climbed 1.9% in the first two weeks of July but has reversed directions and given up all these gains. There are no data releases out of Australia or the US today.
China surprises with rate cut
China surprise the markets by cutting its benchmark lending rates on Monday. The one- year loan prime rate (LPR) was lowered to 3.35% from 3.45% previously and the five-year LPR to 3.85% from 3.95%.
The Chinese central bank made the move in order to boost the economy, which continues to struggle.
China’s GDP slipped to 4.7% in the second quarter, down from 5.3% in the first quarter and below the market estimate of 5.1%. The Chinese government held a plenum last week and released a policy document on its plan to improve the economy. However, the policy update did not contain any concrete plans to deal with major economic issues, such as the property crisis, deflation, and weak consumer confidence.
Will China’s interest rate cuts succeed in kick-starting the sputtering economy and boosting demand? If so, it would be good news for the Australian economy, which is highly dependent on exports to China.
The Federal Reserve is sounding more upbeat about a rate cut, although Jay Powell and his colleagues have been careful not to be specific about the timing of such a critical move. The markets are more and more confident that the Fed will lower rates in September, with a 91% likelihood, according to the CME FedWatch.
AUD/USD Technical
- There is resistance at 0.6718 and 0.6756
- 0.6647 and 0.6609 are the next support levels
NZD/USD Faces Downward Pressure Amid US Political Developments and RBNZ Rate Speculations
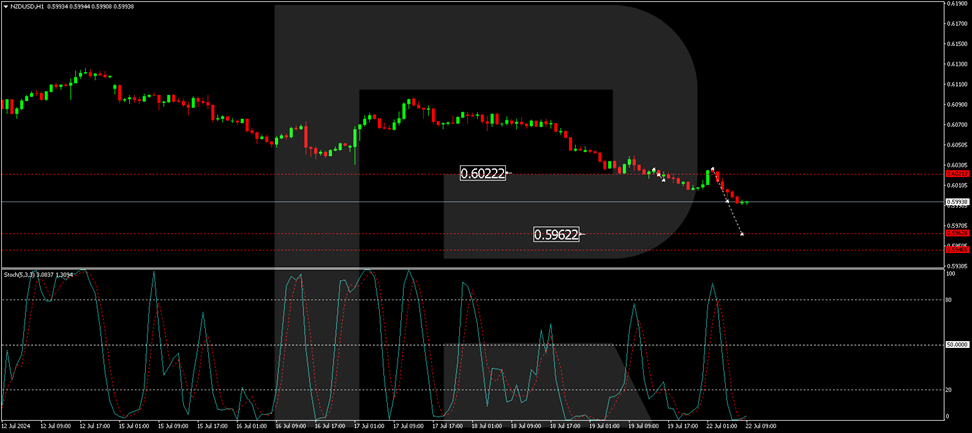
The NZD/USD pair is experiencing a significant downturn, trading around 0.5996. Several factors influence this decline, including global political developments and domestic monetary policy expectations.
The recent announcement by US President Joe Biden that he will not seek re-election in 2024 has unexpectedly bolstered the US dollar. Biden's endorsement of Vice President Kamala Harris as his successor has introduced a new dynamic into the political landscape, generally favouring the stability of the US dollar.
Simultaneously, the New Zealand dollar is weakened by the looming possibility of interest rate cuts by the Reserve Bank of New Zealand (RBNZ). Market participants increasingly expect rate reductions beginning early in August following a weaker-than-expected Q2 inflation report. This anticipation builds on the RBNZ's July decision to maintain the official cash rate at 5.5% per annum, coupled with hints that monetary policy might be relaxed if inflation pressures abate.
Adding to the pressure, recent trade data from New Zealand showed a surplus in June, primarily due to a sharper decline in imports compared to exports, suggesting potential economic softness.
NZD/USD Technical Analysis
The NZD/USD pair has established a consolidation range around the 0.6022 level, with a breakout leading to a continuation of the downward trend. The immediate target is 0.5962, with the potential to extend towards 0.5946. The MACD indicator supports this bearish outlook, as it remains below zero and points downwards, indicating sustained selling momentum.

Resistance was found at 0.6022, and the pair is extending its decline towards 0.5962. A corrective bounce to 0.6000 might occur before resuming the downward movement towards 0.5946. The Stochastic oscillator, currently below 20, suggests a potential brief recovery to around 50 before a likely resumption of the downward trend.
Investors and traders should closely monitor these developments, especially any further political news from the US and upcoming economic data from New Zealand. These factors could significantly impact the pair's movements in the near term.
Safe Havens Gain Favor Amid Geopolitical Tensions and US Election Uncertainty, Gold Above $2400/oz, DXY Slips
- Increased geopolitical tensions in the Middle East and US election uncertainty have caused a rise in safe-haven demand, particularly for Gold.
- The US Dollar has weakened due to concerns about a potential Kamala Harris presidency and its implications on the economy.
- Market sentiment is expected to be driven by US election developments and geopolitical issues in the first half of the week.
The week kicked off with heightened market activity due to escalating tensions in the Middle East and a surprising announcement from US President Joe Biden on Sunday evening that he will not seek re-election.
Geopolitical concerns surged as the Israeli military launched retaliatory strikes on the port of Hodeidah in Yemen and other targets, prompting threats of new military action from the Houthis against Israel. This escalation raises the risk of a broader conflict in the Middle East, with comments from Russia and Iran further fueling concerns.
Adding to the uncertainty, President Biden unexpectedly announced that he would complete his current term but not run for re-election. This development introduces a new layer of intrigue and uncertainty, which markets typically find unsettling. Following Biden’s announcement, many Democrats quickly rallied behind Vice President Kamala Harris. The US Dollar weakened slightly as markets began to consider the implications of a potential Harris presidency on the economy.
Safe Haven Bids
Markets opened with a strong demand for safe havens, pushing Gold higher in Asian trade, while the Japanese Yen and Swiss Franc also saw gains. Throughout most of the year, the US Dollar has benefited from safe haven flows, but not this time. The current fear stems partly from the prospect of a Kamala Harris and Democratic victory, which could theoretically weaken the US Dollar in the long term due to potential tax increases and lower borrowing costs. This concern likely explains the diminished safe haven appeal of the US Dollar at the moment.
As you can see from the currency strength chart below, JPY and CHF are leading the way this morning.
Currency Strength Chart

Source:FinancialJuice (click to enlarge)
Looking ahead, there is a slew of important economic data on the horizon. However, for now, I expect that US election developments and geopolitical issues will primarily drive market sentiment in the first half of this week. Unless there are significant escalations or unexpected changes, we may remain in a risk-off mode until Wednesday when key US economic data starts to come in.
Technical Analysis on XAU/USD
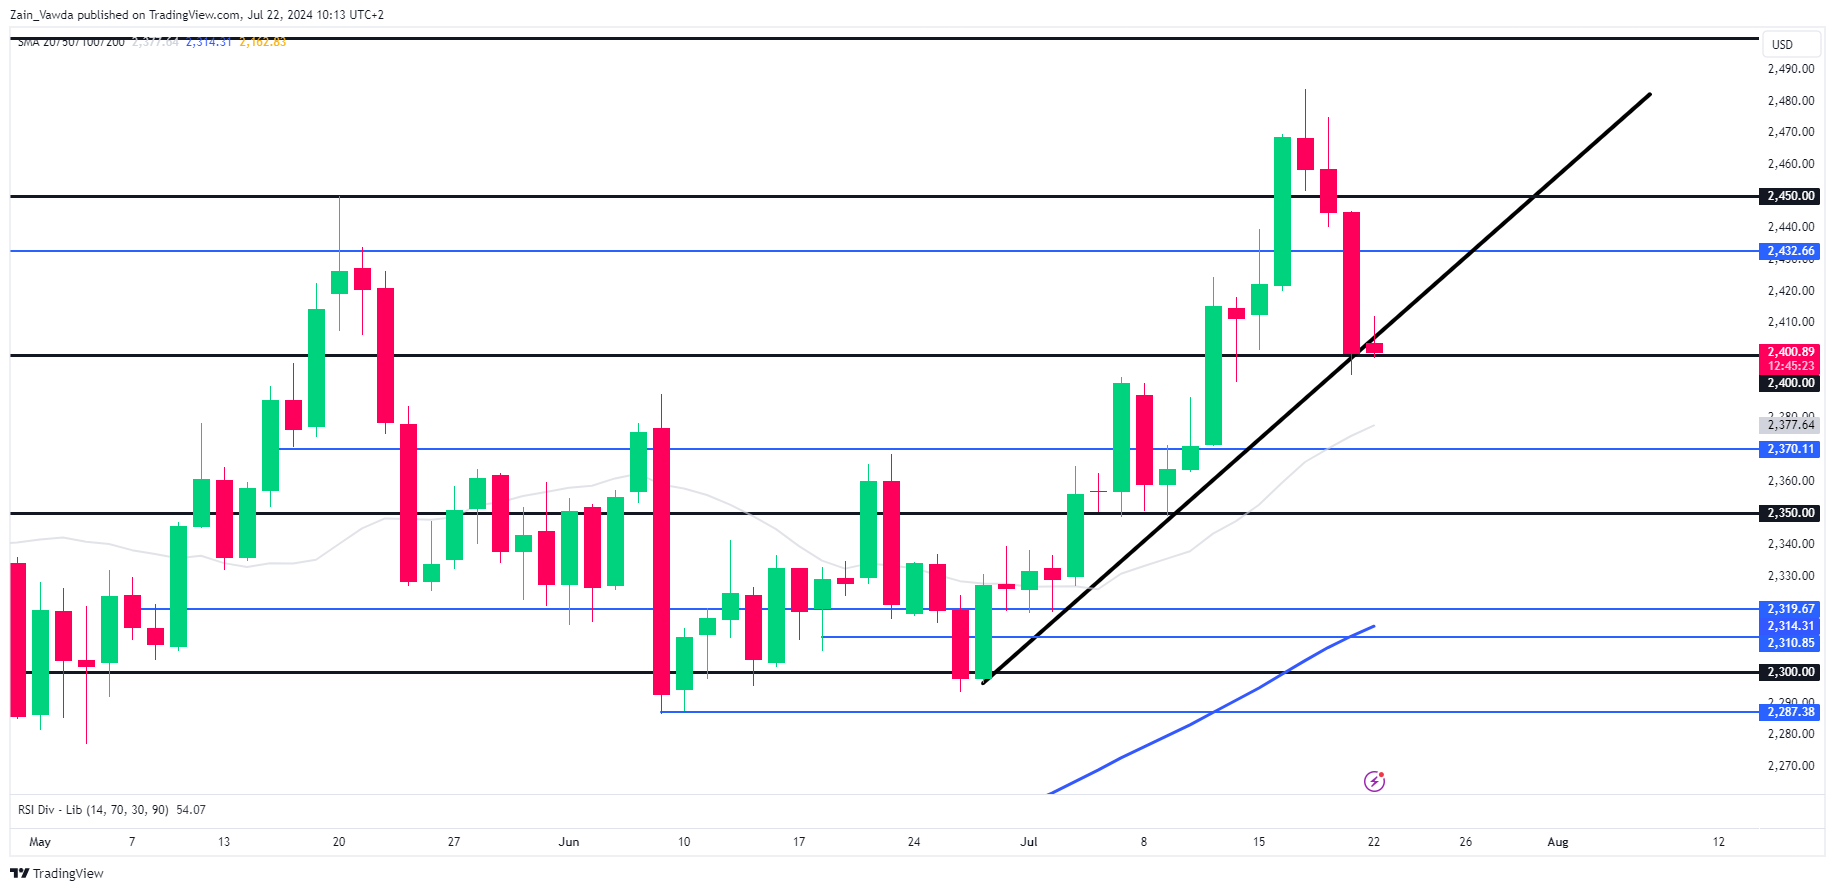
Spot Gold (XAU/USD) experienced significant selling pressure on Thursday and Friday but managed to cling to the crucial $2400/oz psychological level. With risk-off sentiment on the rise, further gains could be in store for the precious metal, especially if it continues to hold above the $2400/oz mark.
A weaker US Dollar at the start of the week may also help Gold stage an early recovery. Any signs of escalating tensions or increased uncertainty around the US elections are worth monitoring, as they could further impact Gold prices.
On the weekly timeframe, Gold printed a massive shooting star rejection candle, suggesting potential downside ahead. Moving to the daily chart, Gold prices are eyeing a break of the ascending trendline, which could lead to a retest of the 20-day moving average, currently at 2377.
Overall, the technical and fundamental outlooks are at odds as the week begins. The key question for many this week is which side will dominate and drive price action moving forward.
Support
- 2400 (psychological level)
- 2392
- 2377 (20-day MA)
Resistance
- 2432
- 2450
- 2475
XAU/USD Daily Chart, July 22, 2024
Source: TradingView.com (click to enlarge)
BTC/USD Analysis: Price Approaching Key Resistance
Analysing the long-term BTC/USD chart on 16th May, we created a "roadmap" for Bitcoin's price, which looked like an expanding fan and consisted of a median line with support levels below it and resistance levels above it.
Today, when analysing the BTC/USD chart, we will remove the fan lines to shift the focus to Bitcoin's price action within the context of two trend channels:
→ Blue ascending channel. Its median coincides with the median of the previously mentioned fan.
→ Red descending channel. This appears to be a correction within the larger ascending channel.
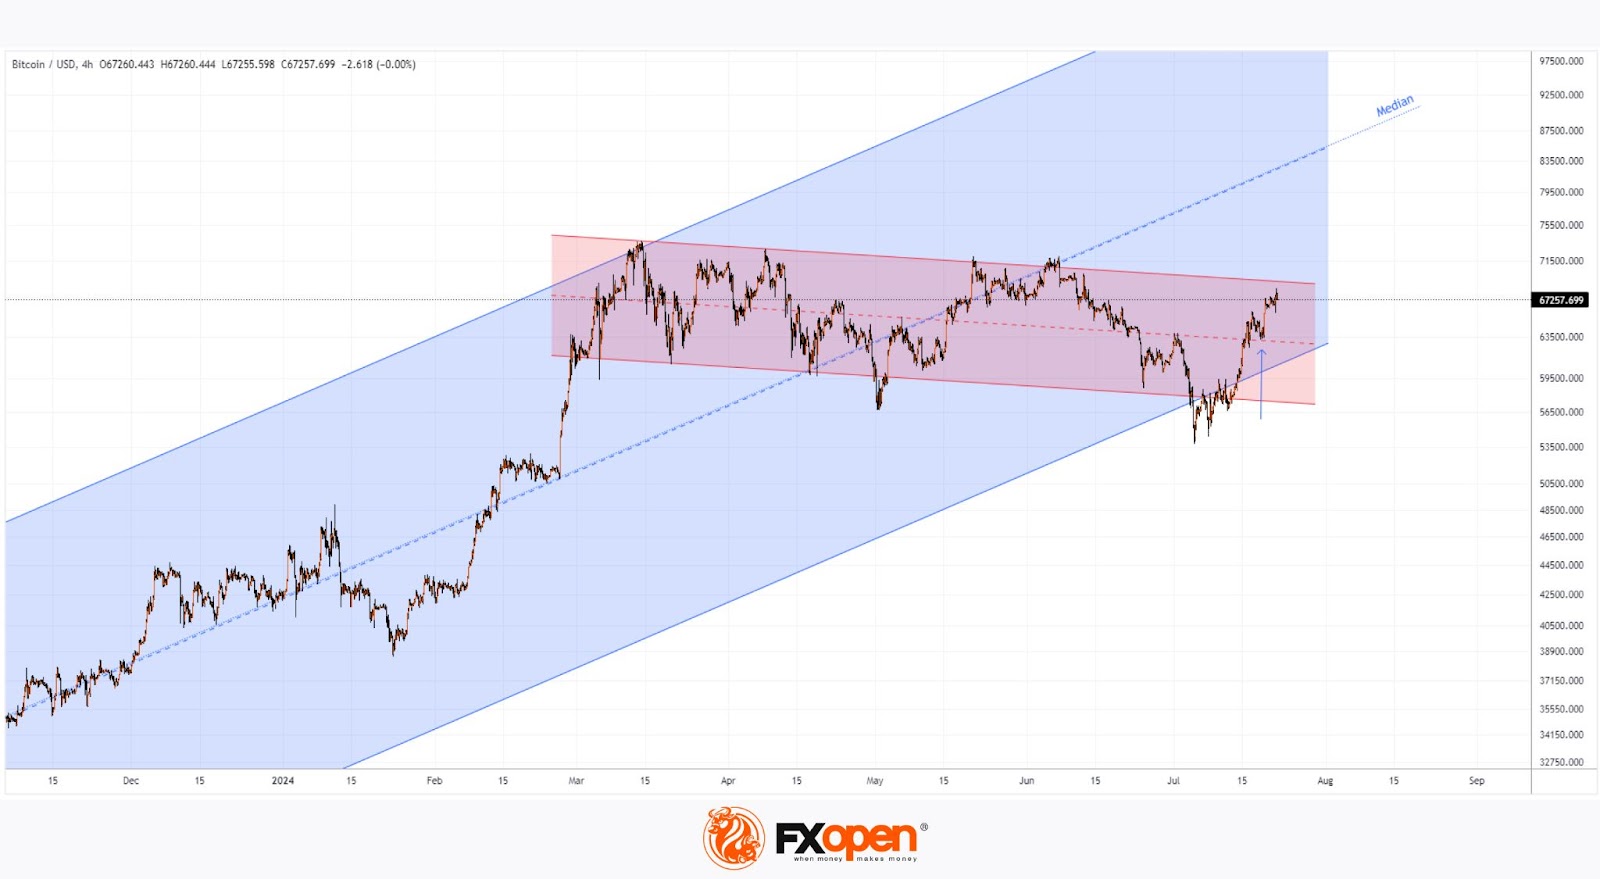
Bitcoin's price today is approaching the resistance formed by the upper boundary of the red channel. The price action relative to this resistance will provide crucial information – has the leading cryptocurrency indeed been going through a correction phase?
An optimistic scenario is not out of the question – there could be a bullish breakout of the upper boundary of the red channel by the end of July, paving the way to the median of the blue channel, along which the price has been rising since last autumn.
From a technical analysis perspective, supporting this scenario is the fact that the median of the red channel has switched roles from resistance to support (indicated by an arrow).
From a fundamental perspective, market participants' optimism is bolstered by the approval of the Ethereum ETF and the upcoming Bitcoin 2024 conference in Nashville, scheduled for 25-27 July. It is expected that Donald Trump and Elon Musk will speak at the event, potentially making significant announcements.
FXOpen offers the world's most popular cryptocurrency CFDs*, including Bitcoin and Ethereum. Floating spreads, 1:2 leverage — at your service. Open your trading account now or learn more about crypto CFD trading with FXOpen.
*At FXOpen UK and FXOpen AU, Cryptocurrency CFDs are only available for trading by those clients categorised as Professional clients under FCA Rules and Professional clients under ASIC Rules respectively. They are not available for trading by Retail clients.
This article represents the opinion of the Companies operating under the FXOpen brand only. It is not to be construed as an offer, solicitation, or recommendation with respect to products and services provided by the Companies operating under the FXOpen brand, nor is it to be considered financial advice.
WTI Oil Outlook: Bears Taking a Breather After 4.3% Weekly Drop
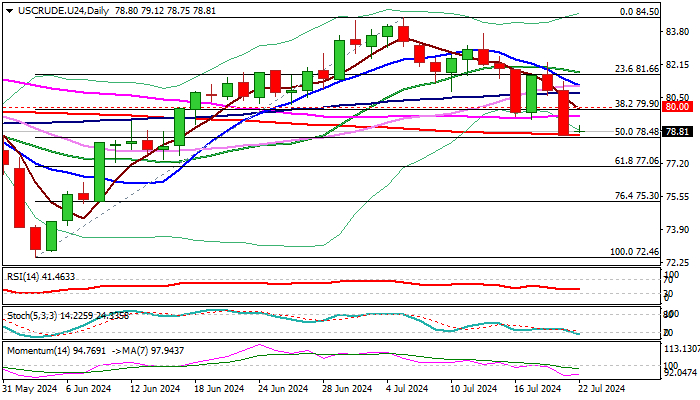
WTI oil price is holding within a narrow consolidation in early Monday, following sharp acceleration lower on Friday (down 2.8% for the day) and weekly loss of 4.3% (the biggest weekly drop since the last week of April.
Oil closed below $80 on Friday, for the first time in five weeks, with near-term action being weighed by large Friday’s and weekly bearish candles.
Friday’s drop was contained by 200DMA ($78.62), with oversold conditions on daily chart, prompting traders for a partial profit-taking.
Oil price was pressured by weaker than expected economic data from China which fueled fears about lower demand from the world’s second largest economy.
Market’s focus is shifting on Fed amid growing expectations that the US central bank would give firmer signals of the timing of the start of monetary policy easing cycle, during the policy meeting on July 30/31, with September seen as possible time to begin cutting interest rates.
Technical picture on daily chart is predominantly bearish, with corrective upticks to be ideally capped by psychological $80 barrier (also daily cloud top) to keep bears in play for further weakness below pivots at $78.62/48 (200DMA / 50% retracement of $72.46/$84.50).
Caution on break above $80 which would sideline immediate bears, but stronger acceleration higher and regain of $81.60/$82.00 zone will be required to revive bulls.
Res: 79.55; 80.00; 80.84; 81.16.
Sup: 78.62; 78.48; 77.06; 76.13.
Gold Declines Sharply from All-time High
- Gold jumped to its highest level ever on July 17
- But reversed lower due to reaching overbought conditions
- Despite latest weakness, oscillators remain positively tilted
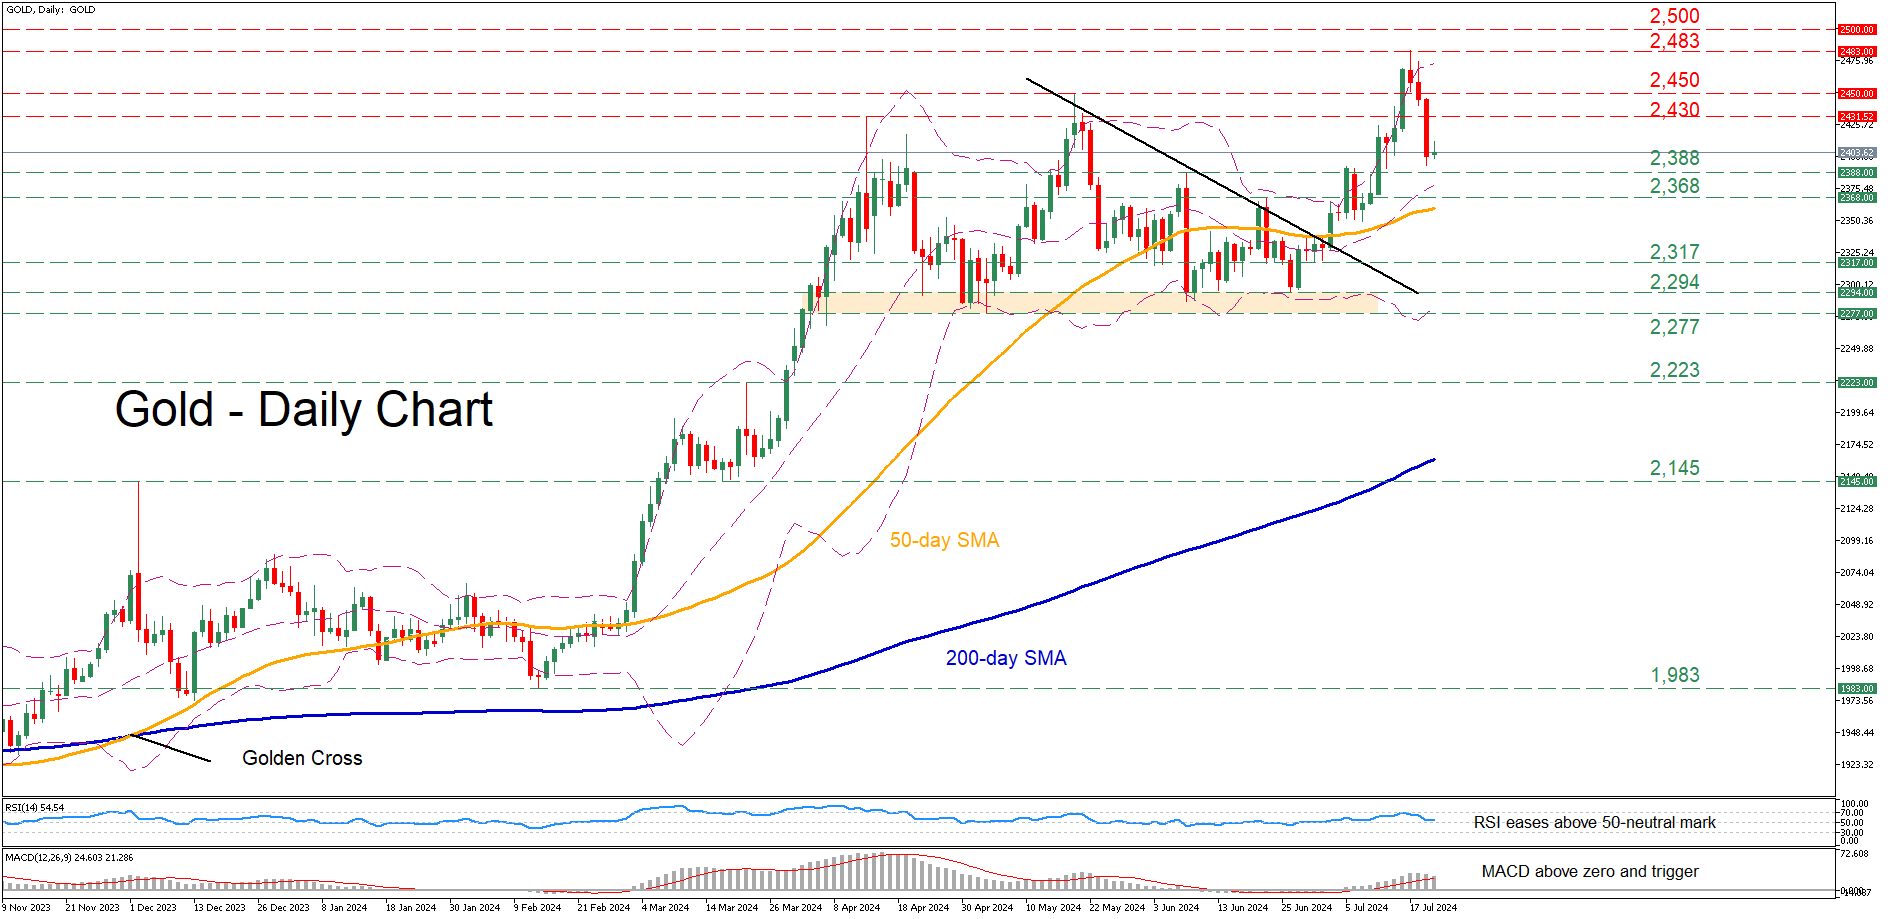
Gold had been in a steady uptrend since late May, which led to a fresh all-time high of 2,483 last week. However, the pair quickly corrected lower as the momentum indicators warned of an overstretched advance.
Should the pullback extend, the price could inch lower towards two previous resistance zones of 2,388 and 2,368, which could now serve as support. Further declines could then stall at 2,317, a region that held its ground both in June and July. Even lower, bullion might face the 2,294-2,277 range, defined by the May and June lows.
On the flipside, if the bulls attempt to strike back, immediate resistance could be found at the April high of 2,430. Surpassing that hurdle, gold might attempt to revisit its May high of 2,450. A violation of that zone could set the stage for the recent record peak of 2,483.
In brief, gold has been undergoing a pullback after its trip to all-time highs came to an end. Should the bears keep the pedal to the metal, the 50-day simple moving average (SMA) might quickly come under scrutiny.
Market Analysis: GBP/USD Trims Gains While USD/CAD Rallies
GBP/USD started a pullback from the 1.3050 zone. USD/CAD is rising and might aim for more gains above the 1.3735 resistance.
Important Takeaways for GBP/USD and USD/CAD Analysis Today
- The British Pound started a downside correction from the 1.3050 resistance zone.
- There is a key bearish trend line forming with resistance at 1.2940 on the hourly chart of GBP/USD at FXOpen.
- USD/CAD is showing positive signs above the 1.3700 support zone.
- There is a major bullish trend line forming with support at 1.3720 on the hourly chart at FXOpen.
GBP/USD Technical Analysis
On the hourly chart of GBP/USD at FXOpen, the pair struggled to continue higher above the 1.3050 resistance zone. The British Pound started a downside correction and traded below the 1.3010 support zone against the US Dollar.
The pair even traded below 1.2970 and the 50-hour simple moving average. Finally, the bulls appeared near the 1.2900 level. A low was formed at 1.2900 and the pair is now consolidating losses below the 23.6% Fib retracement level of the downward move from the 1.3044 swing high to the 1.2900 low.
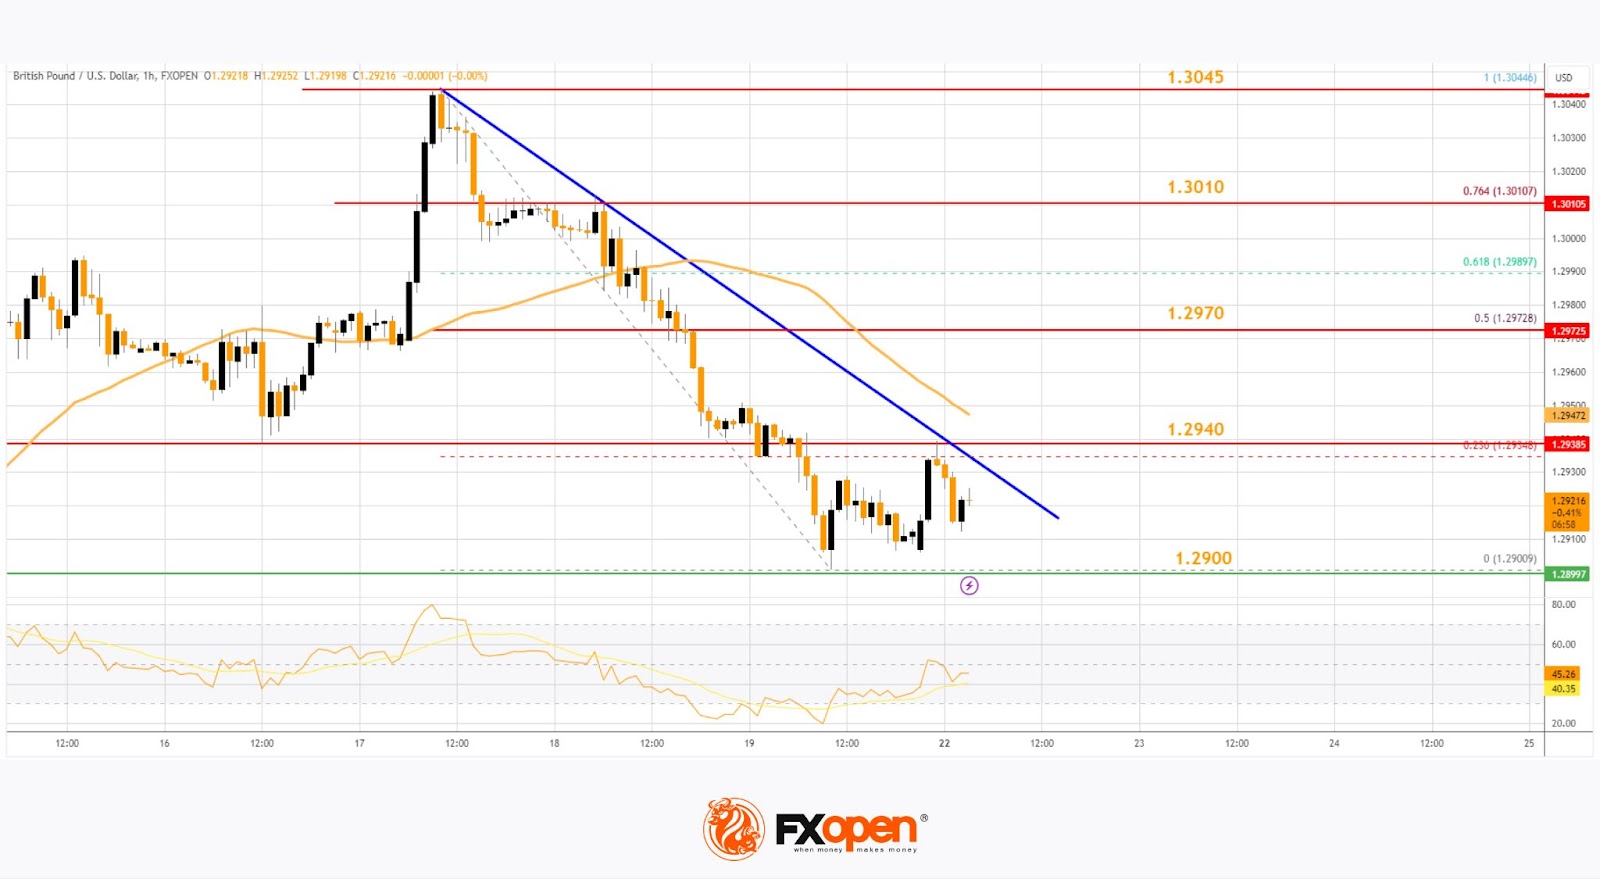
Immediate resistance on the upside is near a key bearish trend line at 1.2940. The first major resistance is near the 1.2970 zone and the 50% Fib retracement level of the downward move from the 1.3044 swing high to the 1.2900 low.
The main hurdle sits at 1.3010. A close above the 1.3010 resistance might spark a steady upward move. The next major resistance is near the 1.3050 zone. Any more gains could lead the pair toward the 1.3120 resistance in the near term.
Initial support on the GBP/USD chart sits at 1.2900. The next major support sits at 1.2880, below which there is a risk of another sharp decline. In the stated case, the pair could drop toward 1.2840.
USD/CAD Technical Analysis
On the hourly chart of USD/CAD at FXOpen, the pair formed a strong support base above the 1.3660 level. The US Dollar started a fresh increase above the 1.3680 resistance against the Canadian Dollar.
The bulls pushed the pair above the 1.3700 and 1.3720 levels. The pair cleared the 50-hour simple moving average and climbed above 1.3735. A high was formed at 1.3747 and the pair recently corrected some gains.
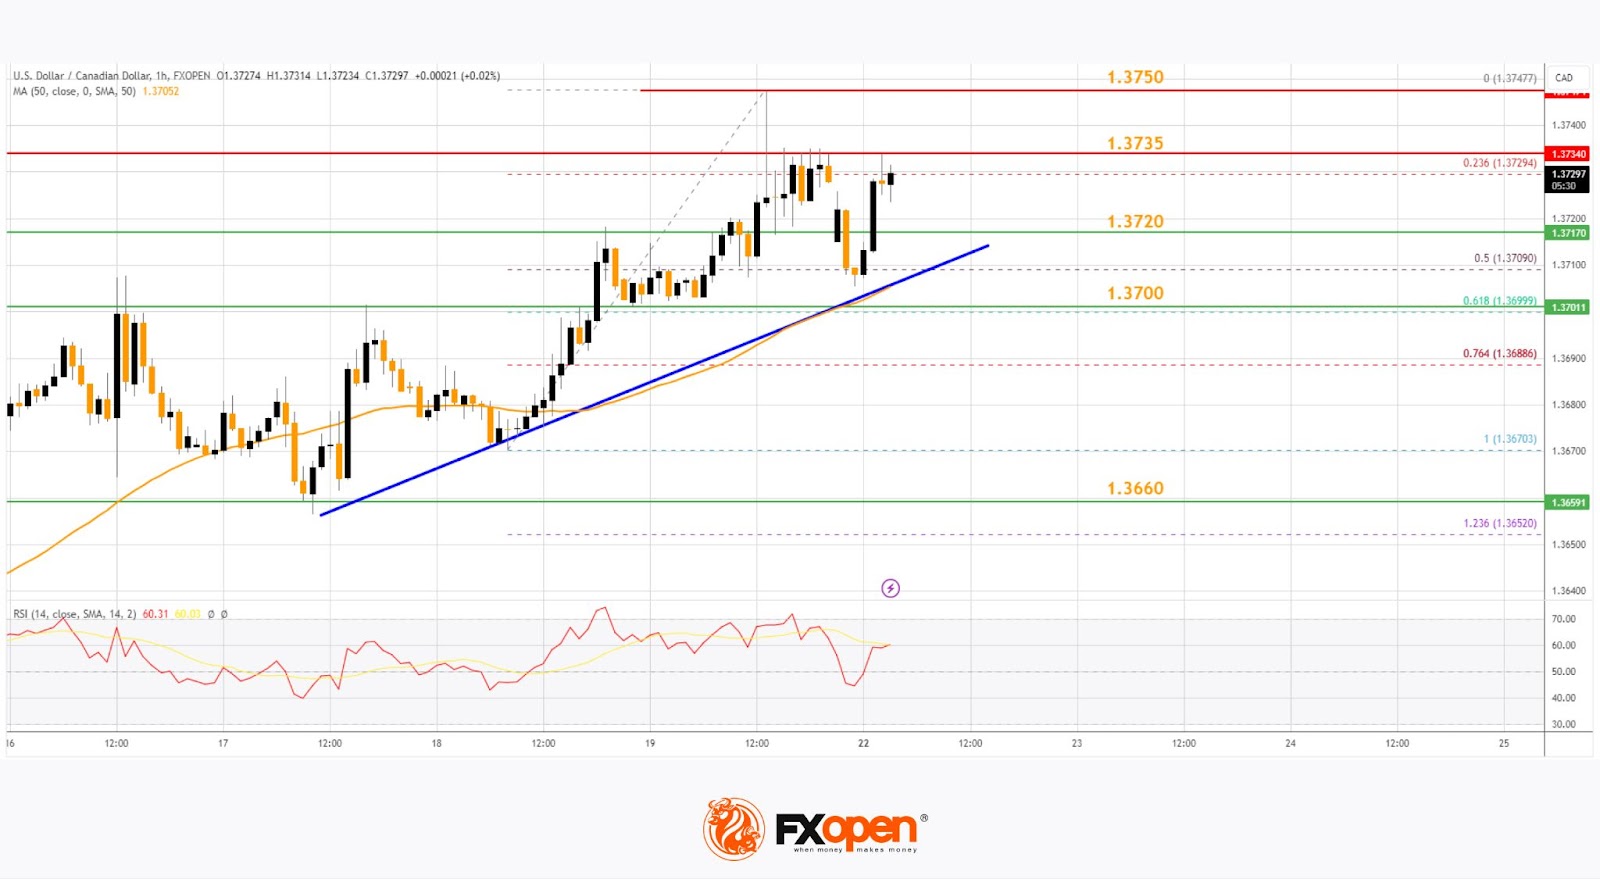
There was a move below the 23.6% Fib retracement level of the upward move from the 1.3670 swing low to the 1.3747 high. Initial support is near a major bullish trend line at 1.3720.
The next major support is near 1.3700 or the 50% Fib retracement level of the upward move from the 1.3670 swing low to the 1.3747 high on the same USD/CAD chart. The main support sits near the 1.3660 zone.
A downside break below the 1.3660 level could push the pair further lower. The next major support is near the 1.3625 support zone, below which the pair might visit 1.3550.
If there is another increase, the pair might face resistance near the 1.3735 level. A clear upside break above 1.3735 could start another steady increase. The next major resistance is the 1.3750 level.
A close above the 1.3750 level might send the pair toward the 1.3785 level. Any more gains could open the doors for a test of the 1.3820 level.
Trade over 50 forex markets 24 hours a day with FXOpen. Take advantage of low commissions, deep liquidity, and spreads from 0.0 pips. Open your FXOpen account now or learn more about trading forex with FXOpen.
This article represents the opinion of the Companies operating under the FXOpen brand only. It is not to be construed as an offer, solicitation, or recommendation with respect to products and services provided by the Companies operating under the FXOpen brand, nor is it to be considered financial advice.
EUR/USD Daily Outlook
Daily Pivots: (S1) 1.0870; (P) 1.0889; (R1) 1.0903; More....
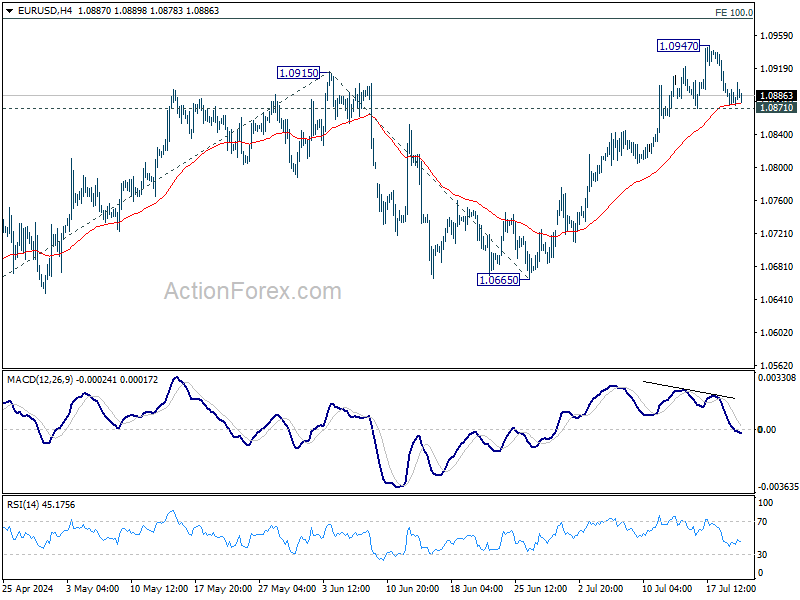
Intraday bias in EUR/USD stays neutral and further rise is in favor as long as 1.0871 minor support holds. Break of 1.0947 will target 100% projection of 1.0601 to 1.0915 from 1.0665 at 1.0979. However, firm break of 1.0871 will turn bias to the downside for deeper fall to 55 D EMA (now at 1.0809) and possibly below.
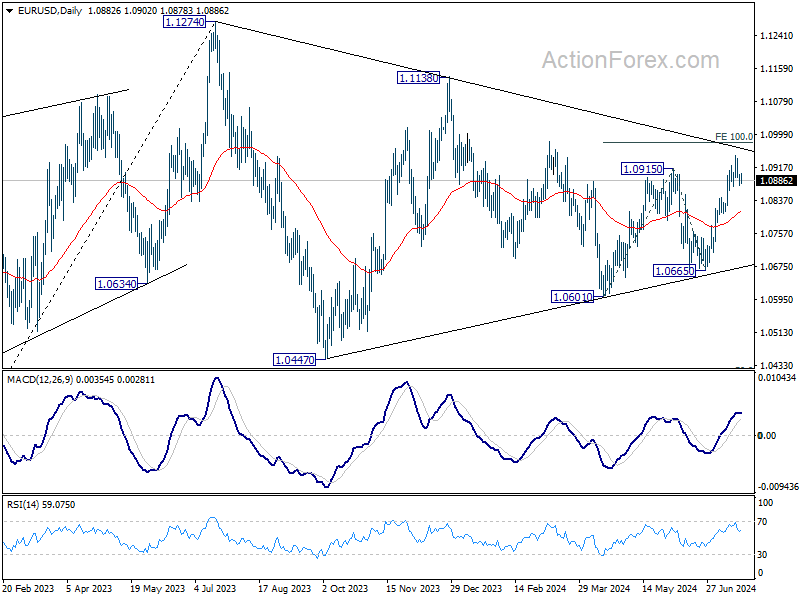
In the bigger picture, price actions from 1.1274 are viewed as a corrective pattern, possibly a triangle, that's still be in progress. Break of 1.1138 resistance will be the first signal that rise from 0.9534 (2022 low) is ready to resume through 1.1274 (2023 high). This will now remain the favored case as long as 1.0601 support holds.
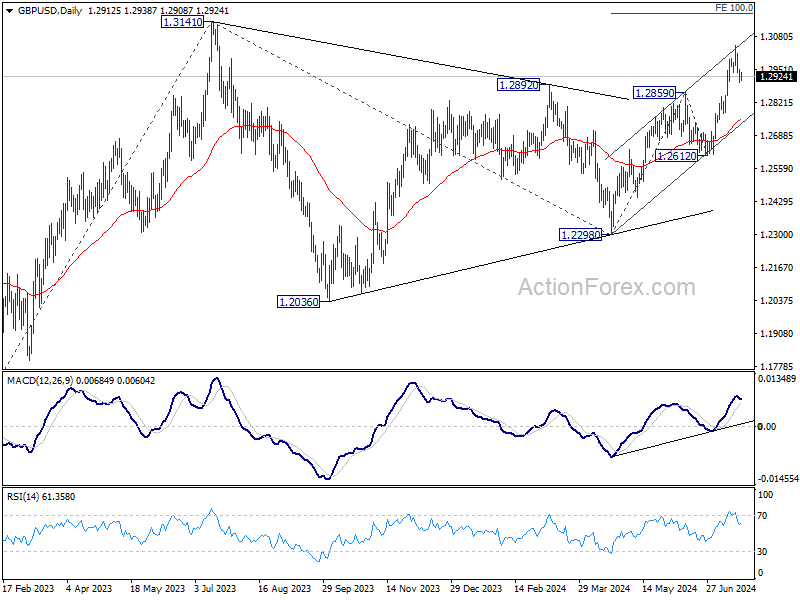
GBP/USD Daily Outlook
Daily Pivots: (S1) 1.2886; (P) 1.2930; (R1) 1.2958; More...
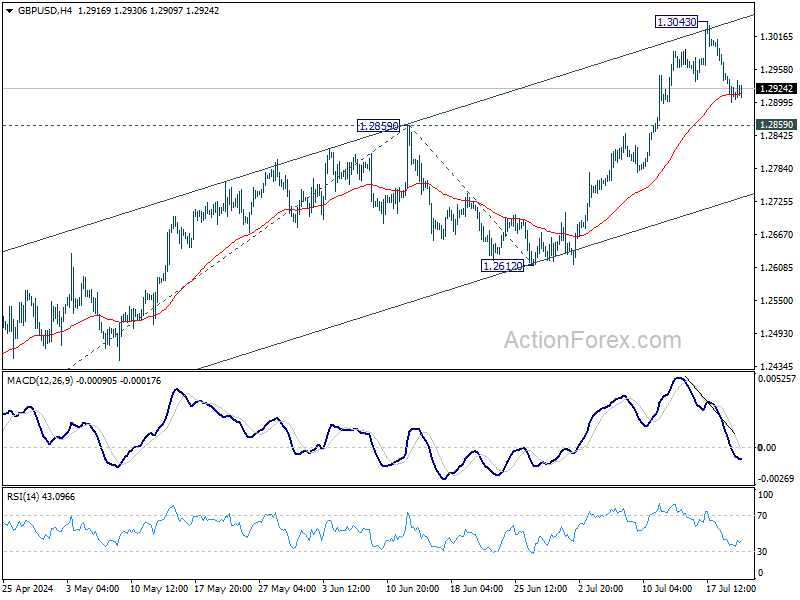
Intraday bias in GBP/USD remains neutral first. Downside of consolidations should be contained by 1.2859 resistance turned support to bring another rally. Break of 1.3043 will resume the rise from 1.2298 and target 100% projection of 1.2298 to 1.2859 from 1.2612 at 1.3173, which is slightly above 1.3141 key medium term resistance. However, firm break of 1.2859 will turn bias to the downside for deeper decline.
In the bigger picture, corrective pattern from 1.3141 medium term top (2023 high) could have completed with three waves to 1.2298 already. This will now remain the favored case as long as 1.2612 support holds. Firm break of 1.3141 will target 61.8% projection of 1.0351 (2022 low) to 1.3141 from 1.2298 at 1.4022.
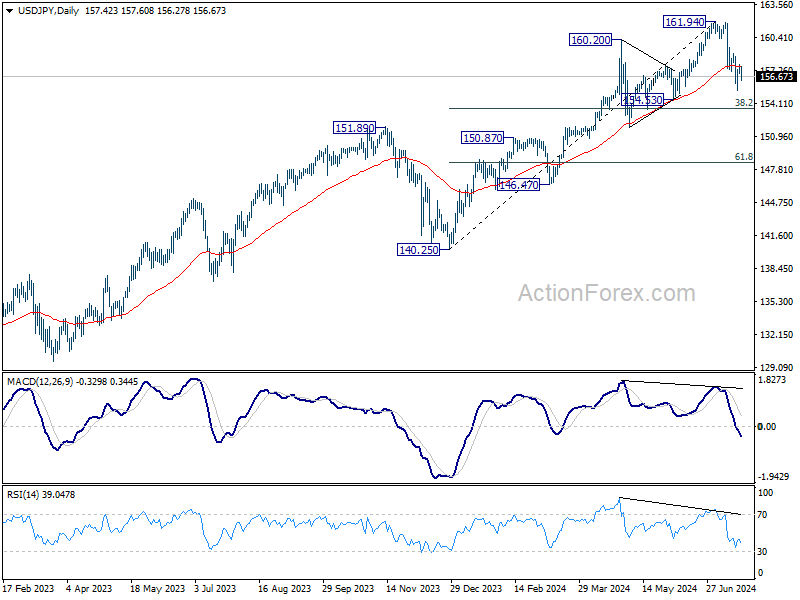
USD/JPY Daily Outlook
Daily Pivots: (S1) 157.02; (P) 157.38; (R1) 157.78; More...
Intraday bias in USD/JPY stays neutral and further decline is expected with 158.85 resistance intact. Below 155.36 will target 38.2% retracement of 140.25 to 161.94 at 153.65. On the upside, above 158.85 resistance will turn bias back to the upside for stronger rebound instead.
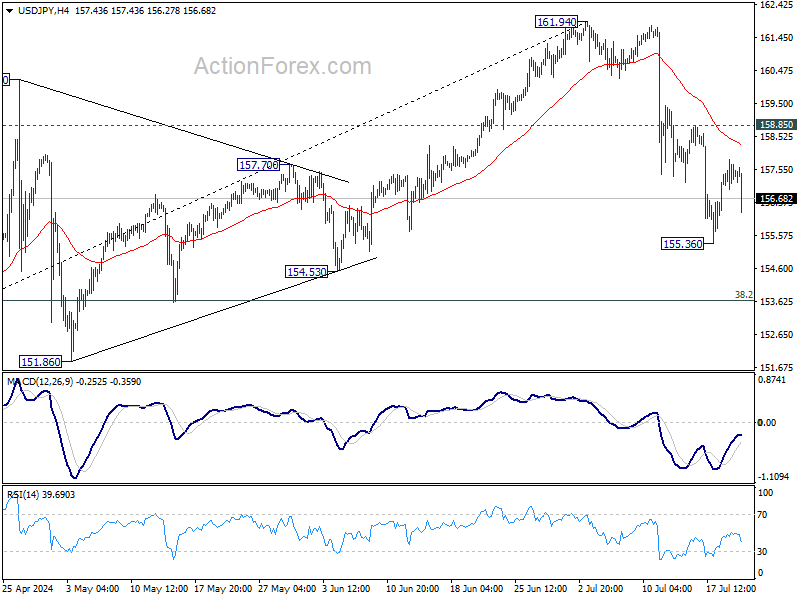
In the bigger picture, as long as 151.89 resistance turned support holds, long term up trend could still continue through 161.94 at a later stage. Next target will depend on the depth of the current correction from 161.94. However, sustained break of 151.89 will argue that larger scale correction or trend reversal is underway.