Sample Category Title
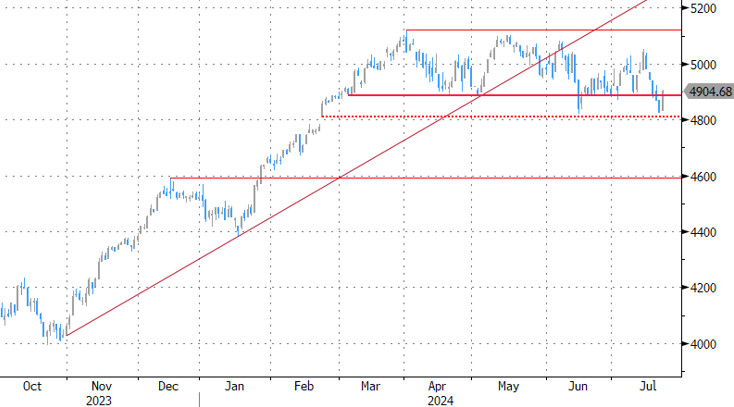
S&P 500 Wave Analysis
- S&P 500 continues daily uptrend
- Likely to rise to resistance level 5675.00
S&P 500 Index recently reversed from the support area between the key support level 5500.00 (former resistance from June) and the 38.2% Fibonacci correction of the previous upward impulse from May.
The upward reversal from this support area will likely form the daily Japanese candlesticks reversal pattern Bullish Engulfing if the price closes today near the current levels – a strong buy signal for this index.
Given the clear daily uptrend, S&P 500 Index can be expected to rise further to the next resistance level 5675.00 (top of the previous wave i).

July Flashlight for the FOMC Blackout Period
Summary
- Congress has given the Federal Reserve a dual mandate of "maximum employment" and "price stability." With inflation surging to a 40-year high in 2022, the FOMC largely has focused on its "price stability" mandate in recent years.
- However, inflation is showing signs of moving back toward the FOMC's target of 2% on a sustained basis, and the labor market has softened somewhat recently. In short, the implicit weighting of the two objectives in the FOMC's reaction function seem to be moving back into balance.
- We do not believe a consensus exists among FOMC members to cut rates at the upcoming meeting. But, we think the Committee will signal via its post-meeting statement that a rate cut could come as soon as its next meeting on September 18. Specifically, the FOMC likely will indicate it has seen more material improvement on inflation in recent months. We also expect the statement to acknowledge the Committee is now attentive to labor market risks as well, rather than focusing solely on inflation risks.
- The real fed funds rate has crept higher in recent months as inflation has receded. This passive tightening of monetary policy is another reason for the FOMC to consider policy easing in the not-too-distant future.
- In our view, the presidential election on November 5 will not preclude a rate cut on September 18, if conditions warrant. The historical record shows that political considerations do not seem to enter the FOMC's calculus.
The Objectives of the Fed's Dual Mandate Are Moving into Balance
Congress has given the Federal Reserve a dual mandate: “maximum employment” and “stable prices.” The former is more of a theoretical concept than a precise target, but Fed officials have chosen to define the latter as a 2% annual change in the price index for personal consumption expenditures (PCE). Prior to the pandemic, when PCE inflation was consistently running at, or below, 2%, the Federal Open Market Committee (FOMC) seemed to have placed equal weight on these two objectives when setting the stance of monetary policy. However, the surge in the year-over-year rate of PCE inflation to a 40-year high of roughly 7% in 2022 led the FOMC to focus almost entirely on the price stability part of its dual mandate (Figure 1). Consequently, the FOMC jacked up its target range for the federal funds rate by 525 bps between March 2022 and July 2023, the fastest pace of monetary tightening since the early 1980s.
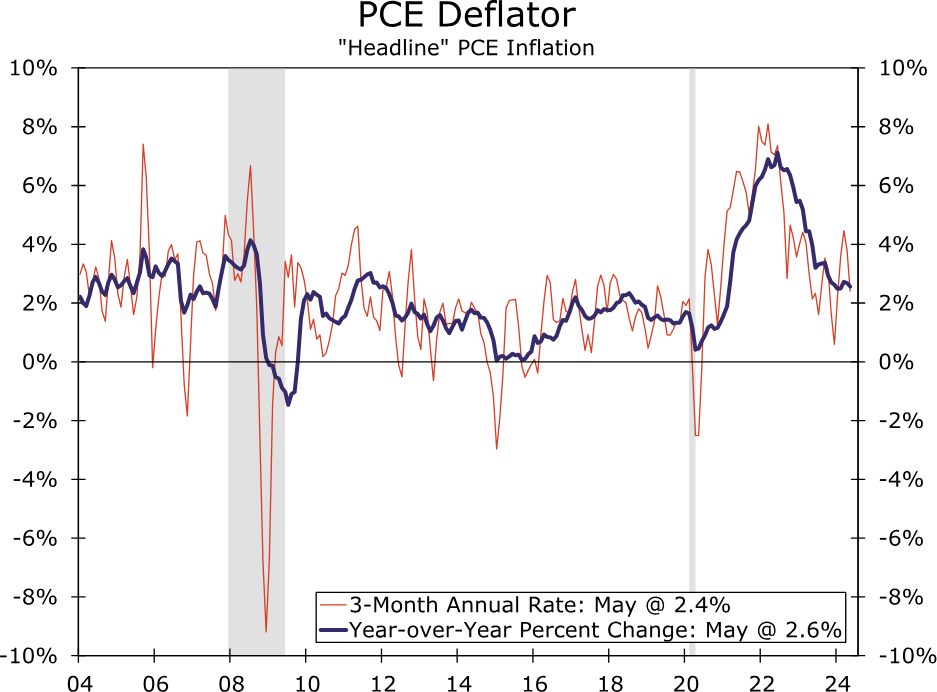
However, the implicit weighting of the two objectives in the FOMC's reaction function seem to be moving back into balance due to recent economic developments. For starters, inflationary momentum is slowing. The PCE price index rose at an annualized rate of 2.4% between February and May, down sharply from the 3.8% annualized rate that was registered in April (Figure 1). If our forecast of a 0.1% monthly increase in the PCE price index in June is accurate—the data are scheduled for release on July 26—then that three-month annualized rate of change will slow to only 1.3%. Inflation also appears to be back near the Fed's target when looking at the less volatile core PCE index, which we estimate rose at a 2.0% annualized rate in the three months through June. Over the 12-month period ending in June, we expect both headline and core PCE inflation to have risen 2.5% and 2.6%, respectively. Although still above the FOMC's 2% target, inflation has returned to a pace much more in line with recent history.
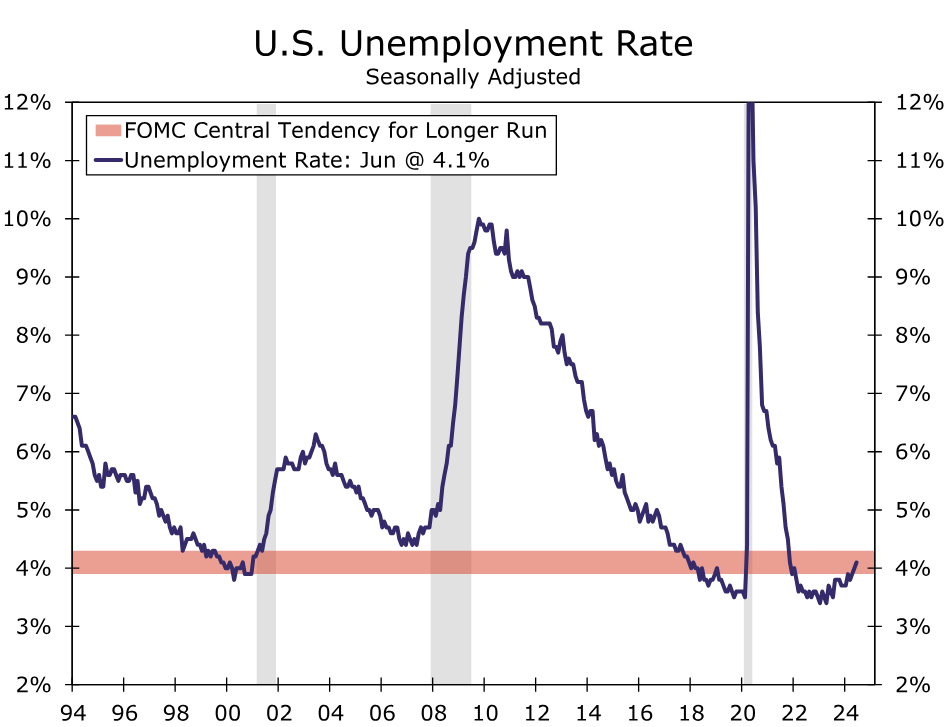
On the other side of the mandate, a number of indicators suggest that the labor market is softening. Growth in nonfarm payrolls slowed from an average monthly increase of 267K in the first quarter to 177K in the second quarter. The unemployment rate, which was as low as 3.4% in April 2023, has moved up to 4.1% (Figure 2). Continuing claims for unemployment insurance have risen to their highest level since November 2021, indicating it is taking longer for unemployed workers to find new jobs. The job openings rate, which measures total job openings as a percent of payrolls plus openings, has receded considerably over the past two years and currently stands near its level of late 2019.
Signal From Post-Meeting Statement: Rate Cuts Are Coming
With inflation having more clearly resumed its trek back to 2% and the jobs market no longer overheated, a reduction in the fed funds rate is coming closer into view. We expect the FOMC will hold its policy rate at its current range of 5.25%-5.50% at the conclusion of its upcoming meeting on July 31. But we expect the Committee will signal a rate cut could come as soon as its next meeting on September 18. While an updated Summary of Economic Projections (SEP) will not be released at this meeting, we expect the Committee will send a rate cut signal via changes to the post-meeting statement.
Specifically, the FOMC likely will indicate it has seen more material improvement on inflation in recent months than the “modest” further progress it noted in the statement from the June meeting. For example, it could say that there has been “additional” further progress, and this would be consistent with the Committee accumulating some “greater confidence” of inflation returning toward 2% on a sustained basis. In that regard, San Francisco Fed President Mary Daly, a voting member of the FOMC this year, recently stated “confidence is growing that we're getting nearer a sustainable pace of getting inflation back down to 2%,” although she went on to note “we have a lot more information to get before we can make any real determination.”
We also expect to see the statement elevate downside risks to the labor market. The Committee may note that its employment and inflation goals are now balanced, rather than merely having “moved toward better balance.” The post-meeting statement has indicated for some time that “the Committee remains highly attentive to inflation risks.” We see a strong possibility the statement will add a clause indicating the Committee is attentive to labor market risks as well. That message was delivered by Chair Powell in his testimony to Congress earlier this month, and one that has been echoed by other FOMC participants over the inter-meeting period, including Governors Waller and Kugler, and regional Fed Presidents Daly and Barkin (Richmond–voter). In the same vein, a modest downgrade to the characterization of recent economic activity and labor conditions would not surprise us.
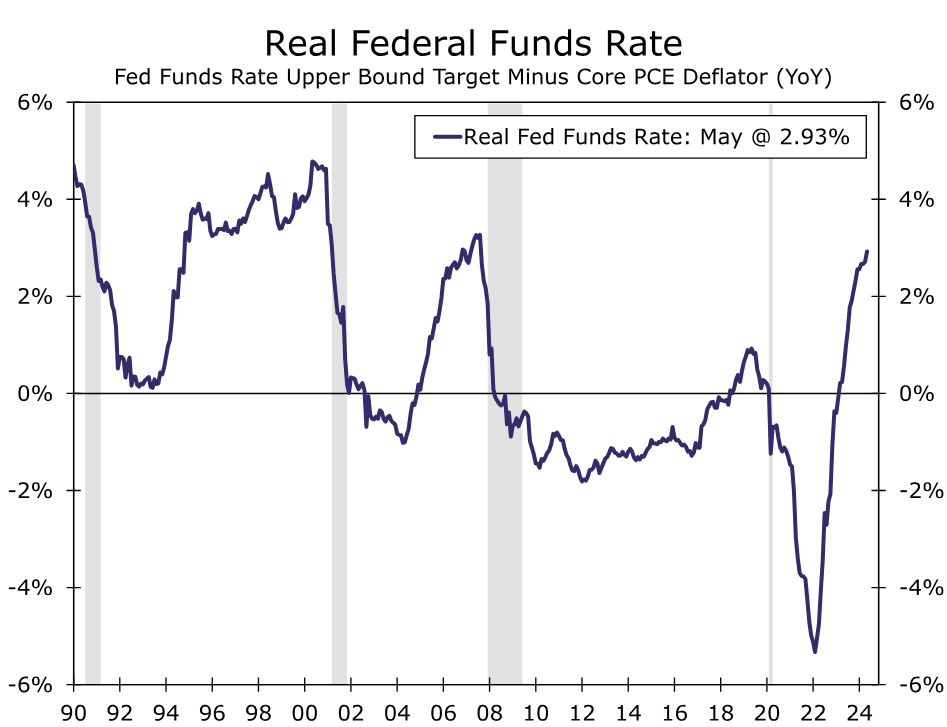
There has been a passive tightening of monetary policy in recent months, which is another reason to cut rates soon. That is, the stance of policy is measured by the real fed funds rate, not by nominal interest rates. We measure the real fed funds rate by subtracting the year-over-year change in the core PCE price index from the nominal fed funds rate (Figure 3). By that metric, the real fed funds rate currently stands near 3%, the highest level since 2007. Most observers, members of the FOMC included, believe the stance of monetary policy today is "restrictive." Austan Goolsbee, the president of the Federal Reserve Bank of Chicago and a voter at the July 31 FOMC meeting, suggested in recent comments that the need for policy easing is becoming more appropriate. Goolsbee noted that "we set this rate when inflation was over 4%, and inflation is now, let's call it, 2.5%. This implies we have tightened a lot since we've been holding at this rate." Holding the nominal fed funds rate steady while inflation has receded has led to a rise in the real fed funds rate; that is, there has been a passive tightening of monetary policy.
Although we believe it is highly likely the FOMC will remain on hold on July 31, the probability of a rate cut, albeit low, is not zero either. Some of the more “dovish” members of the Committee (e.g., voting members Governors Cook and Kugler, Presidents Daly and Goolsbee, and non-voting member President Harker (Philadelphia)) may argue during the meeting that the FOMC needs to “get ahead of the curve” by cutting rates in July or else risk a significant deterioration in labor market conditions in coming months. That said, we doubt a consensus exists on the Committee at this time to ease policy on July 31. The Committee could head off a potential dissent or two by some of these more dovish voting members by signaling in the post-meeting statement that policy easing is coming into view.
The “blackout period,” during which FOMC members refrain from making public comments, is now underway. So if policy easing at the upcoming FOMC meeting on July 31 really is under active consideration at this time, then policymakers would need to signal in coming days that a rate cut could happen at that meeting. Otherwise, market participants could be surprised, a development the FOMC generally wants to avoid because it believes policy is more effective when the public clearly understands the Fed's intentions. Market participants could be given “heads up” that policy easing will be under active consideration on July 31 via a leak in coming days to a major media organization that is attributed to a “senior Fed official.” We doubt this is likely, but highlight it as a risk given that we believe an important inflection point in monetary policy is drawing near.
Will the November 5 Presidential Election Preclude a Rate Cut on September 18?
If, as we expect, the post-meeting statement on July 31 suggests that the time for policy easing is approaching, attention will naturally shift to the next policy meeting on September 18. Indeed, the rates market is essentially fully priced as of this writing for a 25 bps rate cut at that FOMC meeting. But will the FOMC change policy with the November 5 presidential election looming in the near future?
Chair Powell has repeatedly stressed that the FOMC will not allow political considerations to affect the Committee's decisions regarding monetary policy. For example, Powell said on May 1 that FOMC members were "at peace" with keeping political considerations out of their deliberations. He went on to say “if you go down the road, where do you stop? And so we're not on that road. We're on the road where we're serving all the American people, and making our decisions based on the data and how those data affect the outlook and the balance of risks.” Furthermore, the historical record supports Powell's contention. The word-by-word transcripts of the FOMC meetings that have preceded previous presidential elections show that political consideration generally are not discussed. If, as we forecast, inflationary pressures continue to ease and the labor market softens further, then we believe the FOMC will reduce its target range for the federal funds rate by 25 bps at the September 18 meeting and by another 25 bps on December 18. For further reading on the historical record for FOMC policy decisions in election years, see the special report we published earlier this year, which can be found here.
BoC to Cut Rates Again, What’s Next?
- Bank of Canada to slash rates by 25bps for the second time in a row
- More easing expected, but policymakers might signal a data-dependent approach
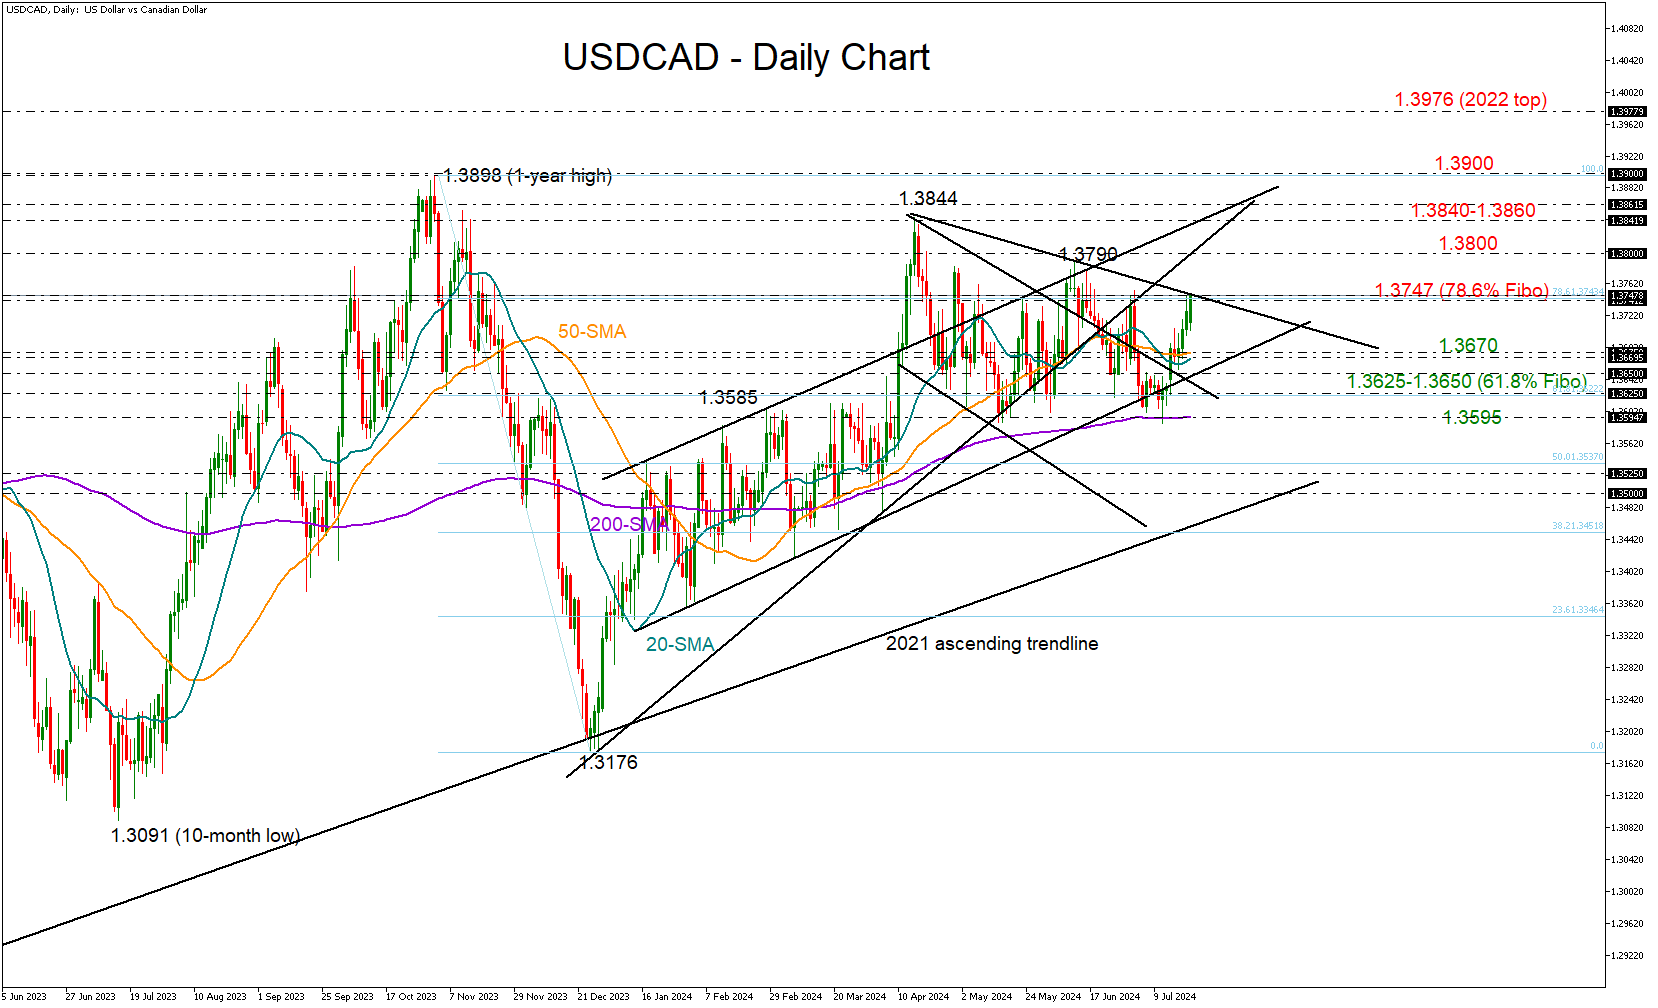
- USDCAD tests key resistance of 1.3740; key support at 1.3620
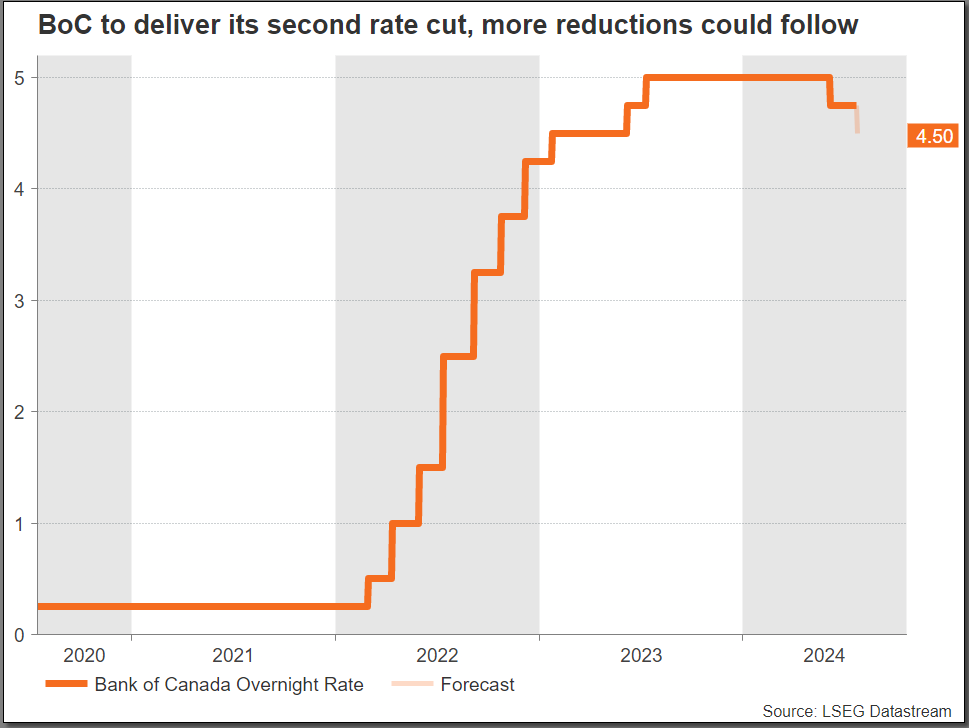
Investors are confident that the Bank of Canada (BoC) will cut interest rates by a quarter percentage point for the second time in a row to 4.5% when it announces its policy decision on Wednesday. If that scenario plays out, the BoC will be ahead of major central banks in the easing cycle. But will the central bank feel comfortable moving forward with further back-to-back reductions given that its major peers are still uncertain?
What led to June’s rate cut?
Back on June 5th, headline inflation displayed the lowest annual change since March 2021, clocking in at 2.7% y/y and within the central bank’s control range of 1-3%. Although that was still higher than the BoC’s 2.0% midpoint target, the core measure, which excluded food, energy, tobacco and mortgage rates, was below that threshold at 1.6%; once mortgage costs are excluded, it’s evident that monetary policy does not need to be so restrictive.
With the unemployment rate climbing to a two-year high and household debt remaining problematic, the BoC did not hesitate to slash its borrowing costs and join its Swedish and Swiss counterparts.
Will there be a second reduction?
The question now is whether a second cut in a row is necessary. In June, inflation slipped back to 2.7% y/y after a pickup to 2.9%, staying below the BoC’s Q2 projection of 3.0%. On the other hand, the core measure climbed to 1.9% but held near the 2.0% midpoint target.
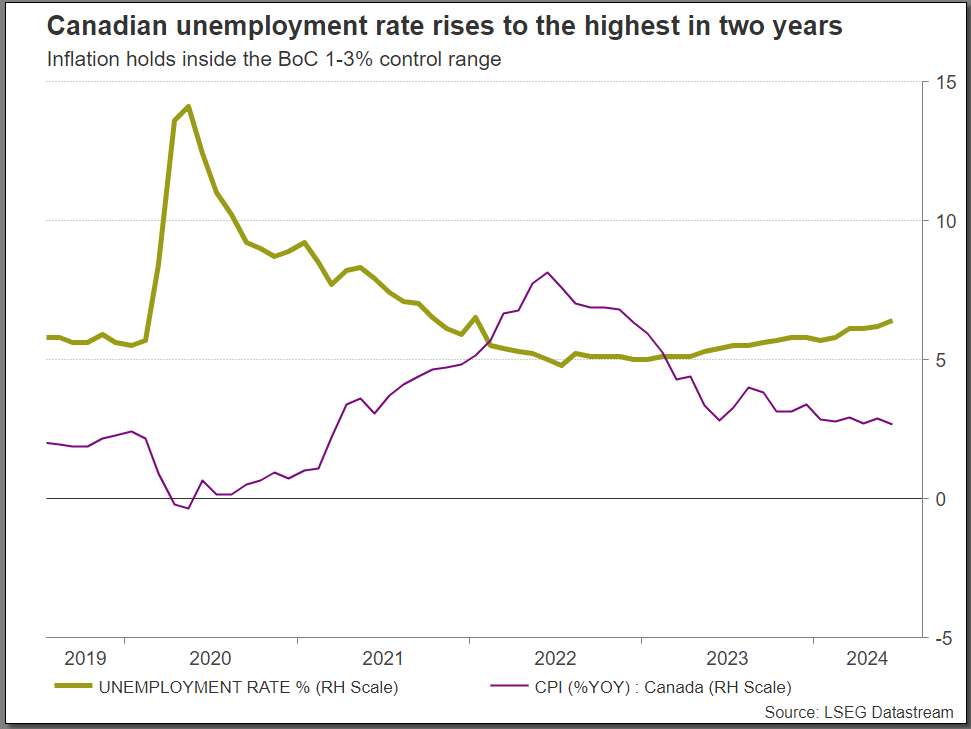
Furthermore, the unemployment rate increased to 6.4% and the central bank’s most recent business survey indicated a decline in sales outlook and weaker expectations for wage growth, alleviating concerns of labor shortages and potential widespread inflation from rising wages. Recall that retail sales have been in the negative region every single month since the start of the year excluding the month of April.
Even though the central bank has not declared victory over inflation yet, the above stats could be enough reasoning for a second rate cut this month. According to futures markets, this is a done deal. Besides, back-to-back rate reductions are common during monetary easing cycles in Canada. Taking this into consideration, investors might shrug off the rate decision and pay more attention to whether there will be additional rate cuts by the end of the year.
How many rate cuts are priced in?
There are three more meetings in September, October and December, and investors foresee at least one rate reduction.
Policy divergence between the US and Canada tends to face limits and it has not exceeded 100bps since the 2007-2009 financial crisis. But with the FOMC expected to step into its easing cycle in September, the BoC may not feel there are any barriers in further lowering its borrowing costs. That said, policymakers might avoid straightforward communication and could instead endorse a data-dependent approach, citing elevated services inflation, and a potential increase in global trade barriers if Trump becomes the next president.
USDCAD outlook
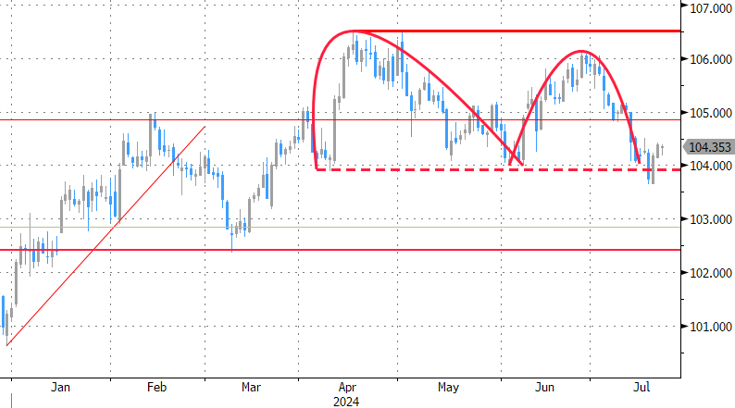
As regards the loonie, it has been on the backfoot against the US dollar lately, completely losing its July wins. A relatively hawkish BoC communication linked to a data-dependent attitude could provide some relief to the currency. In this case, USDCAD could slide towards its 20- and 50-day simple moving averages (SMAs) at 1.3670. A bigger test could come slightly lower at 1.3650, where the 2024 protective trendline is placed. If the 1.3625 zone proves easy to pierce too, the bears could target the flattening 200-day SMA at 1.3595, a break of which would damage the short-term outlook.
In the event the central bank surprises investors with no rate cuts, the pair could experience a steep downfall.
Alternatively, if policymakers feel more confident about their price stability mission, flagging more rate decreases ahead, USDCAD could surpass the wall at 1.3747 to meet the next barrier at 1.3800. Even higher, the pair could stop somewhere between 1.3840 and 1.3860.
PMIs Could Momentarily Take Focus Away from US Developments
- Wednesday's PMI surveys key for both the Fed and the BoE
- Eurozone PMI manufacturing survey could disappoint again
- US PMIs unlikely to unsettle September Fed expectations
- UK figures could surprise on the upside after the general election
Important PMI survey prints this week as both the Fed and the BoE meet soon
Despite last week’s stock market correction and the latest developments in the US Presidential race dominating the headlines, economic data releases this week should attract the market's interest. Both Thursday’s advance US GDP print for the second quarter of 2024 and Friday’s PCE report are expected to have an impact on the market.
On Wednesday, though, the preliminary PMI surveys for July will be published. The importance of these figures cannot be underestimated as the market is trying to predict the likely timing of their next rate moves.
Could the euro area services sector save the day again?
As widely expected, last week’s ECB meeting did not produce any surprises. Rates were kept stable, and President Lagarde appeared moderately balanced with a willingness to advertise the new “no pre-commitment” dogma. The door to a September rate cut remains open, especially if the Fed signals its readiness to start easing its monetary policy stance soon.
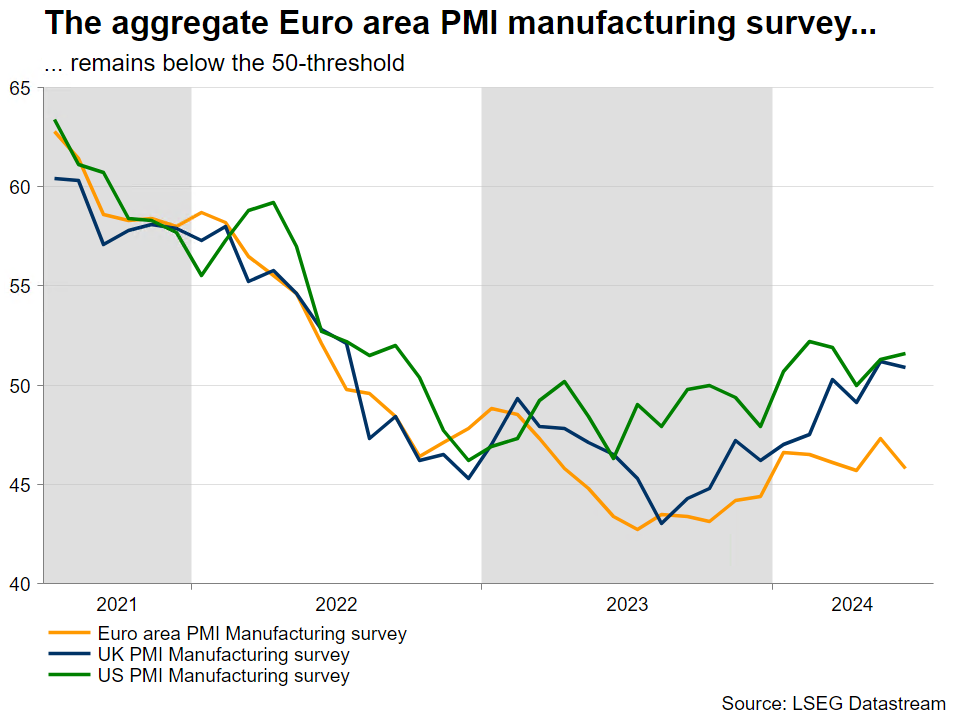
President Lagarde mentioned the PMI surveys during last Thursday’s press conference in order to highlight the divergent dynamics seen in the services and manufacturing sectors and their impact on inflation. The services sector pulled the eurozone out of the recession, and its respective PMI survey continues to hover at levels consistent with soft growth.
The same cannot be said for the smaller manufacturing sector, which has remained stuck below the 50-level for the past two years. The main culprit of this abysmal performance is Germany where the once-mighty manufacturing segment has lost part of its competitiveness edge against other powerhouses due to the lack of cheap Russian energy. Similarly, the French manufacturing sector continues to underperform, which is somewhat expected considering the recent political unrest.
Focusing on Wednesday’s prints, the market expects a small improvement across the board. The eurozone aggregate services indicator should edge higher to 53, while the manufacturing survey is expected to climb to 46.1.
US PMI surveys to give useful information to the Fed
While the Fed’s preferred set of indicators remains the Institute for Supply Management (ISM) indices, going into the July 31 gathering, Fed members will probably have access only to the already-published PMI surveys. And these PMIs accurately depict the economic advantage of the US against the eurozone as the composite PMI survey indicator jumped in June to the highest level since May 2022.
Like the euro area, the services sector is the key growth area of the US economy with the respective PMI services survey climbing to a 2-year high. However, contrary to the eurozone, the PMI survey for the manufacturing sector has recently climbed above the 50-threshold, and it appears to be on a gentle upward trend.
The market is currently forecasting a small pickup in the PMI manufacturing survey but a decent correction in the services one. Confirmation of these figures is unlikely to change the Fed outlook, with the market fully pricing in a 25bps rate cut in September. Actually, weaker data prints could allow the Fed to start cutting rates with a clear conscience, despite the currently elevated inflation rates. The July 31 meeting might prove uneventful, but the Jackson Hole symposium at the end of August could prove pivotal in the current cycle.
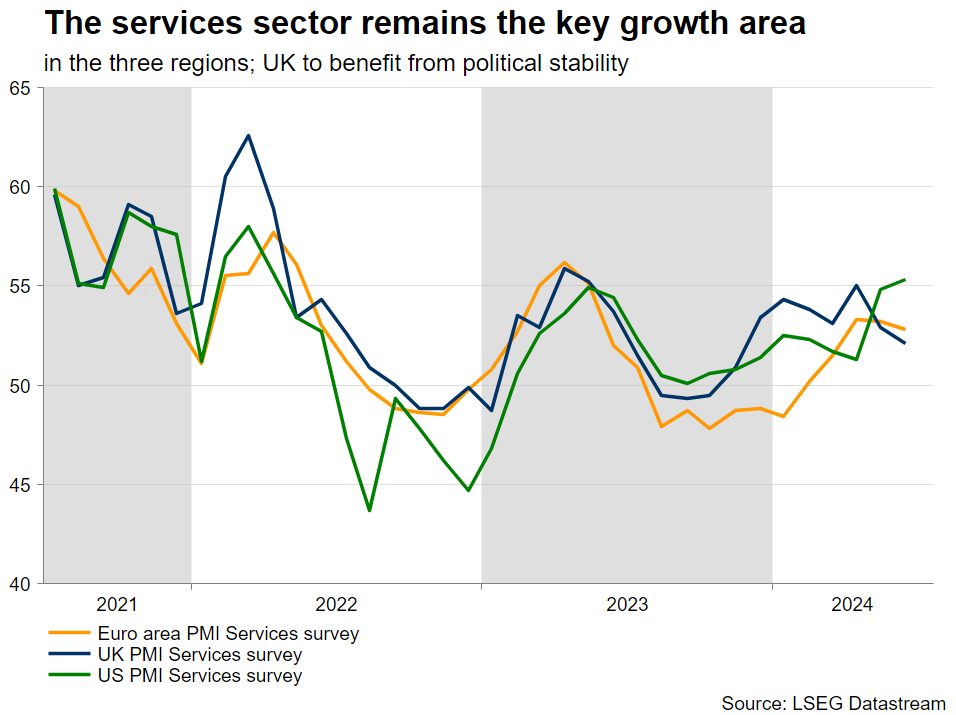
The UK could benefit from political stability
A different picture emerges in the UK where the PMI services survey remains above the 50-threshold, but it has failed to achieve the progress seen in other regions. The recent general election has probably improved sentiment in this sector and hence it will be interesting to see if the recent weakness reversed on Wednesday.
Interestingly, the manufacturing sector has been recovering aggressively from the 2023 trough and has actually returned above the 50 mark in the past two months. This is quite noteworthy considering the very weak prints seen in the eurozone, but the strong UK domestic demand could possibly explain the manufacturing sector’s solid performance.
The market expects a positive set of figures with the services survey climbing to 52.5 and the manufacturing one edging to 51.1. The BoE meets on August 1, the day after the Fed gathering, with the market recently scaling back its expectations for an August rate cut. A strong downside surprise from Wednesday's PMIs could tempt the BoE doves to put a rate cut on the table at the next gathering.
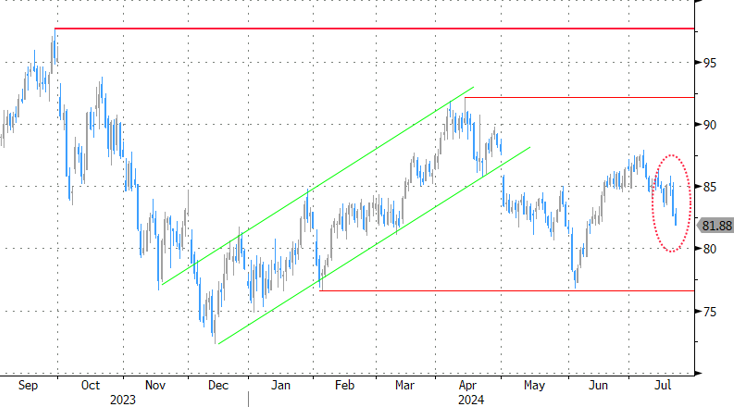
AUD/USD Outlook: Downtrend Extends into Sixth Consecutive Day
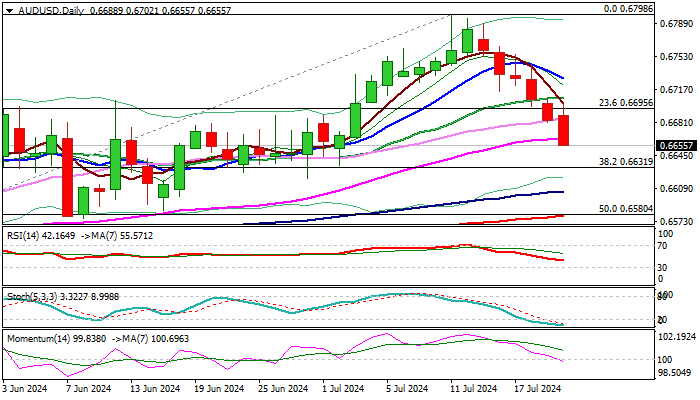
AUDUSD hit three-week low on Monday after recovery attempts overnight were short-lived and bears regained full control.
The pair remains in a steep downtrend for the sixth straight day and retraced so far 61.8% of 0.6575/0.6798 rally.
Last week’s 1.3% fall left large bearish candle (the first week in red after five consecutive weeks of rally) and generated reversal signal on weekly chart.
Weakening daily studies (south-heading 14-d momentum is about to break into negative territory / 10/20/30 MA’s in bearish configuration) favor further downside, as Aussie dollar was hurt by falling copper price and rise in USCNY, following PBOC loan prime rate cut by 10 basis points.
Bears eye next significant supports at 0.6642/31 (top of thick daily cloud / Fibo 38.2% retracement of larger 0.6362/0.6798 uptrend) which are likely to produce strong headwinds, along with oversold daily studies.
Limited upticks should be ideally capped by 20DMA / last Friday’s top (0.6708) to keep bears intact.
Res: 0.6663; 0.6683; 0.6708; 0.6729.
Sup: 0.6642; 0.6631; 0.6605; 0.6580.
Sunset Market Commentary
Markets
Biden’s dropout from the presidential race grabbed most of the headlines today, if only because there was basically no other news to report. He and many other Democrats have endorsed the current runner-up Kamala Harris as the new nominee. What that means for the eventual election outcome and policy is unclear at this stage. Markets behaved accordingly. We’ve seen no such thing as an aggressive repositioning whatsoever. Equity markets showed some of the sharpest moves today following the biggest weekly loss in several month’s time. Technical support areas around 4820-4840 for the EuroStoxx50 (38.2% retracement on the 2024 rally, lower bound of a downward trading range) and 5500 for the S&P 500 (23.6% on the mid-April rally, June interim high) helped as well by living up to the name. Core bond yields looked for and eventually found a bottom end of last week. The front end of the curve both in Europe and the US today extends losses slightly, with Bunds underperforming Treasuries (+3 bps in the 2-yr vs +0.8 bps). Two of the big three on currency markets barely budge, resulting in extremely stoic EUR/USD trading in the high 1.08 zone. The Japanese yen performs best though it did forfeit some of the early gains this (European) morning. USD/JPY trades around 156.8, at least temporarily giving Japanese FX officials some relief. EUR/JPY tested the 170 barrier but no break occurred. Sterling snapped last week’s losing streak, inching marginally higher both against the dollar and the euro. After last week’s British economic update, Wednesday’s July PMI’s are the only release worth mentioning ahead of the Bank of England policy meeting August 1. Policymakers, not least governor Bailey, have been extremely quiet of late, even as the UK elections no longer force them to be. Without clear hints from officials and with the mixed eco update (the inflation/labour market/retail sales numbers respectively topped/matched/missed expectations), markets are almost perfectly 50-50 split on the inaugural rate cut in August. After Wednesday, which has PMI’s in store not only for the UK but also Europe and the US, attention turns to the first Q2 GDP growth estimate for the US on Thursday as well as the June PCE-deflators for the country on Friday.
News & Views
Poland’s June retail sales reported today printed on the softer side of expectations. Real sales (constant prices) rose 0.3 % M/M and 4.4% Y/Y, coming on the back of two months of negative growth in May and April. Positive growth in motor vehicles and parts (3.4%) and fuels (+1.5%) was partially counterbalanced by a monthly decline in most other subcategories. Real sales over the January-June period increased by 4.9% compared to the same period last year. The data suggest a modest recovery in domestic demand. The National bank of Poland (NBP) in its communiqué after the July 2-3 policy meeting still mentioned the risk of demand pressure in the domestic economy due to a marked wage growth. This assessment was confirmed by comments from MPC member Iwona Duda in an interview this weekend. In addition to demand and inflation risks of high wages, Duda indicated that the impact of higher energy prices (removing price caps) on households’ inflation expectations is another reason for the NBP to refrain from policy easing. She expects Polish inflation to be at heightened levels (about 6.0%) at the beginning of next year which only allows the NBP to start discussing interest rate cuts in the second half of next year.
The National Bank of Belgium’s (NBB) monthly consumer confidence indicator fell back in July after markedly improving last month. The NBB saw a worsening of all components of the indicator. Consumer expectations for the general economic situation in Belgium have dropped slightly (-16 from -15). In addition, fears of a rise in unemployment over the next twelve months have sharply intensified (19 from 12), following the clear abatement last month. On a personal level, households are less confident about their own future financial situation (-2 from 1), and less optimistic about their savings intentions over the coming twelve months (16 from 20).
Graphs
DXY: trade-weighted dollar draws no conclusions from Biden’s dropout
US 2-yr yield tries to build on end last week’s recovery, strenghtening the bottom at 4.4% as a solid one
Brent oil ($/b) slips below 200dMA, extending a drop since early July that wiped out almost half of the June gain
EuroStoxx50 kicks off this week with a nice gain after testing support at 4800+ last week
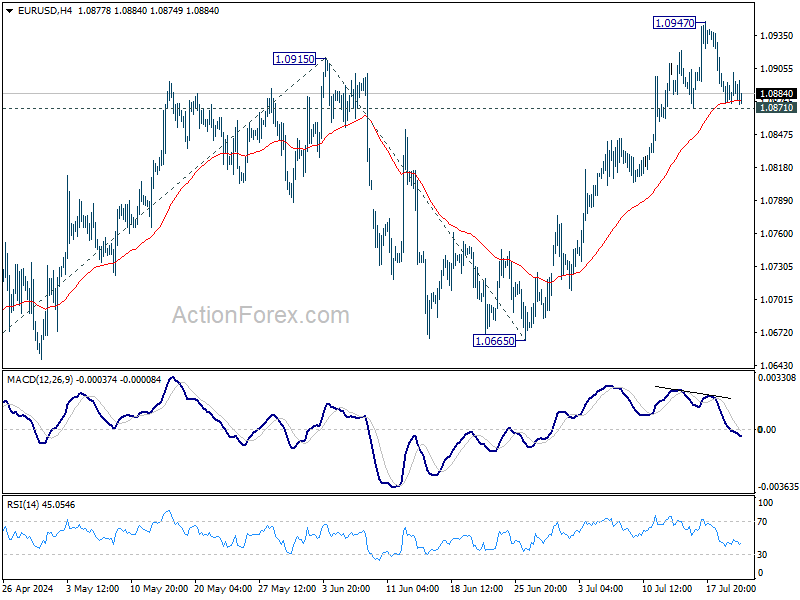
EUR/USD Mid-Day Outlook
Daily Pivots: (S1) 1.0870; (P) 1.0889; (R1) 1.0903; More....
EUR/USD is staying in range below 1.0947 and intraday bias remains neutral. Further rise is in favor as long as 1.0871 minor support holds. Break of 1.0947 will target 100% projection of 1.0601 to 1.0915 from 1.0665 at 1.0979. However, firm break of 1.0871 will turn bias to the downside for deeper fall to 55 D EMA (now at 1.0809) and possibly below.
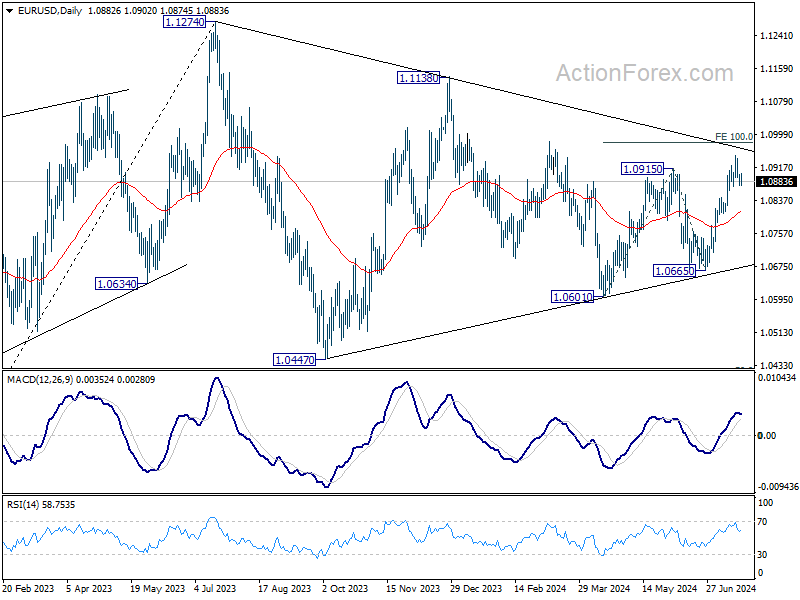
In the bigger picture, price actions from 1.1274 are viewed as a corrective pattern, possibly a triangle, that's still be in progress. Break of 1.1138 resistance will be the first signal that rise from 0.9534 (2022 low) is ready to resume through 1.1274 (2023 high). This will now remain the favored case as long as 1.0601 support holds.
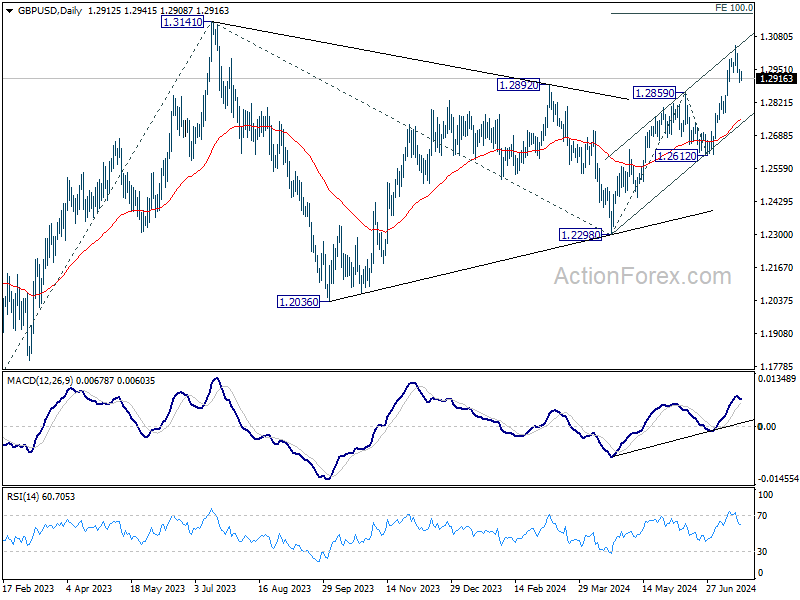
GBP/USD Mid-Day Outlook
Daily Pivots: (S1) 1.2886; (P) 1.2930; (R1) 1.2958; More...
Intraday bias in GBP/USD remains neutral for consolidation below 1.3043. Downside of consolidations should be contained by 1.2859 resistance turned support to bring another rally. Break of 1.3043 will resume the rise from 1.2298 and target 100% projection of 1.2298 to 1.2859 from 1.2612 at 1.3173, which is slightly above 1.3141 key medium term resistance. However, firm break of 1.2859 will turn bias to the downside for deeper decline.
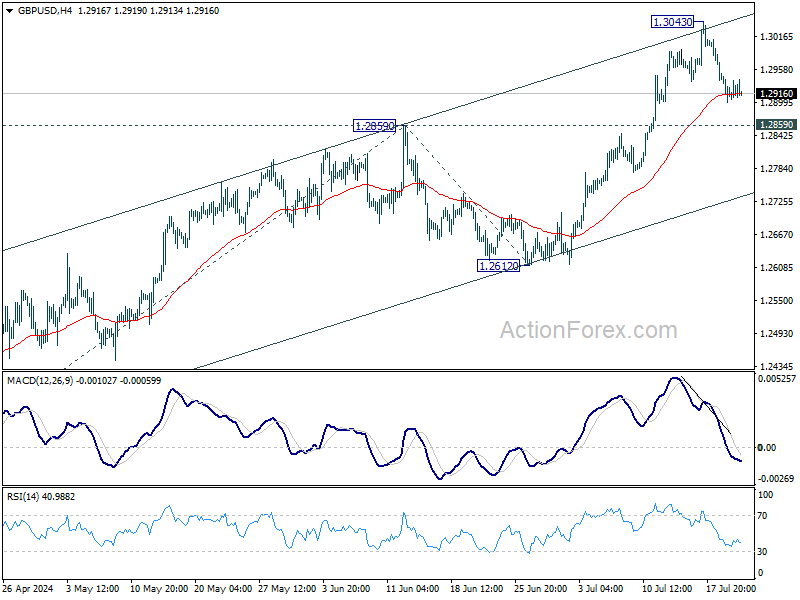
In the bigger picture, corrective pattern from 1.3141 medium term top (2023 high) could have completed with three waves to 1.2298 already. This will now remain the favored case as long as 1.2612 support holds. Firm break of 1.3141 will target 61.8% projection of 1.0351 (2022 low) to 1.3141 from 1.2298 at 1.4022.
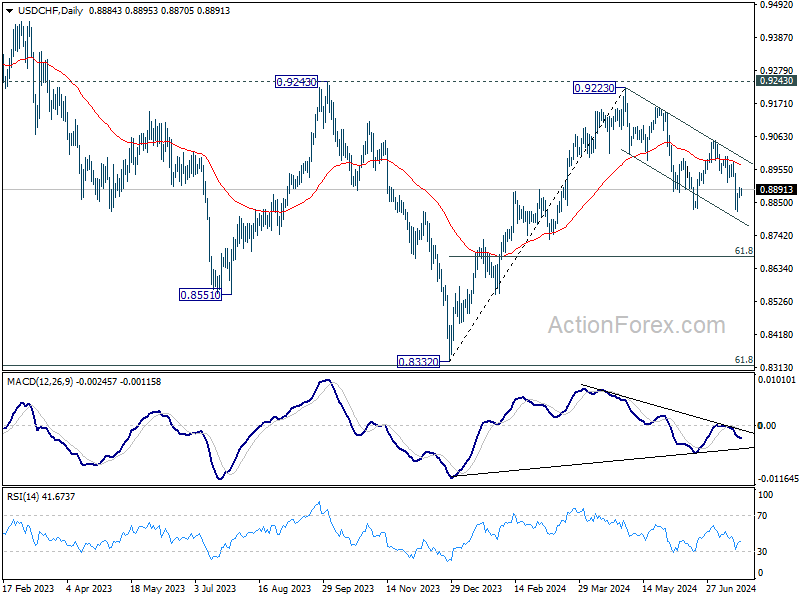
USD/CHF Mid-Day Outlook
Daily Pivots: (S1) 0.8867; (P) 0.8884; (R1) 0.8908; More…
USD/CHF is staying in range above 0.8819 and intraday bias remains neutral. Further decline is in favor as long as 0.8914 support turned resistance holds. Break of 0.8819 will target 61.8% retracement of 0.8332 to 0.9223 at 0.8672 next. However, break of 0.8914 will turn bias back to the upside for stronger rebound instead.
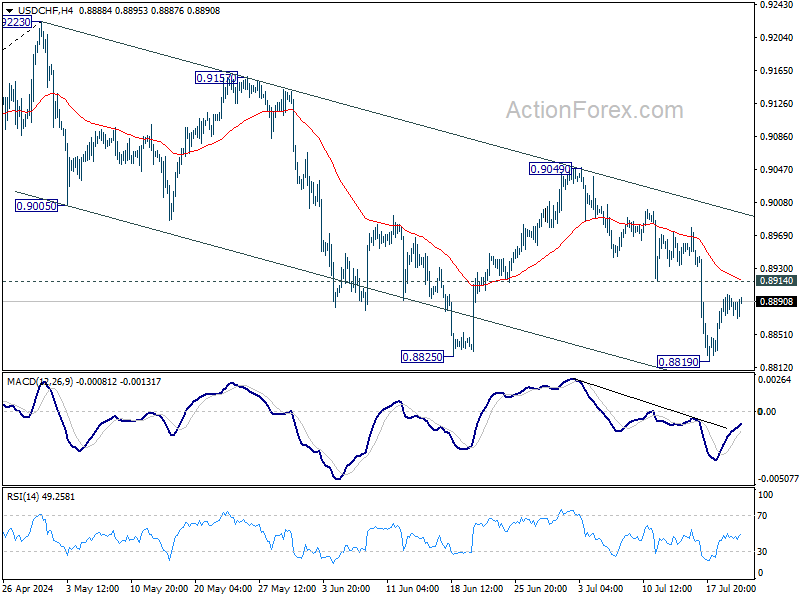
In the bigger picture, with 0.9243 resistance intact, medium term outlook in USD/CHF is neutral at best. For now, more sideway trading is likely between 0.8332/9243. However, firm break of 0.9243 will indicate larger bullish trend reversal.