Sample Category Title
Dollar Strengthens as DOW Plunges; Yen Struggles to Extend Rally
Dollar rebounded broadly overnight following steep 500+ point selloff in DOW. Some analysts cited rotation away from big tech as the cause, but the decline was broad-based. Profit-taking could be a more likely factor after recent record runs, as traders and Fed policymakers await more data to determine the number of rate cuts needed this year.
Yen is struggling to extend near-term gains after slightly lower-than-expected core CPI data. Although inflation has accelerated, it is not strong enough to warrant a rate hike by BoJ later this month. The government's new forecasts suggest that Yen will average around 158.8 against Dollar. This argues that USD/JPY could be allowed to fluctuate around 159 without triggering intervention from Japanese authorities.
For the week, Swiss Franc remains the strongest performer, followed by Yen and then Dollar. New Zealand Dollar is staying as the weakest, followed by Australian Dollar and then Canadian Dollar. Euro and the pound continue to struggle in the middle.
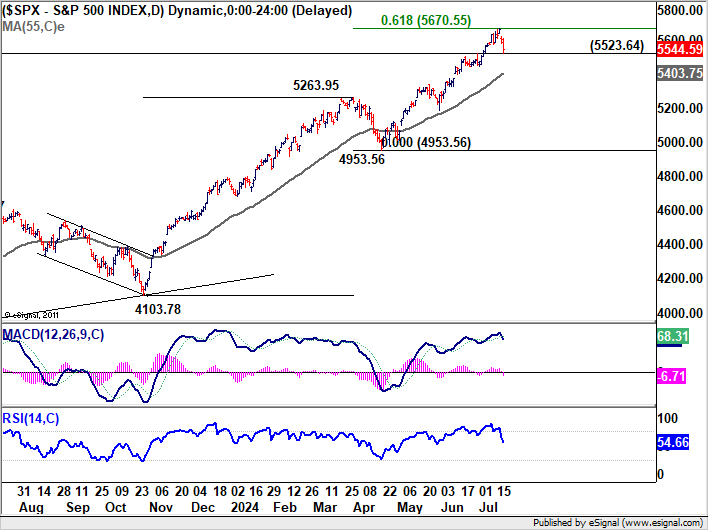
Technically, S&P 500 is now pressing 5523.64 support with the steep decline in the past two days. Firm break there would confirm short term topping after just missing 61.8% projection of 4103.78 to 5263.95 from 4953.56 at 5670.55. Deeper pullback could then be seen back to 55 D EMA now at 5403.75. IN this bearish case, risk aversion could provide Dollar with some support.
In Asia, at the time of writing, Nikkei is down -0.22%. Hong Kong HSI is up 0.22%. China Shanghai SSE is down -0.08%. Singapore Strait Times is down -0.81%. Japan 10-year JGB yield is up 0.0102 at 1.042. Overnight, DOW fell sharply by -1.29%. S&P 500 fell -0.78%. NASDAQ fell -0.70%. 10-year yield rose 0.043 to 4.189.
Japan's CPI core rises to 2.6%, above target for 27th month
Japan's core CPI, which excludes food prices, rose from 2.5% yoy to 2.6% yoy in June, slightly missing expectations of 2.7% yoy. This nonetheless marks the 27th consecutive month that inflation has been at or above BoJ's 2% target. Core-core CPI, which excludes both food and energy, increased from 2.1% yoy to 2.2% yoy, while headline CPI as unchanged at 2.8% yoy.
Services inflation saw a modest increase from 1.6% yoy to 1.7% yoy. A reduction in government subsidies aimed at curbing utility bills resulted in a 7.7% yoy rise in energy costs, up from 7.2% increase seen in May.
Attention is now shifting to BoJ's upcoming meeting on July 30-31. There is divided opinion on whether BoJ will decide to hike the policy rate from the current 0.00-0.10% range to 0.15-0.25%. The central bank is also expected to unveil a roadmap for reducing its bond purchases and release its economic outlook report, which will publish new economic forecasts.
Japan downgrades fiscal 2024 growth forecast amid consumption struggles
Japan's government has downgraded its growth forecast for the current fiscal year 2024 from 1.3% to 0.9%.
This adjustment comes as inflation continues to impact private consumption, which accounts for over half of the economy. Private consumption growth is now expected to be just 0.5%, a significant drop from the January forecast of 1.2%.
Various one-off factors, including safety test scandals in the auto industry, have also contributed to this downgrade.
However, the economy is expected to rebound in fiscal 2025 with a growth rate of 1.2%.
Consumer prices are now forecast to rise by 2.8% in fiscal 2024, an increase from the earlier expectation of 2.5%.
The government has also adjusted its assumption for Yen, now expecting it to remain around 158.8 per Dollar for the current fiscal year, weaker than the previous estimate of 149.8 Yen.
Fed's Daly advocates for patience as "we're not there yet"
San Francisco Fed President Mary Daly commented at an event overnight, emphasizing that the US has not yet achieved price stability. While acknowledging recent positive inflation data, Daly noted, "We're not there yet."
Daly highlighted the delicate balancing act facing monetary policy. She called for patience, urging policymakers to "balance the costs of acting fast and being wrong."
"It's a risk to act too soon to normalize interest rates and then have inflation stuck below or above our target, and it's a risk to hold on too long and make the labor market falter," Daly elaborated.
Looking ahead
UK retail sales and publis sector net borrowing, an Eurozone current account will be released in European session. Later in the day, Canada will publish retail sales, IPPI and RMPI.
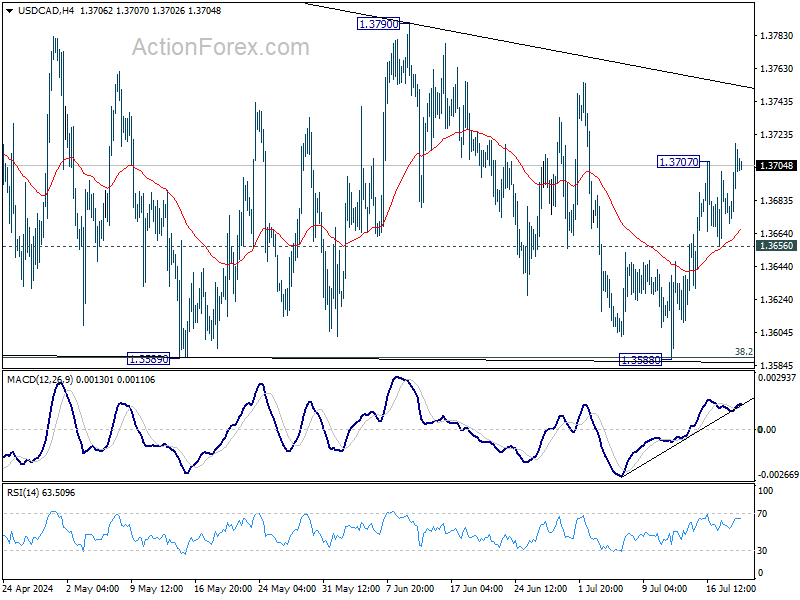
USD/CAD Daily Outlook
Daily Pivots: (S1) 1.3678; (P) 1.3698; (R1) 1.3727; More...
USD/CAD's rebound from 1.3588 resumed by breaking 1.3707 temporary top and intraday bias back on the upside. Outlook is unchanged that corrective pattern from 1.3845 might have completed with three waves to 1.3588, after hitting 38.2% retracement of 1.3716 to 1.3845 at 1.3589 twice. Further rise is expected to 1.3790 resistance first. Break there will larger rise from 1.3716 is ready to resume through 1.3845.
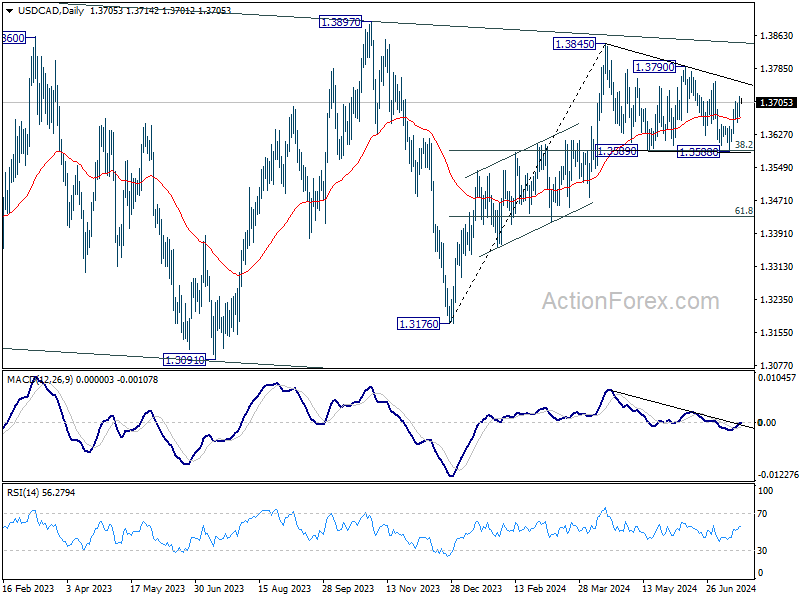
In the bigger picture, price actions from 1.3976 (2022 high) are viewed as a corrective pattern. In case of another fall, strong support should emerge above 1.2947 resistance turned support to bring rebound. Firm break of 1.3976 will confirm up resumption of whole up trend from 1.2005 (2021 low). Next target is 61.8% projection of 1.2401 to 1.3976 from 1.3176 at 1.4149.
Economic Indicators Update
| GMT | Ccy | Events | Actual | Forecast | Previous | Revised |
|---|---|---|---|---|---|---|
| 23:01 | GBP | GfK Consumer Confidence Jul | -13 | -11 | -14 | |
| 23:30 | JPY | National CPI Y/Y Jun | 2.80% | 2.80% | ||
| 23:30 | JPY | National CPI Core Y/Y Jun | 2.60% | 2.70% | 2.50% | |
| 23:30 | JPY | National CPI Core-Core Y/Y Jun | 2.20% | 2.10% | ||
| 06:00 | GBP | Retail Sales M/M Jun | -0.60% | 2.90% | ||
| 06:00 | EUR | Germany PPI M/M Jun | 0.10% | 0.00% | ||
| 06:00 | EUR | Germany PPI Y/Y Jun | -1.60% | -2.20% | ||
| 06:00 | GBP | Public Sector Net Borrowing (GBP) Jun | 12.0B | 14.1B | ||
| 08:00 | EUR | Eurozone Current Account (EUR) May | 34.6B | 38.6B | ||
| 12:30 | CAD | Industrial Product Price M/M Jun | 0.20% | 0.00% | ||
| 12:30 | CAD | Raw Material Price Index Jun | -0.70% | -1.00% | ||
| 12:30 | CAD | Retail Sales M/M May | -0.20% | 0.70% | ||
| 12:30 | CAD | Retail Sales ex Autos M/M May | 1.20% | 1.80% |
Japan downgrades fiscal 2024 growth forecast amid consumption struggles
Japan's government has downgraded its growth forecast for the current fiscal year 2024 from 1.3% to 0.9%.
This adjustment comes as inflation continues to impact private consumption, which accounts for over half of the economy. Private consumption growth is now expected to be just 0.5%, a significant drop from the January forecast of 1.2%.
Various one-off factors, including safety test scandals in the auto industry, have also contributed to this downgrade.
However, the economy is expected to rebound in fiscal 2025 with a growth rate of 1.2%.
Consumer prices are now forecast to rise by 2.8% in fiscal 2024, an increase from the earlier expectation of 2.5%.
The government has also adjusted its assumption for Yen, now expecting it to remain around 158.8 per Dollar for the current fiscal year, weaker than the previous estimate of 149.8 Yen.
China Set To Miss Annual Growth Target
And The Third Plenum Suggests No Major Economic Model Adjustments
Summary
Recent GDP and activity data from China were underwhelming, and as a result, we have revised our 2024 annual GDP growth forecast lower. With activity sluggish and price pressures still subdued we reiterate our view that the People's Bank of China (PBoC) will ease monetary policy again in the coming months and over the course of 2025. Lower interest rates have been a source of renminbi depreciation; however, policymakers have mounted an effective defense of the currency as appetite for a weaker currency seems limited. Longer-term, we remain optimistic on the prospects for the renminbi despite underwhelming initial takeaways from China's Third Plenum.
Revising Down Our China GDP Growth Forecast
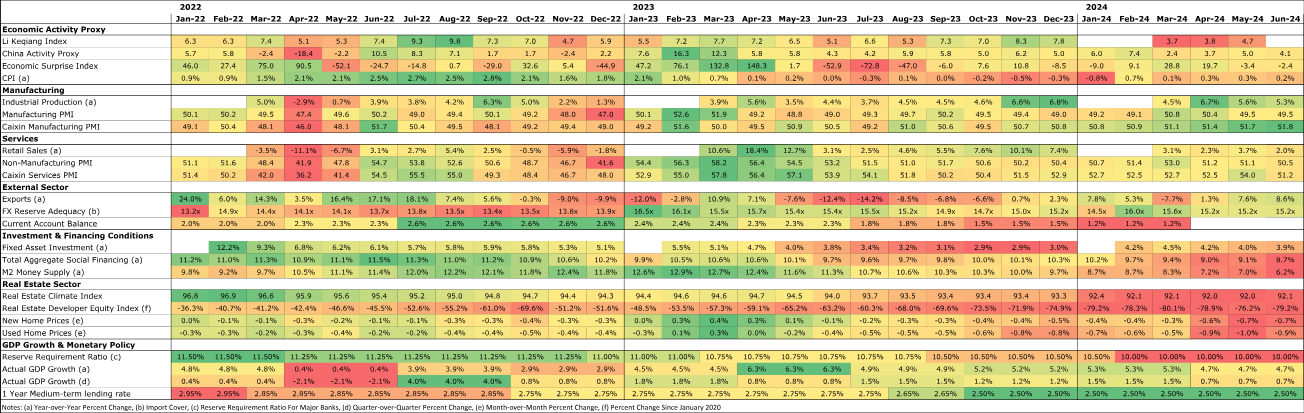
Following relatively steady activity over the course of the first few months of this year, China's economy has since demonstrated a renewed downturn. Most sentiment and activity indicators have tailed-off during the last few months, ultimately culminating in a recent GDP print that was nothing short of underwhelming. In Q2-2024, China's economy grew 4.7% year-on-year—well below our forecast as well as consensus expectations—and a notable slowdown relative to Q1. At first glance, weak domestic consumption seems to be the primary driver of China's softening economic momentum. Retail sales were especially weak in June, but missed expectations for most of the second quarter. Persistent subdued inflation/disinflation pressures, a real estate sector that remains in correction, as well as household preferences to save, all contribute to a local backdrop that is not conducive to spending. China's recent economic slowdown may be driven by soft consumption, although pockets of weakness exist outside of consumption (Figure 1). China's manufacturing sector remains in contraction territory, while capital formation and conditions for inbound investment also appear to be sluggish and restraining overall economic growth. Exports have been supported recently; however, we continue to believe China is gradually becoming a less integral part of the global supply chain. Over time, China being replaced as the manufacturer to the world can challenge China's export-led economic model over the medium-to-longer term. Incorporating recent GDP data into our forecast profile for China's economy leads us to downwardly revise our 2024 annual growth forecast. To that point, we now forecast China's economy to grow 4.8% this year, down from 5.1% before the latest data releases. Given the sheer size and importance of China to the global economy, all else equal, this downward revision will also have negative implications for our global GDP forecast.
PBoC Unrelenting on Monetary Easing & FX Defense
With Chinese growth shifting back to an uninspiring direction, we continue to believe the People's Bank of China (PBoC) will regularly ease monetary policy over the course of our forecast horizon. In that sense, we maintain our view that PBoC policymakers will lower the “major bank” Reserve Requirement Ratio (RRR) again in Q3-2024. As of now, the RRR for major domestic banks is 10.00%. In our view, the combination of sluggish economic growth and subdued price pressures offers enough rationale for Chinese authorities to deliver another 50 bps reduction in the RRR in the coming months. Longer-term, we believe China's growth and inflation dynamics will remain subdued. Under that assumption, we believe additional RRR cuts are likely to be delivered over the course of next year as well. To that point, given our less-than-robust outlook for Chinese activity and price growth, we reiterate our forecast for 100 bps of RRR cuts over the course of 2025, taking the major banks RRR to 8.50% by the end of next year. Worth noting, is that we believe PBoC policymakers will seek to ease monetary policy irrespective of other policy decisions from major central banks. While we believe institutions such as the Federal Reserve will lower interest rates this year and in 2025, the “higher for longer” theme has not completely dissipated. Many emerging markets central banks, at least historically, have taken monetary policy cues from the Fed and adjusted policy rates taking into account FOMC decisions. However, regardless of whether the Fed keeps interest rates unchanged for an extended period of time or delivers cuts along the contours of our forecast, we believe PBoC policymakers will operate with a degree of autonomy and primarily respond to the evolution of domestic activity and price pressures, rather than the direction of interest rates in the United States.
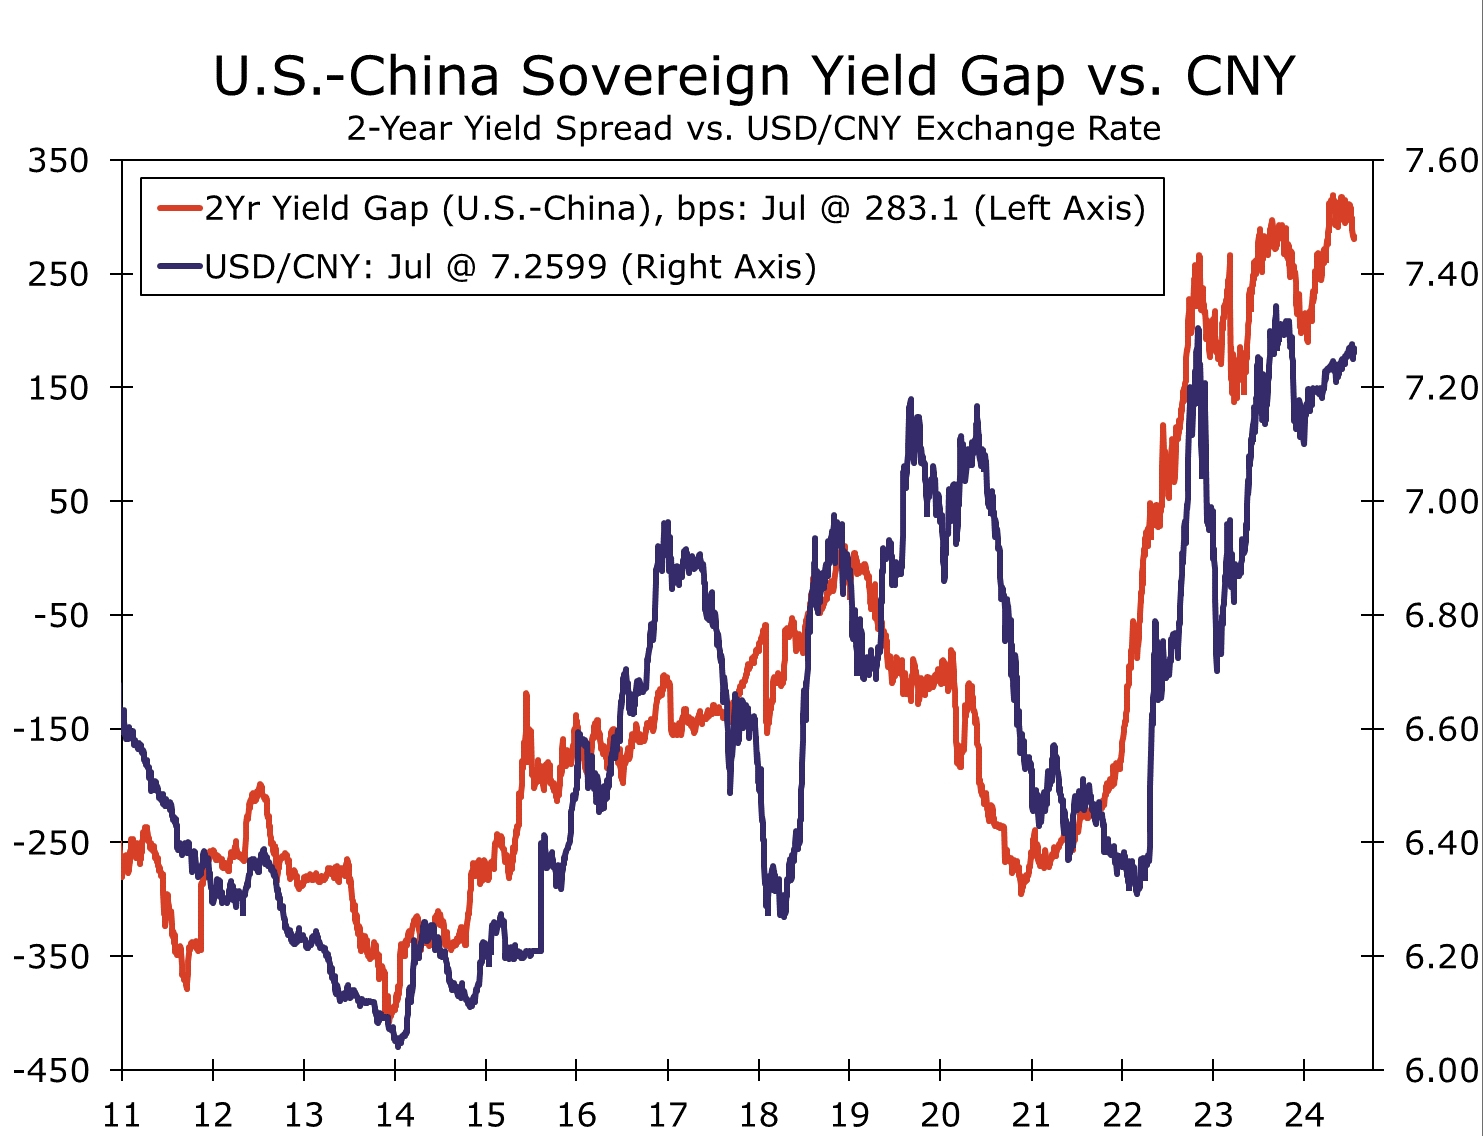
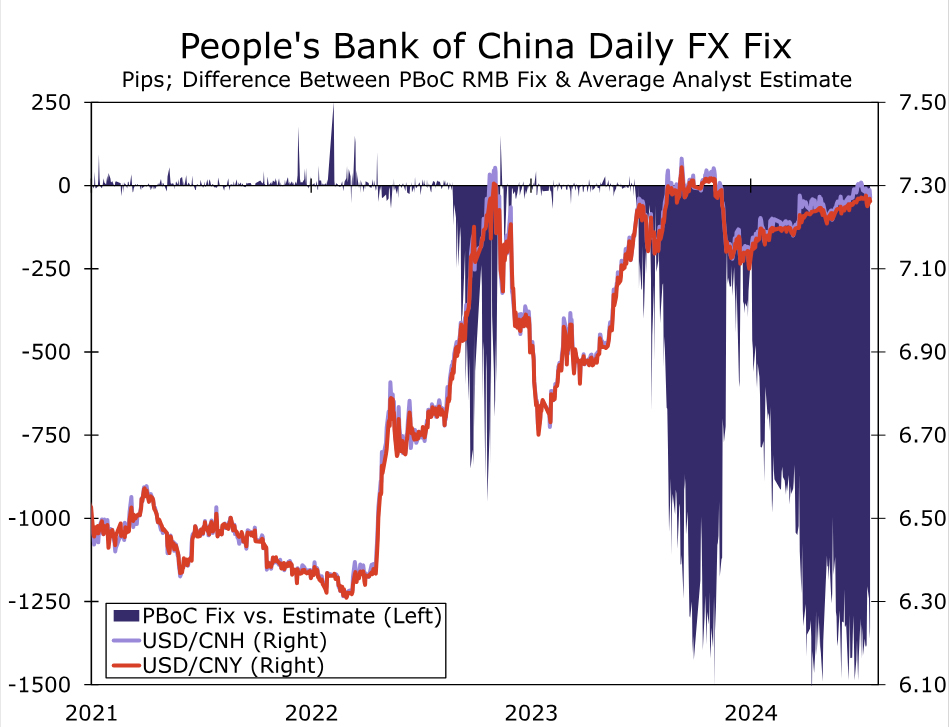
In fairness, PBoC policymakers have determined monetary policy settings notwithstanding the Fed for years. As the Fed pursued tighter monetary policy to contain inflation in early 2022, PBoC policymakers were lowering interest rates in an effort to support economic activity and generate inflation. Diverging paths for Fed-PBoC monetary policy have been the primary source of a weaker Chinese currency over the last few years. Widening interest rate differentials between the Fed and PBoC drove the USD/CNY exchange rate to a peak of ~CNY7.35, from ~CNY6.30 when the Fed started its latest rate hike cycle (Figure 2). While interest rate differentials suggest the renminbi could be even weaker, PBoC policymakers have utilized their FX toolkit effectively to mount an impressive defense of the Chinese currency. Central bankers continue to use the overnight renminbi fix as primary means to defend the value of the renminbi, opting to set a stronger fix relative to market expectations, a signal we interpret as policymakers having limited appetite for a weaker yuan at the current juncture (Figure 3). In our view, policymakers will continue to use FX policy tools at their disposal to limit renminbi volatility and further protect against any significant currency depreciation for the time being. We believe the overnight fix will continue to act as the first line of defense, although authorities have also turned to verbal intervention as a way to deter FX speculators from allocating capital toward a weaker renminbi. Verbal intervention along with the daily fix should be enough to keep the renminbi steady for the time being, and while more of a tertiary option, the PBoC also has a war chest of FX reserves it could draw on to prevent FX weakness if need be.
Longer-term, we are more constructive on the Chinese currency. While we are not necessarily optimistic on the outlook for China's economy, we do believe the same interest rate differentials that have weighed on the renminbi could act as a source of longer-term strength for the currency. As mentioned, we believe the Federal Reserve will deliver rate cuts starting in September and continue easing through the end of 2025. Even as the PBoC delivers easier monetary policy, Fed rate cuts can at least keep current interest rate differentials steady rather than widening. In fact, our core view for the long-term path of the U.S. dollar is that Fed rate cuts apply depreciation pressures broadly to the U.S. dollar. Even more, we believe accommodative Fed policy could drive easier global financial conditions, which can reduce demand for safe haven currencies such as the U.S. dollar and boost foreign currencies, including the renminbi. Dollar depreciation, in our view, can push the renminbi back below CNH7.20 by the end of 2025. We do, however, acknowledge that risks to our long-term, as well as shorter-term, renminbi forecasts are tilted toward less Chinese currency strength. Those risks stem from the U.S. election and the rising possibility of the implementation of a more adverse policy mix toward China. Regardless of the outcome of the election, trade policy toward China could turn more hostile; however, in a second Trump administration, trade policy could turn severely more antagonistic. Former President Trump has floated the possibility of a 60%, or even 100%, tariff on all Chinese exports to the United States. Not only would tariffs apply another source of pressure on China's economy, but would likely also damage sentiment toward local Chinese financial markets and the renminbi. Should tariffs indeed be raised and China's economy indeed be damaged through reduced exports and weak sentiment, PBoC policymakers could accommodate renminbi depreciation to offset economic pressures. For the time being, this scenario represents a downside risk. We are not incorporating any U.S.-political induced renminbi depreciation into our base case FX forecasts, nor our outlook for the Chinese economy.
As Expected, The Third Plenum Underwhelms
Also of note and worth highlighting is that China hosted its every-five-year Third Plenum this week. At select times in the past, Chinese authorities have used the Third Plenum to alter the strategic direction of China's economy, specifically attempting to integrate China more into the global economy and opening up to Western nations. However, while Third Plenum meetings capture market attention and have been used as an agent for change in the past, Third Plenums more often fail to live up to expectations or serve as a platform for major change to the longer-term vision of China's economy. In our view, the 2024 Third Plenum, up to this point, seemingly follows this trend. While more robust details are likely still forthcoming, we interpret the initial communique as the Third Plenum failing to deliver anything especially meaningful that would suggest changes to the longer-term direction for the Chinese economy. The communique refers to China's, and President Xi's, ambition for “high quality growth” rather than the overall growth rate of China's economy. As far as “high quality growth”, Chinese authorities seem to still be focused on manufacturing capabilities and production in high-tech sectors. We view the focus on manufacturing—as opposed to an attempt to reposition China as a domestic demand driven economy—as also rather underwhelming. As mentioned, China's geopolitical ambitions are already resulting in fewer export destinations for locally produced goods. Maintaining an export driven economic model, in our view, is likely to keep downward pressure on China's growth rate and also possibly even act as a roadblock to achieving “high quality” growth.
While the Third Plenum is not typically a forum for fiscal stimulus discussions nor decisions, the dire state of China's property sector was not forcefully addressed in the first communique. Since the Global Financial Crisis in 2008-2009, China has often relied on infrastructure spending and property development to fuel economic growth. In recent years, the property sector has been in significant decline and has raised the likelihood of a China “hard landing” financial crisis scenario unfolding. Perhaps a more strategic plan or fiscal stimulus for China's property sector will be announced in the coming days, but with China's fiscal deficit and debt burden in troubling shape, as well as a desire for export-driven growth, we have our doubts a meaningful policy response will be delivered to address China's real estate sector issues. The initial statement touched on, but offered little detail, into China's geopolitical ambitions, specifically related to Taiwan. Third Plenum meetings are designed to outline the medium-term economic plan, but with focus on geopolitics ramping up over the years, foreign relations could grab a bit more focus relative to prior meetings. When, or if, more details on discussions are released, we will be paying attention to any references to geopolitics, military capabilities and/or Taiwan. We have noted in prior publications that 2024-2027 is a timeframe where geopolitical event risks are elevated. A more hostile approach to Taiwan or reunification attempt is unlikely by 2027, but perhaps details from recent economic discussions can offer insight into Xi's and the broader CCP's geopolitical thinking.
Stagflation from Higher Tariffs: 1970s Redux?
Summary
- President Biden recently hiked tariffs on $18 billion worth of imports from China, and former President Trump has vowed to implement a 60% tariff on China and an across-the-board 10% tariff on other trading partners should he return to the White House in 2025. What effects would these tariff increases have on the U.S. economy?
- Using a large macroeconomic model, we analyze four scenarios. The "baseline" scenario, in which tariffs are not raised, traces out the path of the economy from 2025 through 2029. We impose a 50% tariff on $18 billion worth of Chinese imports under the "Biden" scenario. In the "Trump" scenario we impose a 60% tariff on imports from China and an across-the-board 10% tariff on other trading partners. In the fourth scenario, we repeat the analysis of the "Trump" scenario but assume that foreign economies retaliate with their own 10% tariff on imports of American-made products.
- The "Biden" scenario is essentially the same as baseline because tariffs on only $18 billion of Chinese imports simply do not move the needle in a $28 trillion economy. Under the "Trump" scenario, GDP growth downshifts significantly in 2025 relative to baseline, which causes the unemployment rate to rise half a percentage point more. Inflation is higher in 2025 under the "Trump" scenario relative to the baseline. If foreign countries retaliate with their own levies, then our projections show that U.S. GDP would contract next year and the jobless rate would move even higher.
- The growth-reducing effects of the tariffs arise from their effects on the Consumer Price Index. Higher prices erode growth in real income, which leads to slower growth in real consumer spending. Monetary policy easing helps to cushion the blow to the real economy from the tariffs. That said, Fed policymakers may place greater weight on deviations of inflation from target than the model assumes. If so, real GDP growth could slow more and the jobless rate could rise higher than our simulation results suggest.
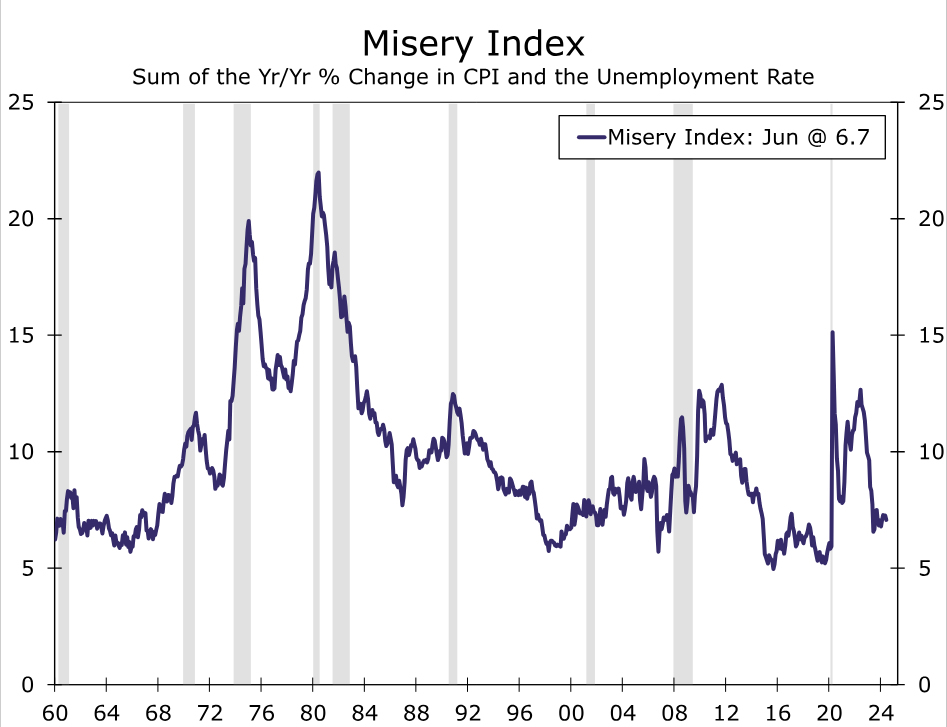
- The so-called "Misery Index," which is the sum of the CPI inflation rate and the unemployment rate, rose from 9% in 1972 to more than 20% in 1980 due to the oil price shocks of the 1970s. The unemployment rate and the inflation rate would both increase if tariffs rise meaningfully, but the sum of these two variables likely would remain well-below the highs that were reached in the late 70s/early 80s. In short, tariff increases would impart a modest stagflationary shock to the economy.
American Political Economy: Turning Away from Free Trade
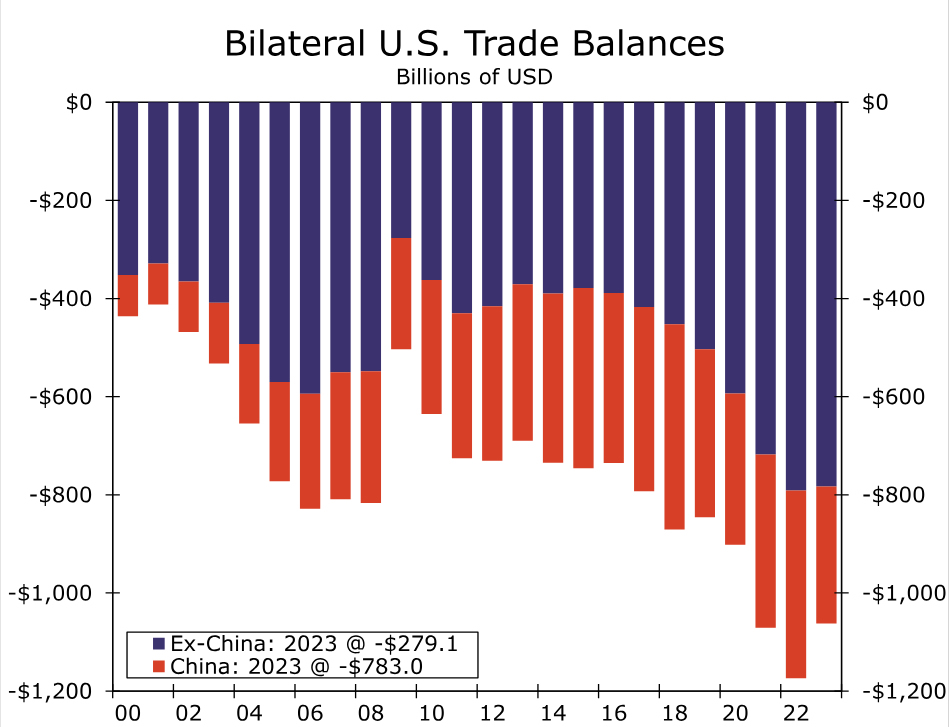
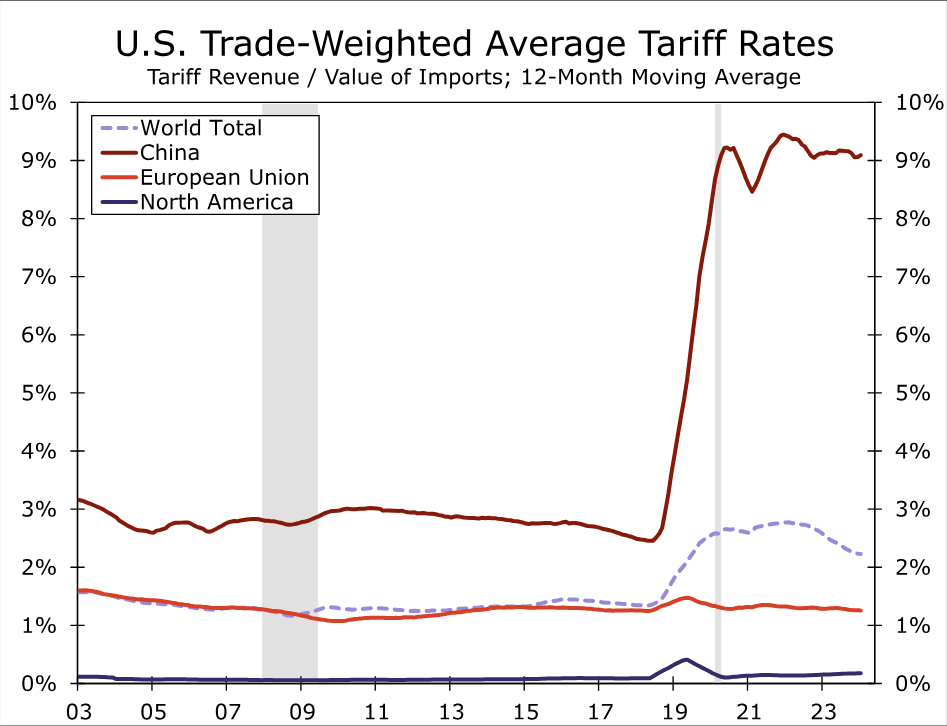
International trade issues, which were largely absent from the U.S. political economy in the early years of the 21st century, have come to play a more important role in recent years. America's persistent trade deficits, especially the large bilateral deficit with China, have served as the backdrop for the renewed attention to international trade issues (Figure 1). Moreover, the loss of nearly six million manufacturing jobs in the first decade of the current century, which some observers associated with a flood of imports, also stoked public consciousness of trade policy issues. President Trump raised tariffs on many of America's trading partners starting in 2018. The effective tariff rate on imports from China, which had been less than 3%, jumped to about 9% (Figure 2).
President Biden subsequently rescinded the Trump tariffs on non-Chinese trading partners, but he largely kept in place the existing tariffs on Chinese goods. More recently, the president announced on May 14 that he was raising tariffs on roughly $18 billion worth of imports from China. The affected products include steel and aluminum, semiconductors, electric vehicles, batteries, solar cells, ship-to-shore cranes and some medical products. The new tariff rates on these products range from 25% to 100%. Should former President Trump regain the White House in this year's presidential election, he has vowed to enact an across-the-board 10% tariff on all imports and would raise the tariff rate on Chinese imports to 60%. What impact will the new tariffs announced by President Biden, and the threatened ones by former President Trump, have on the U.S. economy?
Tariffs Would Lead to Slower Growth in 2025 and Higher Unemployment
Using a large macroeconometric model, we consider four different scenarios. The first scenario is the baseline forecast under the assumption of no new tariffs. In the second scenario, which we label "Biden," we consider the effect of a 50% tariff on $18 billion worth of Chinese imports.1 We shock the model with the new tariffs starting in Q3-2024 and hold them at their higher rates through 2029 (the end of the model's forecast period). Under the "Trump" scenario, we analyze the effects of a 60% tariff on the total value of Chinese imports and a 10% tariff on America's other trading partners beginning in 2025.2 In the fourth scenario, which we label "Trump + retaliation," we repeat the analysis of the third scenario but add a 10% retaliatory tariff on U.S. exports to America's trading partners. Considering that many foreign economies levied their own tariffs on American products in 2018 and 2019, prospects of retaliatory tariffs by trading partners in future years, should the United States announce its own levies, are not unrealistic.
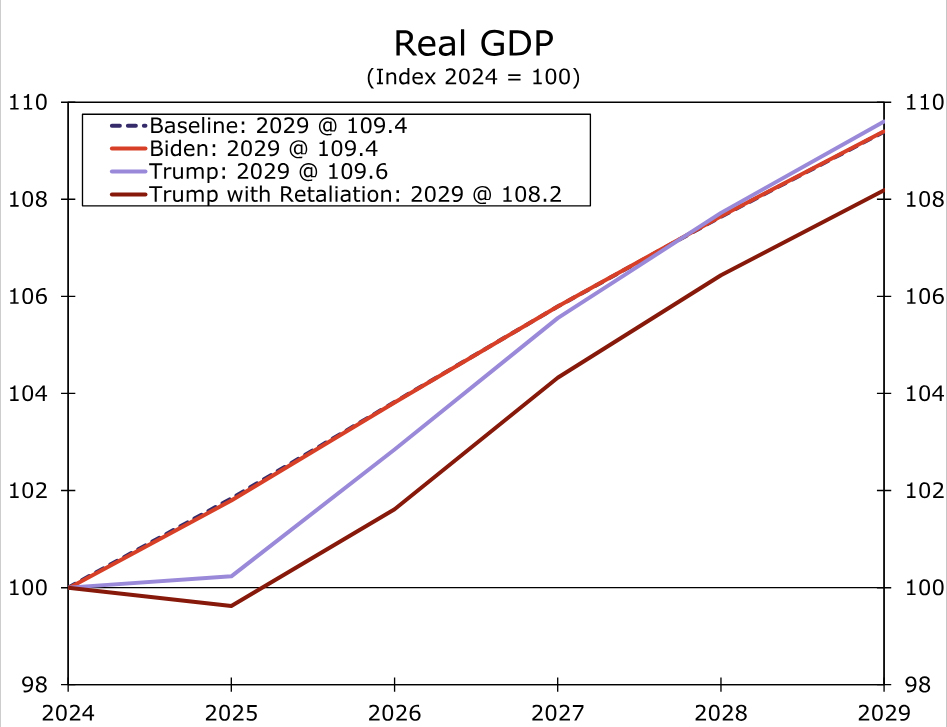
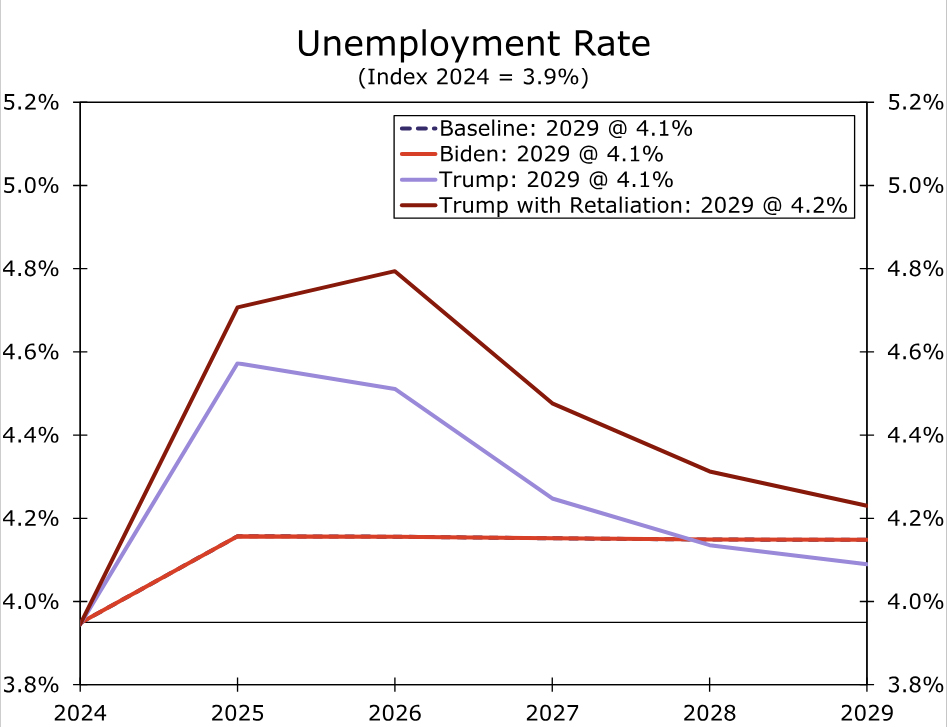
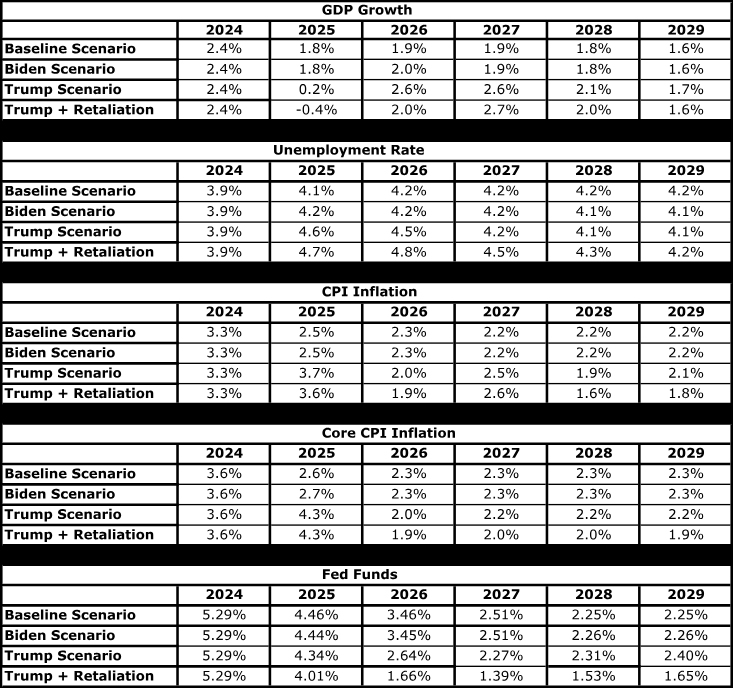
The effects of the different scenarios on the level of real GDP and the unemployment rate are shown in Figure 3 and Figure 4, respectively. (Full numerical results are shown in the appendix.) Under the baseline scenario (i.e., no tariff increases), real GDP rises by a cumulative amount in excess of 9% between 2024 and 2029. The unemployment rate edges up to 4.2% by 2026, and then stays at that rate through the end of the forecast period. The "Biden" scenario is essentially identical to the baseline scenario because the recently announced tariff increases are levied on only $18 billion of Chinese imports. With American imports of goods totaling roughly $3 trillion in 2023 and with the U.S. economy producing roughly $28 trillion of nominal GDP last year, tariffs on only $18 billion of imports simply do not have a marked effect on major U.S. macroeconomic variables.
Under the "Trump" scenario (i.e., 60% tariffs on China, 10% tariffs on the rest of America's trading partners), real GDP is essentially flat in 2025 whereas it grows 1.8% under baseline (Figure 3). The downshift in growth causes the unemployment rate to rise to 4.6% (Figure 4). As GDP growth strengthens in subsequent years, the jobless rate recedes back to its baseline rate. Under the scenario in which America's trading partners retaliate against the Trump tariffs with their own 10% levies on U.S. exports, real GDP would contract by 0.4% in 2025. Growth turns positive again in 2026, due in part to the monetary policy easing that we discuss in more detail below, but the level of GDP (i.e., the size of the economy) does not return to baseline, at least not through 2029. The jobless rate under the "Trump + retaliation" scenario rises to 4.8% in 2026 before subsequently receding.
Tariffs Raise Inflation in 2025
The growth-reducing impact of the tariffs arise from their effects on the Consumer Price Index (CPI). As shown in Figure 5, the CPI rises by 2.5% in 2025 under the baseline scenario (as well as under the "Biden" scenario). But the 60% tariffs on Chinese goods and the 10% tariffs on imports from other trading partners that underlie the "Trump" scenario causes the CPI to jump 3.7% in 2025. In short, the tariffs lead to higher inflation, at least initially. The higher rate of inflation erodes growth in real disposable income, which has a depressing effect on growth in real consumer spending. As shown in the appendix, the core rate of CPI inflation, which excludes food and energy prices, exceeds the overall rate of inflation in 2025 under both the "Trump" and the "Trump + retaliation" scenarios. The tariffs, which act as a tax on foreign exports to the United States, lead to slower growth in foreign economies, thereby putting downward pressure on the price of oil.
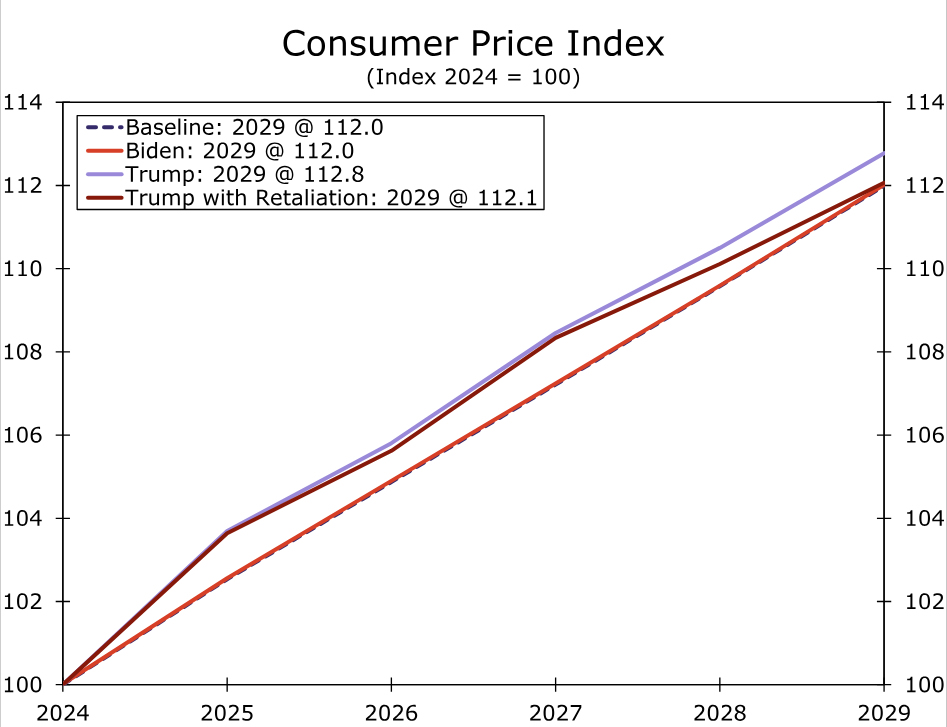
The Trump tariffs (60% on China, 10% on other trading partners) raise core consumer prices in 2025 by 1.6% relative to the baseline. The relatively modest increase in consumer prices is consistent with the empirical literature. For example, Cavallo et al. (2021) found that the vast majority of the 2018-19 tariff increases were paid for by U.S. importers.3 (That is, foreign exporters did not reduce their prices in an attempt to maintain market share in the United States.) Although American importers passed on some of the higher costs of the tariffed goods to consumers via higher prices, the importers absorbed the remainder via lower margins. We noted in a recent report that corporate profit margins are healthy at present, so importers may choose again to absorb some of the higher cost of foreign goods, should they be tariffed, via lower margins. That noted, prolonged margin squeeze could eventually lead to job cuts in the affected industries.
In our view, the GDP growth rates in 2025 and 2026 that are estimated by the model under the "Trump" and the "Trump + retaliation" scenarios could be best-case outcomes. As shown in Figure 6, the model estimates that the Federal Reserve would cut the target range for the federal funds rate by more under the two Trump scenarios than it does under the baseline scenario. These outcomes reflect the model's assumption that Fed policymakers place nearly equal weights on deviations of inflation from target as they do on the output gap. The output gap, which measures deviations of actual GDP from potential GDP, is highly correlated with the unemployment rate (i.e., the jobless rate goes up as actual output falls farther below potential output and vice versa). In other words, the model uses the so-called Taylor Rule with essentially equal weights on inflation and the output gap as a proxy for the Fed's reaction function.
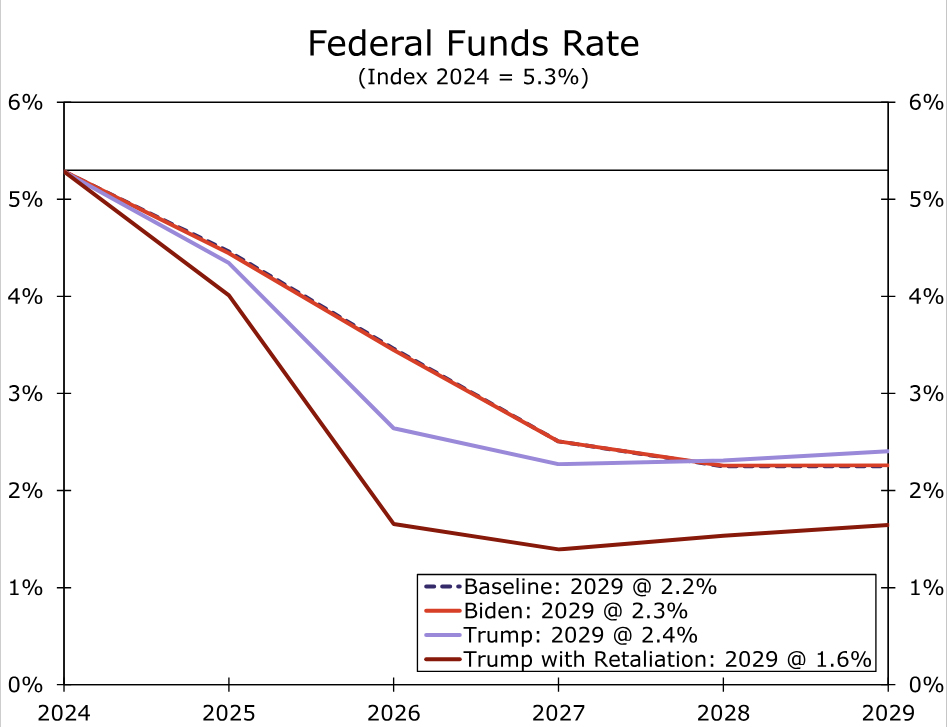
In the past, Fed policymakers seem to have placed equal weights on deviations of inflation from their 2% target as they did on the output gap. But given the surge in inflation a few years ago and the FOMC's determination to return it to target, one could reasonably argue that Fed policymakers actually place a greater weight on inflation at present than they do on the unemployment rate/output gap. If the levying of tariffs causes inflation to jump higher, then the FOMC may not cut rates as aggressively as the model estimates. Consequently, real GDP likely would weaken even more under the two Trump scenarios, thereby leading to a higher unemployment rate than shown in Figure 4.
Modest Stagflationary Shock from Higher Tariffs
In short, across-the-board tariffs on America's trading partners would impart a modest stagflationary shock to the U.S. economy. That said, the model results suggest that the simultaneous rise in the unemployment rate and the inflation rate would not approach the degree of stagflation that was experienced in the late 1970s and 1980s. The so-called "Misery Index," which is the sum of the CPI inflation rate and the unemployment rate, shot up from roughly 12% in September 1973, which immediately preceded the first oil price shock, to about nearly 20% in early 1975 (Figure 7). It receded over the next few years but surged again to more than 20% following the second oil price shock in early 1979. As shown in the appendix, the combination of the annual CPI inflation rate and the annual unemployment rate remains below 10% in both the "Trump" and the "Trump + retaliation" scenarios. Even if higher inflation leads to less monetary easing than the model assumes, which would cause the jobless rate to rise higher than shown in the appendix, we doubt the "Misery Index" would approach the levels that were registered in the late-70s/early-80s.
The stagflation of that earlier era was kicked off by the oil price shocks of 1973 and 1979. The price of oil shot up 150% between Q3-1973 and Q1-1974. After grinding steadily higher over the next few years, oil prices jumped another 150% between early 1979 and mid-1980. Because oil was a widely used input in the U.S. economy at that time—not only did motorists use oil products but homes and factories were heated by oil—the oil price shocks had a significant stagflationary effect.
Fast-forward a few decades. The value of goods imports is equivalent to only 11% of nominal GDP at present, and the price rises induced by the potential tariffs pale in comparison to the moonshot in oil prices in the 1970s. We are not suggesting that the effects of the proposed tariff increases are de minimis. Higher prices erode growth in real income, which causes real GDP growth to slow, if not contract. The unemployment rate would rise. In short, the tariff increases would impart a modest stagflationary shock to the economy. However, a redux of the 1970s and early 1980s probably would not occur unless the Federal Reserve allowed inflation expectations to become unmoored. Given the Fed's well-earned inflation fighting credentials of the past few decades, we believe such a scenario is not very likely.
Appendix
Endnotes
1 – As noted previously, the Biden tariffs range from 25% to 100%. We use 50% in our modeling exercise as a simplifying assumption. (Return)
2 – The model's parameters allow us to consider the effects of tariffs on American imports from only Canada, China, the European Union, Japan, Korea and Taiwan. That noted, these economies in aggregate account for roughly 70% of total U.S. imports of goods. (Return)
3 – Cavallo, Alberto, Gita Gopinath, Brent Neiman and Jenny Tang, "Tariff-Pass Through at the Border and at the Store: Evidence from US Trade Policy," American Economic Review: Insights 3:1, 2021, p. 19-34. (Return)
USD/JPY Turns Red, Can It Start Recovery Wave?
Key Highlights
- USD/JPY extended losses below the 157.50 support zone.
- A key bearish trend line is forming with resistance at 157.80 on the 4-hour chart.
- EUR/USD rallied and tested the 1.0950 resistance zone.
- Bitcoin could aim for more upsides if it clears the $66,000 resistance zone.
USD/JPY Technical Analysis
The US Dollar remained in a bearish zone below the 158.80 level against the Japanese Yen. USD/JPY traded below the 157.20 support zone and extended losses.
Looking at the 4-hour chart, the pair settled below the 157.20 level, the 100 simple moving average (red, 4-hour), and the 200 simple moving average (green, 4-hour). The pair even spiked below the 155.50 support zone.
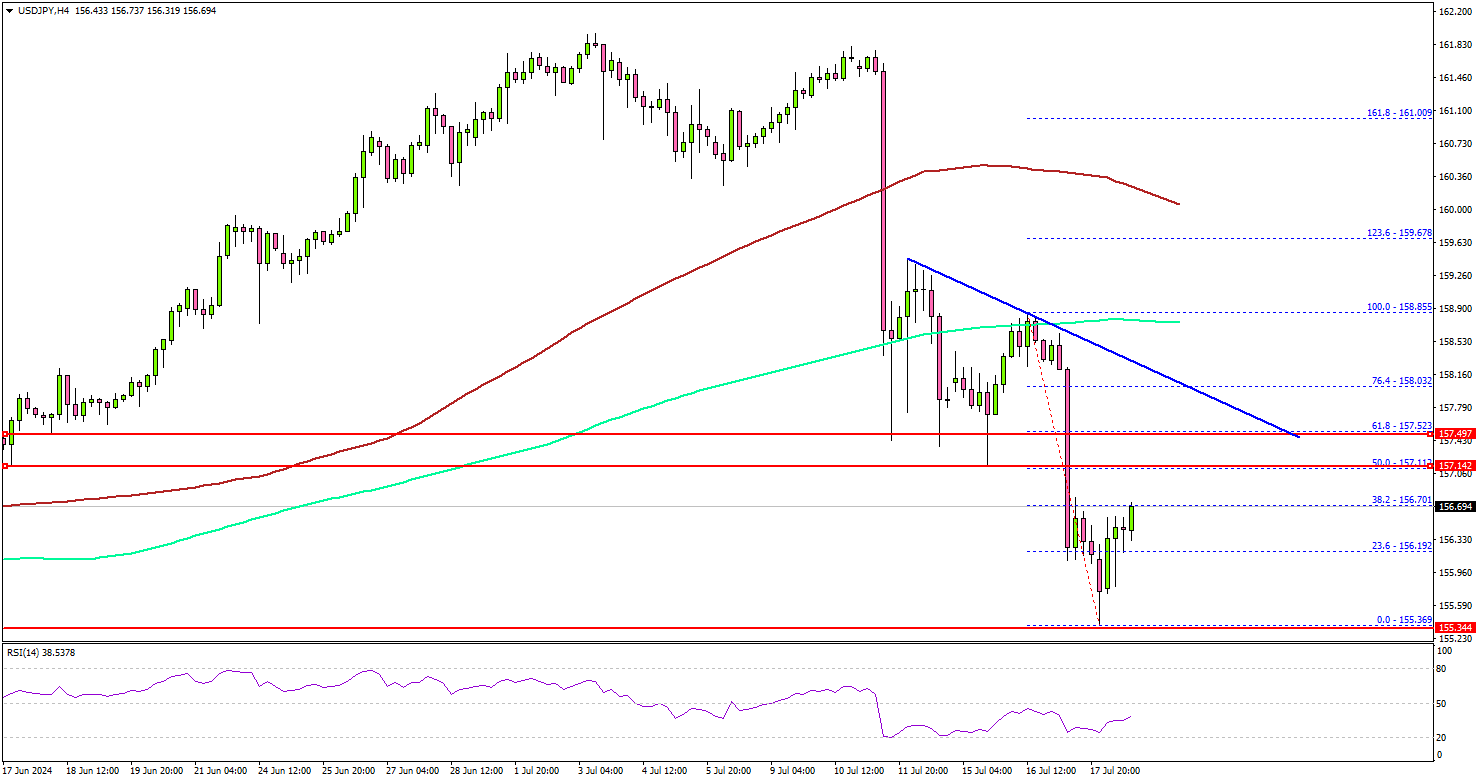
It tested the 155.35 zone and recently corrected some losses. There was a move above the 155.80 level. If there is a recovery wave, the pair could face resistance near the 157.20 level.
The next resistance sits at 157.50. There is also a key bearish trend line forming with resistance at 157.80 on the same chart. The main hurdle sits at 158.00. A clear move above the 158.00 resistance might send it toward the 158.80 level.
Any more gains might open the doors for a test of the 159.50 zone in the coming days. Immediate support is near the 155.80 level.
The next major support is near the 155.50 level. A downside break and close below the 155.50 support zone could open the doors for more losses. In the stated case, USD/JPY might decline toward the 154.20 level.
Looking at Bitcoin, the price seems to be consolidating gains. There could be a fresh increase if there is a close above $65,500 and $66,000.
Economic Releases
- Fed's Williams speech.
- Fed's Bostic speech.
Fed’s Daly advocates for patience as “we’re not there yet”
San Francisco Fed President Mary Daly commented at an event overnight, emphasizing that the US has not yet achieved price stability. While acknowledging recent positive inflation data, Daly noted, "We're not there yet."
Daly highlighted the delicate balancing act facing monetary policy. She called for patience, urging policymakers to "balance the costs of acting fast and being wrong."
"It's a risk to act too soon to normalize interest rates and then have inflation stuck below or above our target, and it's a risk to hold on too long and make the labor market falter," Daly elaborated.
Japan’s CPI core rises to 2.6%, above target for 27th month
Japan's core CPI, which excludes food prices, rose from 2.5% yoy to 2.6% yoy in June, slightly missing expectations of 2.7% yoy. This nonetheless marks the 27th consecutive month that inflation has been at or above BoJ's 2% target. Core-core CPI, which excludes both food and energy, increased from 2.1% yoy to 2.2% yoy, while headline CPI as unchanged at 2.8% yoy.
Services inflation saw a modest increase from 1.6% yoy to 1.7% yoy. A reduction in government subsidies aimed at curbing utility bills resulted in a 7.7% yoy rise in energy costs, up from 7.2% increase seen in May.
Attention is now shifting to BoJ's upcoming meeting on July 30-31. There is divided opinion on whether BoJ will decide to hike the policy rate from the current 0.00-0.10% range to 0.15-0.25%. The central bank is also expected to unveil a roadmap for reducing its bond purchases and release its economic outlook report, which will publish new economic forecasts.
We’re Just Not That Special
After a few wobbles, disinflation has resumed in peer economies. Why should Australia be any different?
Recent inflation data overseas has reminded market participants that sticky inflation need not imply stuck inflation. After a few wobbles, disinflation has resumed in the United States, Canada and New Zealand.
Expectations of near-term cuts in policy rates have therefore come back into frame in the United States and New Zealand; the Bank of Canada has already started cutting, as have the ECB and several other European central banks. Our Chief Economist in New Zealand, Kelly Eckhold, has changed his rate call and now expects the RBNZ to start cutting from November.
The logic behind all these central bank moves is the same. First, tight policy cannot last forever, else inflation would fall continuously and undershoot central banks’ targets. Second, because monetary policy affects inflation with a lag, the rate-cutting phase needs to start before inflation has reached target. Otherwise, policymakers will have acted too late. At some point before reaching target, therefore, central banks need to start reducing the restrictiveness of policy and head towards neutral. Australia is no different to its peers in this regard.
As we have previously argued, there is no reason for the RBA to move in lockstep with its peers. At times, the RBA and the Fed have even moved in opposite directions. But there are limits to divergence. In the current inflation episode, most of the surge reflected a common, pandemic-related shock. Most private sector forecasters expect inflation in Australia to decline into the 2–3% target range at a similar pace to the RBA’s own forecasts – though there are outliers. Anyone arguing that the RBA is a long way from cutting would need to show why Australia would not follow the same broad disinflation trend as its peers.
Common and uncommon shocks
Australia was later to open up after the pandemic than most other advanced economies, and so was later to see the surge in inflation. The RBA is also deliberately choosing a ‘not quite as high for a bit longer’ strategy, in order to hold onto the gains made in getting unemployment down. So there is good reason to expect the RBA to be among the last of the advanced economy central banks to start cutting rates.
The question is, how much later than its peers will the RBA move if the forces driving the inflation process are mostly similar?
There are some Australian-specific factors to consider, but they fall on both sides of the ledger. Housing-related costs are clearly an issue. Part of this is the result of pandemic-era supply chain issues lifting materials prices and so the cost of home-building, but that was a common shock. The catch-up surge in population after the international borders reopened was also common to some peer economies including Canada. This catch-up has boosted demand for housing, lifting both home-building costs and rents, but the boost to inflation – and the drag on productivity – will subside over time as population growth normalises.
A possible Australian-specific factor, as we have previously noted, is that home-building cost inflation has remained higher than in some peers. Recent headlines might suggest a partial explanation for this, though of course other Australia-specific factors could also be at play.
On the other side, though, pass-through of policy rates to lending rates is particularly strong in Australia; IMF analysis in its April World Economic Outlook highlighted this. And unlike some peer economies such as the United States and United Kingdom, growth in the labour supply has remained very strong, slightly outstripping that in labour demand. This is partly because recent migration has been even more skewed to working-age people than usual, so growth of the working-age population has outpaced that of the population overall. In addition, as noted by Westpac Economics colleague Ryan Wells yesterday, the participation rate among those working-age residents remains at historically high levels. Most measures of labour market tightness are well off their highs and wages growth in Australia has already peaked.
The Toyota ‘Five Whys’
The ‘Five Whys’ is a tool developed at Toyota for root-cause analysis. It boils down to asking ‘why?’ at least five times. If your first answer is that B caused A, ask why B happened. And then ask why that happened, and so on. This approach to understanding can be as useful in economics as it is in manufacturing.
In thinking about why the RBA policy path might differ from that of its peers from here, it is sometimes argued that inflation will remain stickier here because the RBA chose that ‘not quite as high for longer’ policy path.
The difficulty with that argument is that we are only talking about a percentage point or so difference in policy rates, for a year or so. Most models of the Australian economy – including the RBA’s main whole-economy model – imply that if the policy rate is 100 basis points higher for a year or so, the peak effect of this on inflation is a reduction of a little less than 0.2 percentage points, about two years later. (If this sounds small to you, you have just discovered the dirty little secret of monetary policy: modest changes in the level of policy interest rates or their timing have only a barely perceptible effect on the policy objective.)
The second ‘why’ then becomes: why would one think that 100 basis points should make so much difference now? Maybe it does, but what is the mechanism? What makes Australia so special, and why now, not at other times?
As we have previously noted, an unexpectedly ugly June quarter CPI result might make the RBA want to wait even longer. But would it be enough to convince it that Australia is on a completely different path to its peers?
The world has been confronted with some seriously unusual shocks over the past few years. And as we have seen over the past week, there are some situations where a small difference in position can make a huge difference to the outcome.
Looking through the noise, though, it is hard to see why those unusual shocks should play out so differently here than elsewhere.
Perhaps we need to remind ourselves that we are just not that special.
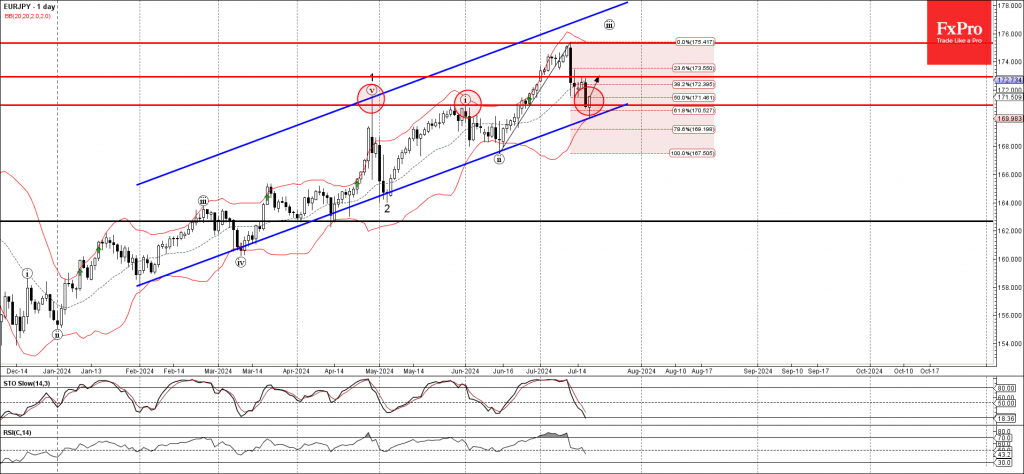
EURJPY Wave Analysis
- EURJPY reversed from support area
- Likely to rise to resistance level 172.95
EURJPY currency pair today reversed up from the support area located between the pivotal support level 170.95 (which stopped the pair in April and May), lower daily Bollinger Band, 50% Fibonacci correction of the upward impulse from June and the support trendline of the daily up channel from February.
The upward reversal from this support area stopped the previous short-term correction from the start of July.
Given the clear daily uptrend and the oversold daily Stochastic, EURJPY currency pair can be expected to rise further to the next resistance level 172.95.
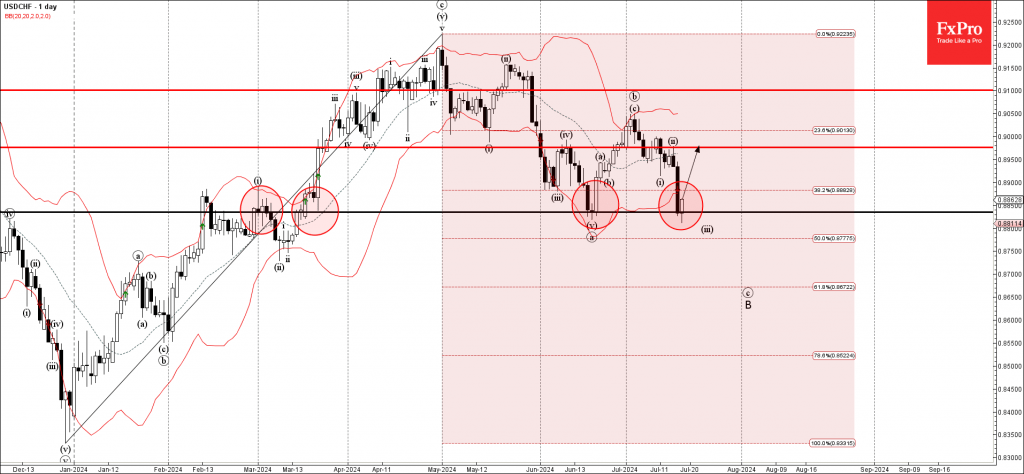
USDCHF Wave Analysis
- USDCHF reversed from support area
- Likely to rise to resistance level 0,9000
USDCHF currency pair today reversed up from the support area located between the key support level 0.8835 (which created the Morning Star in June), 38.2% Fibonacci correction of the upward impulse from December and the lower daily Bollinger Band.
The upward reversal from this support area stopped the previous waves c and B.
Given the strength of the support level 0.8835, USDCHF currency pair can be expected to rise further to the next resistance level 0,9000 (top of the previous correction ii).