Sample Category Title
USD/CHF Mid-Day Outlook
Daily Pivots: (S1) 0.8790; (P) 0.8871; (R1) 0.8915; More…
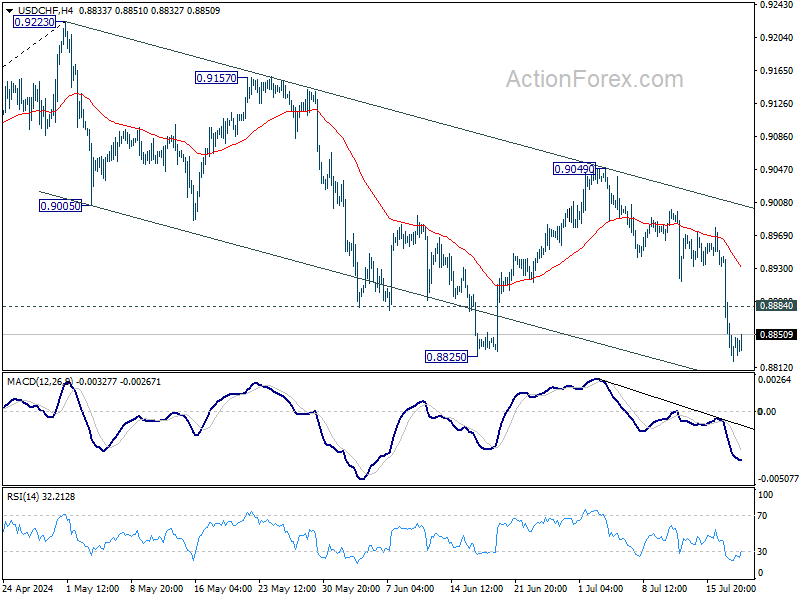
USD/CHF's decline is still in progress and intraday bias stays on the downside. Fall from 0.9223 should target 60% retracement of 0.8332 to 0.9223 at 0.8672 next. On the upside, above 0.8884 minor resistance will turn intraday bias neutral first.
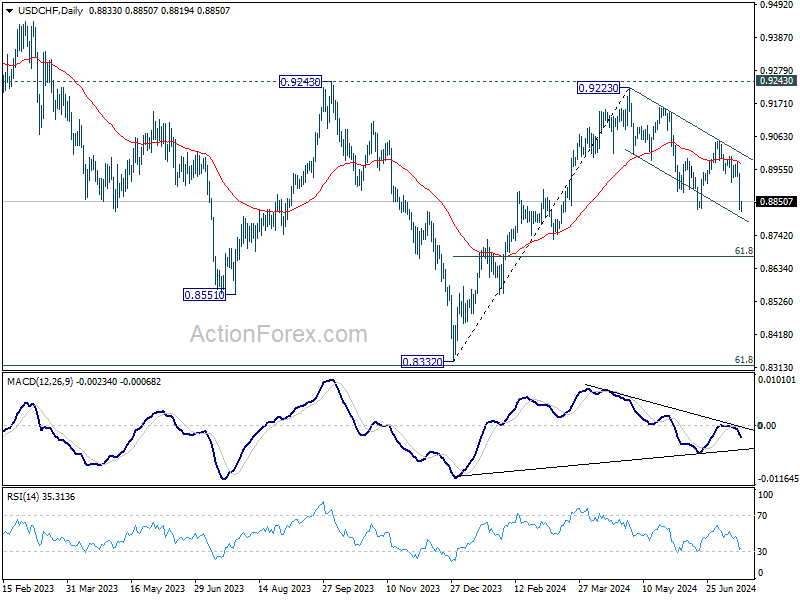
In the bigger picture, with 0.9243 resistance intact, medium term outlook in USD/CHF is neutral at best. For now, more sideway trading is likely between 0.8332/9243. However, firm break of 0.9243 will indicate larger bullish trend reversal.
GBP/USD Mid-Day Outlook
Daily Pivots: (S1) 1.2968; (P) 1.3006; (R1) 1.3048; More...
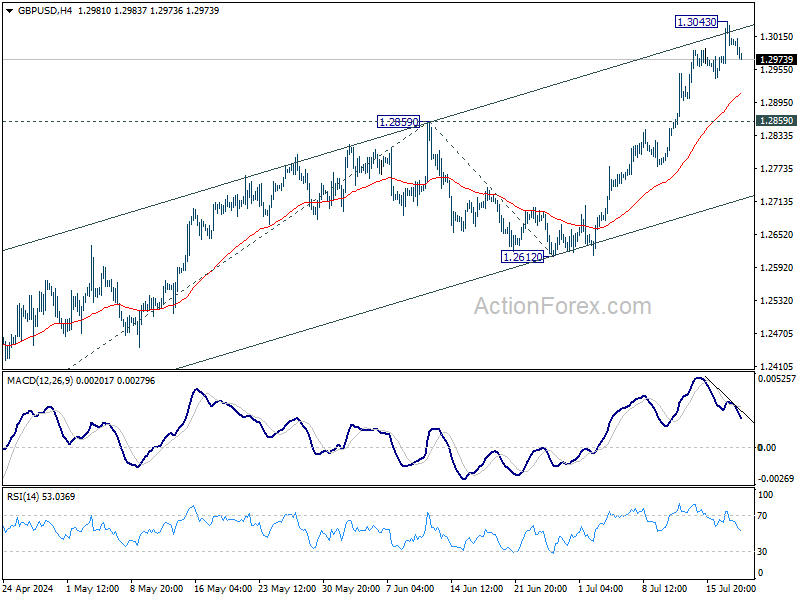
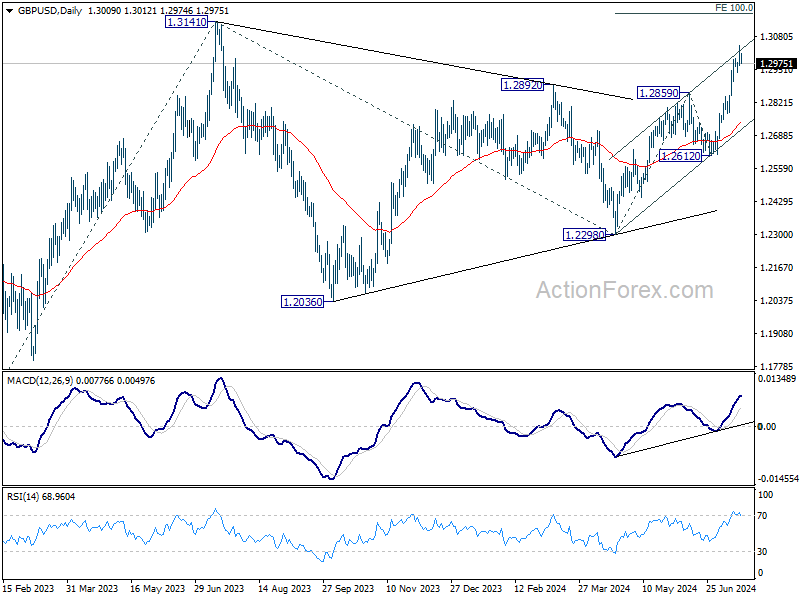
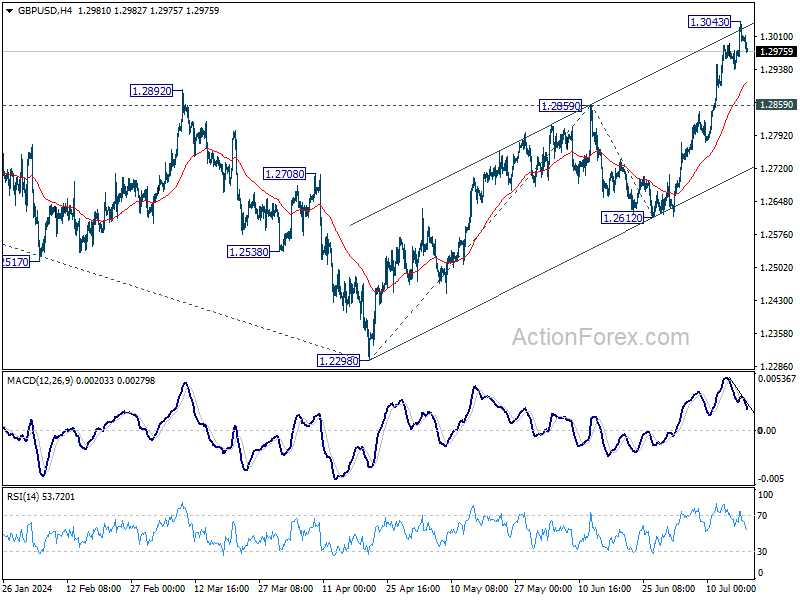
A temporary top should be formed at 1.3043 as GBP/USD retreated after hitting rising channel resistance. Intraday bias is turned neutral for some consolidations first. Downside should be contained by 1.2859 resistance turned support to bring another rally. Above 1.3043 will resume the rise from 1.2298 to 100% projection of 1.2298 to 1.2859 from 1.2612 at 1.3173, which is slightly above 1.3141 key medium term resistance.
In the bigger picture, corrective pattern from 1.3141 medium term top (2023 high) could have completed with three waves to 1.2298 already. This will now remain the favored case as long as 1.2612 support holds. Firm break of 1.3141 will target 61.8% projection of 1.0351 (2022 low) to 1.3141 from 1.2298 at 1.4022.
EUR/USD Mid-Day Outlook
Daily Pivots: (S1) 1.0907; (P) 1.0928; (R1) 1.0960; More....
Intraday bias in EUR/USD is turned neutral first with current retreat. Some consolidations would be seen below 1.0947 temporary top. But downside should be contained by 1.0871 support to bring another rally. On the upside, break of 1.0947 will resume the rise from 1.0601 and target 100% projection of 1.0601 to 1.0915 from 1.0665 at 1.0979. However, firm break of 1.0871 will turn bias back to the downside for deeper pullback.

In the bigger picture, price actions from 1.1274 are viewed as a corrective pattern, possibly a triangle, that's still be in progress. Break of 1.1138 resistance will be the first signal that rise from 0.9534 (2022 low) is ready to resume through 1.1274 (2023 high). This will now remain the favored case as long as 1.0601 support holds.

Subdued Forex Trading as ECB Holds Rates Steady
Trading in the forex markets has been relatively subdued today. ECB's decision to hold interest rates steady was widely expected, and President Christine Lagarde's press conference did not introduce any significant new information.
ECB's accompanying statement highlighted that domestic price pressures remain high, services inflation is elevated, and headline inflation is likely to stay above target well into next year. This outlook will keep ECB cautious regarding any further policy easing. There seems to be no rush into another rate cut. The next decision is heavily dependent on new economic projections available by the September meeting.
For the week so far, Swiss Franc remains the strongest performer, followed by Yen and then Euro. New Zealand Dollar is still the worst performer, followed by Australian and Canadian Dollars. Dollar and Sterling are mixed in the middle.
Technically, GBP/USD's rally lost momentum after hitting near term channel resistance. Some consolidation is now likely below 1.3043 first. But downside of retreat should be contained by 1.2859 resistance turned support to bring another rally. Rise from 1.2298 is still expected to resume at a later stage to 100% projection of 1.2298 to 1.2859 from 1.2612 at 1.3173.
In Europe, at the time of writing, FTSE is up 0.79%. DAX is up 0.36%. CAC is up 1.01%. UK 10-year yield is down -0.028 at 4.052. Germany 10-year yield is up 0.009 at 2.432. Earlier in Asia, Nikkei fell sharply by -2.36%. Hong Kong HSI rose 0.22%. China Shanghai SSE rose 0.48%. Singapore Strait Times fell -0.53%. Japan 10-year JGB yield rose 0.0102 to 1.042.
US initial jobless claims rises to 243k vs exp 225k
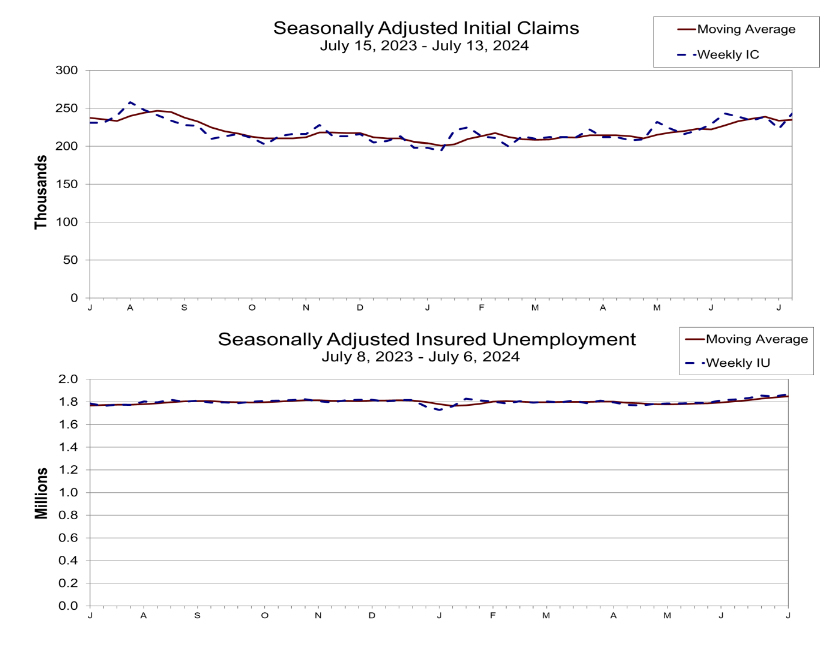
US initial jobless claims rose 20k to 243k in the week ending July 13, above expectation of 225k. Four-week moving average of initial claims rose 1k to 235k.
Continuing claims rose 20k to 1867k in the week ending July 6, highest since November 27, 2021. Four-week moving average of continuing claims rose 12k to 1851k, highest since December 4, 2021.
ECB stands pat, headline inflation to stay above target well into next year
ECB left interest rates unchanged as wildly expected. Interest rates on the marginal lending facility and the deposit facility are held at 4.25%, 4.50% and 3.75% respectively.
In the accompanying statement, ECB noted that incoming information broadly support the Governing Council's medium-term inflation outlook. Most measures of underlying inflation were "either stable or edged down" in June. Impact of high wage growth has been "buffered by profits".
Nevertheless, domestic price pressures are "still high" while services inflation is "elevated". Headline inflation is "likely to remain above the target well into next year".
ECB also pledge to keep policy rates "sufficiently restrictive for as long as necessary", and will continue to follow a "date-dependent and meeting-by-meeting" approach, while "not pre-committing" to a particular rate path.
UK payrolled employment rises 16k in Jun, unemployment rate steady at 4.4% in May
In June, UK payrolled employment rose 16k or 0.1% mom. Median monthly pay increased 3.6%, sharply lower than prior month's 6.0% yoy. This sharper than usual slow down in pay growth is partly because of the comparison with June 2023, which figure was inflated by pay settlements made in the health sector. Claimant count rose 32.3k versus expectation of 23.4k.
In the three months to May, unemployment rate was unchanged at 4.4%, matched expectations. Growth of average earnings including bonus slowed from 5.9% yoy to 5.7% yoy. Growth of average earnings excluding bonus slowed from 6.0% yoy to 5.7% yoy. Both earnings growth matched expectations.
Japan's exports rise 5.4% yoy in June, but volume down -6.2% yoy
In June, Japan's exports grew by 5.4% yoy to JPY 9209B, falling short of 6.4% yoy expected. This marks the seventh consecutive monthly increase in export value. However, export volume fell by -6.2% yoy, indicating that the rise in export value was driven primarily by higher prices and falling Yen rather than increased demand.
By destination, shipments to the US increased by 11% yoy. Exports to China grew by 7.2% yoy, marking the seventh consecutive month of growth. Overall, exports to Asia rose by 7.7% yoy, but exports to the EU declined by -13.4% yoy.
Imports increased by 3.2% yoy to JPY 8985B, below the expected 9.3% yoy. Import volume also decreased by -8.9% yoy. For June, Japan recorded a trade surplus of JPY 224B.
In seasonally adjusted terms, exports declined by -0.2% mom h to JPY 8961B, while imports rose by 1.6% mom to JPY 9778B, leading to a trade deficit of JPY -817B.
Australia's employment grows 50.2k, labor market remains relatively tight
Australia's employment figures for June showed a strong increase, with employment rising by 50.2k, well above the expected 20.0k. This growth included 43.3k full-time jobs and 6.8k part-time jobs.
Unemployment rate edged up from 4.0% to 4.1%, in line with expectations. Participation rate also increased from 66.8% to 66.9%, just 0.1% below the historical high of 67.0% set in November 2023. Additionally, the employment-to-population ratio rose by 0.1% to 64.2%, close to its historical peak of 64.4% from November 2023. Monthly hours worked increased by 0.8% mom.
Bjorn Jarvis, head of labour statistics at ABS, observed that both the employment-to-population ratio and the participation rate are still near their 2023 highs. He added that together the persistently high level of job vacancies indicates the labor market "remains relatively tight", even though unemployment rate has been above 4.0% since April.
Australia's NAB business confidence ticks up to -1 in Q2, conditions tumbles to 5
Australia's NAB Quarterly Business Confidence improved marginally, rising from -2 to -1 in Q2. However, business conditions overall weakened, with the index falling from 10 to 5. Trading conditions dropped from 15 to 9, profitability conditions fell from 8 to 2, and employment conditions decreased from 7 to 5.
Cost pressures persisted, with labor costs growing at 1.2%, unchanged from the previous quarter, and purchase costs growing at 0.9%, down from 1.1%. Price growth measures showed some relief, with final product price growth at 0.6% quarter-on-quarter, down from 0.8%. Retail price growth eased to 0.7% from 0.9%, and recreation and personal services price growth slowed to 0.6% from 0.8%.
NAB Chief Economist Alan Oster noted that the survey shows mixed results on cost pressures and prices. While materials cost growth is improving, labor costs remain high. He highlighted that 30% of firms are facing significant challenges with labor availability, and wage costs continue to be a major concern.
EUR/USD Mid-Day Outlook
Daily Pivots: (S1) 1.0907; (P) 1.0928; (R1) 1.0960; More....
Intraday bias in EUR/USD is turned neutral first with current retreat. Some consolidations would be seen below 1.0947 temporary top. But downside should be contained by 1.0871 support to bring another rally. On the upside, break of 1.0947 will resume the rise from 1.0601 and target 100% projection of 1.0601 to 1.0915 from 1.0665 at 1.0979. However, firm break of 1.0871 will turn bias back to the downside for deeper pullback.
In the bigger picture, price actions from 1.1274 are viewed as a corrective pattern, possibly a triangle, that's still be in progress. Break of 1.1138 resistance will be the first signal that rise from 0.9534 (2022 low) is ready to resume through 1.1274 (2023 high). This will now remain the favored case as long as 1.0601 support holds.
Economic Indicators Update
| GMT | Ccy | Events | Actual | Forecast | Previous | Revised |
|---|---|---|---|---|---|---|
| 23:50 | JPY | Trade Balance (JPY) Jun | -0.82T | -0.89T | -0.62T | -0.64T |
| 01:30 | AUD | Employment Change Jun | 50.2K | 20.0K | 39.7K | 39.5K |
| 01:30 | AUD | Unemployment Rate Jun | 4.10% | 4.10% | 4.00% | |
| 06:00 | CHF | Trade Balance (CHF) Jun | 6.18B | 5.05B | 5.81B | 5.79B |
| 06:00 | GBP | Claimant Count Change Jun | 32.3K | 23.4K | 50.4K | 51.9K |
| 06:00 | GBP | ILO Unemployment Rate (3M) May | 4.40% | 4.40% | 4.40% | |
| 06:00 | GBP | Average Earnings Including Bonus 3M/Y May | 5.70% | 5.70% | 5.90% | |
| 06:00 | GBP | Average Earnings Excluding Bonus 3M/Y May | 5.70% | 5.70% | 6.00% | |
| 12:15 | EUR | ECB Deposit Rate | 3.75% | 3.75% | 3.75% | |
| 12:15 | EUR | ECB Main Refinancing Rate | 4.25% | 4.25% | 4.25% | |
| 12:30 | USD | Initial Jobless Claims (Jul 12) | 243K | 225K | 222K | 223K |
| 12:30 | USD | Philadelphia Fed Manufacturing Jul | 13.9 | 2.9 | 1.3 | |
| 12:45 | EUR | ECB Press Conference | ||||
| 14:30 | USD | Natural Gas Storage | 55B | 65B |
US initial jobless claims rises to 243k vs exp 225k
US initial jobless claims rose 20k to 243k in the week ending July 13, above expectation of 225k. Four-week moving average of initial claims rose 1k to 235k.
Continuing claims rose 20k to 1867k in the week ending July 6, highest since November 27, 2021. Four-week moving average of continuing claims rose 12k to 1851k, highest since December 4, 2021.
ECB stands pat, headline inflation to stay above target well into next year
ECB left interest rates unchanged as wildly expected. Interest rates on the marginal lending facility and the deposit facility are held at 4.25%, 4.50% and 3.75% respectively.
In the accompanying statement, ECB noted that incoming information broadly support the Governing Council's medium-term inflation outlook. Most measures of underlying inflation were "either stable or edged down" in June. Impact of high wage growth has been "buffered by profits".
Nevertheless, domestic price pressures are "still high" while services inflation is "elevated". Headline inflation is "likely to remain above the target well into next year".
ECB also pledge to keep policy rates "sufficiently restrictive for as long as necessary", and will continue to follow a "date-dependent and meeting-by-meeting" approach, while "not pre-committing" to a particular rate path.
(ECB) Monetary policy decisions
18 July 2024
The Governing Council today decided to keep the three key ECB interest rates unchanged. The incoming information broadly supports the Governing Council's previous assessment of the medium-term inflation outlook. While some measures of underlying inflation ticked up in May owing to one-off factors, most measures were either stable or edged down in June. In line with expectations, the inflationary impact of high wage growth has been buffered by profits. Monetary policy is keeping financing conditions restrictive. At the same time, domestic price pressures are still high, services inflation is elevated and headline inflation is likely to remain above the target well into next year.
The Governing Council is determined to ensure that inflation returns to its 2% medium-term target in a timely manner. It will keep policy rates sufficiently restrictive for as long as necessary to achieve this aim. The Governing Council will continue to follow a data-dependent and meeting-by-meeting approach to determining the appropriate level and duration of restriction. In particular, its interest rate decisions will be based on its assessment of the inflation outlook in light of the incoming economic and financial data, the dynamics of underlying inflation and the strength of monetary policy transmission. The Governing Council is not pre-committing to a particular rate path.
Key ECB interest rates
The interest rate on the main refinancing operations and the interest rates on the marginal lending facility and the deposit facility will remain unchanged at 4.25%, 4.50% and 3.75% respectively.
Asset purchase programme (APP) and pandemic emergency purchase programme (PEPP)
The APP portfolio is declining at a measured and predictable pace, as the Eurosystem no longer reinvests the principal payments from maturing securities.
The Eurosystem no longer reinvests all of the principal payments from maturing securities purchased under the PEPP, reducing the PEPP portfolio by €7.5 billion per month on average. The Governing Council intends to discontinue reinvestments under the PEPP at the end of 2024.
The Governing Council will continue applying flexibility in reinvesting redemptions coming due in the PEPP portfolio, with a view to countering risks to the monetary policy transmission mechanism related to the pandemic.
Refinancing operations
As banks are repaying the amounts borrowed under the targeted longer-term refinancing operations, the Governing Council will regularly assess how targeted lending operations and their ongoing repayment are contributing to its monetary policy stance.
***
The Governing Council stands ready to adjust all of its instruments within its mandate to ensure that inflation returns to its 2% target over the medium term and to preserve the smooth functioning of monetary policy transmission. Moreover, the Transmission Protection Instrument is available to counter unwarranted, disorderly market dynamics that pose a serious threat to the transmission of monetary policy across all euro area countries, thus allowing the Governing Council to more effectively deliver on its price stability mandate.
The President of the ECB will comment on the considerations underlying these decisions at a press conference starting at 14:45 CET today.
Brent Oil Price Trends Upward Amid Positive Market Signals
Brent crude oil has reached $85.40, marking a continued increase over two consecutive sessions. This upward trend is primarily supported by recent US energy inventory statistics, which showed a significant decrease of 4.87 million barrels against an anticipated decline of 0.8 million barrels. This marks the longest stretch of inventory reductions since last September, underscoring a robust demand for oil.
Fueling the market optimism further, recent comments from Federal Reserve representatives suggest an imminent rate cut, with a 98% market expectation for this to occur in September. Lower interest rates typically stimulate economic activity, thereby boosting demand for oil.
Geopolitical tensions also play a role in the current price dynamics. Reports of renewed attacks by Hussite forces on vessels in the Red Sea have raised concerns about potential disruptions in oil supplies, prompting the market to add a risk premium to oil prices.
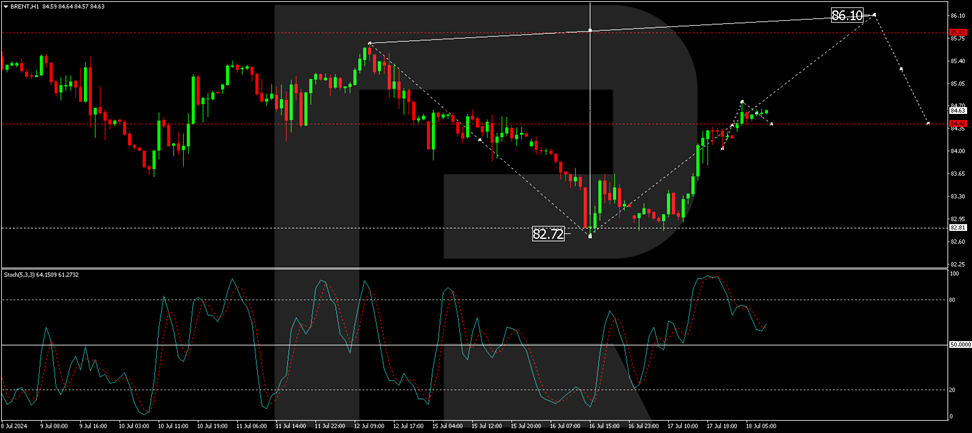
Brent technical analysis
The market has shown a growth wave reaching 84.42. A consolidation range has been established around this level. If the market breaks above this range, we anticipate a move towards 86.10, which is the immediate target. After reaching this target, a retest of 84.42 could occur, potentially setting the stage for further growth towards 87.70 and possibly extending to 90.00. The MACD indicator supports this bullish outlook, indicating an upward trajectory from below the zero mark.
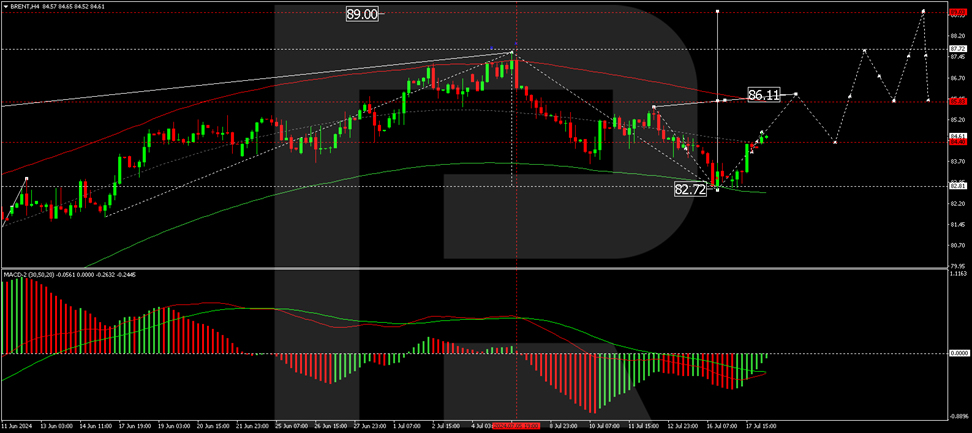
The market has found support at 84.42 and is progressing through a growth phase with an expected target at 86.10. We anticipate this target will be reached shortly, followed by a correction phase returning to 84.42. This view is supported by the Stochastic oscillator, which is nearing the 80 level, suggesting a potential pullback after the target is met.
Investors and traders should closely monitor these levels and the broader market context, including geopolitical developments and further signals from the Federal Reserve, as these factors will likely influence Brent's price movements in the near term.
USDCHF Elliott Wave Analysis Favors Selling Bounces
Hello traders, welcome to a new blog post. Today, we will discuss the future path for the USDCHF currency pair. The recent breakout confirmed the bearish bias we shared with members of Elliottwave-Forecast. So, what is next for this pair in the coming weeks?
On April 29, 2024, the pair completed the medium-term bullish corrective cycle that began in December 2023. Since then, it has continued to decline and is about to break below the second low, continuing the bearish sequence. Prior to this breakdown, we shared the weekly chart below with members to show the long-term path.
USDCHF Weekly Chart – 07.14.2024
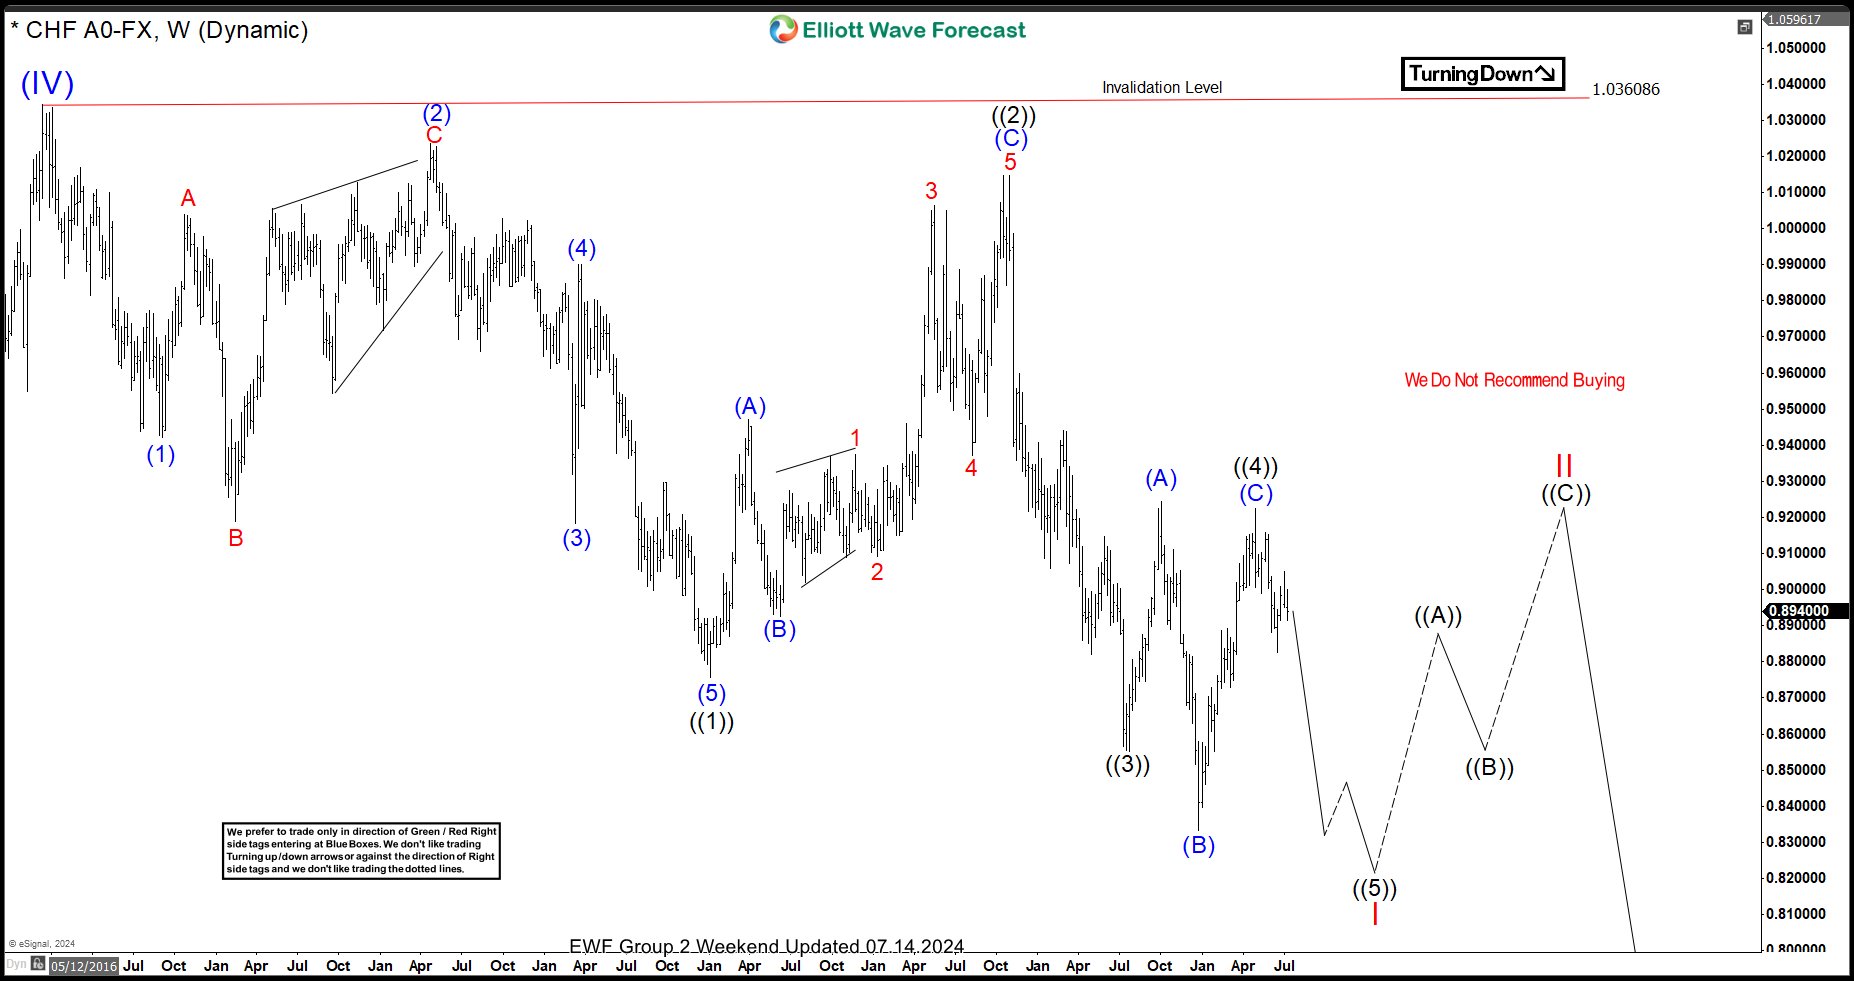
On July 14, 2024, we shared the chart above with members, highlighting the high likelihood of a bearish run from late April 2024. The weekly chart shows that the price completed the supercycle 4th wave – wave (IV) – in December 2016. Therefore, it began wave (V) from that point. From the top of December 2016, we laid out the path for wave I of (V). Price completed waves ((1)), ((2)), ((3)), and ((4)) of I in January 2021, October 2022, July 2023, and April 2024, respectively. Thus, from the peak of April 2024, we called for the last leg – wave ((5)) of I – to continue downwards and break below the December 2023 low. Therefore, members understood the direction we had our bias for in the weeks to follow. Additionally, we zoomed in on the H4 and H1 charts to monitor this development and trade along when there are bounces.
USDCHF H4 Chart – 07.16.2024
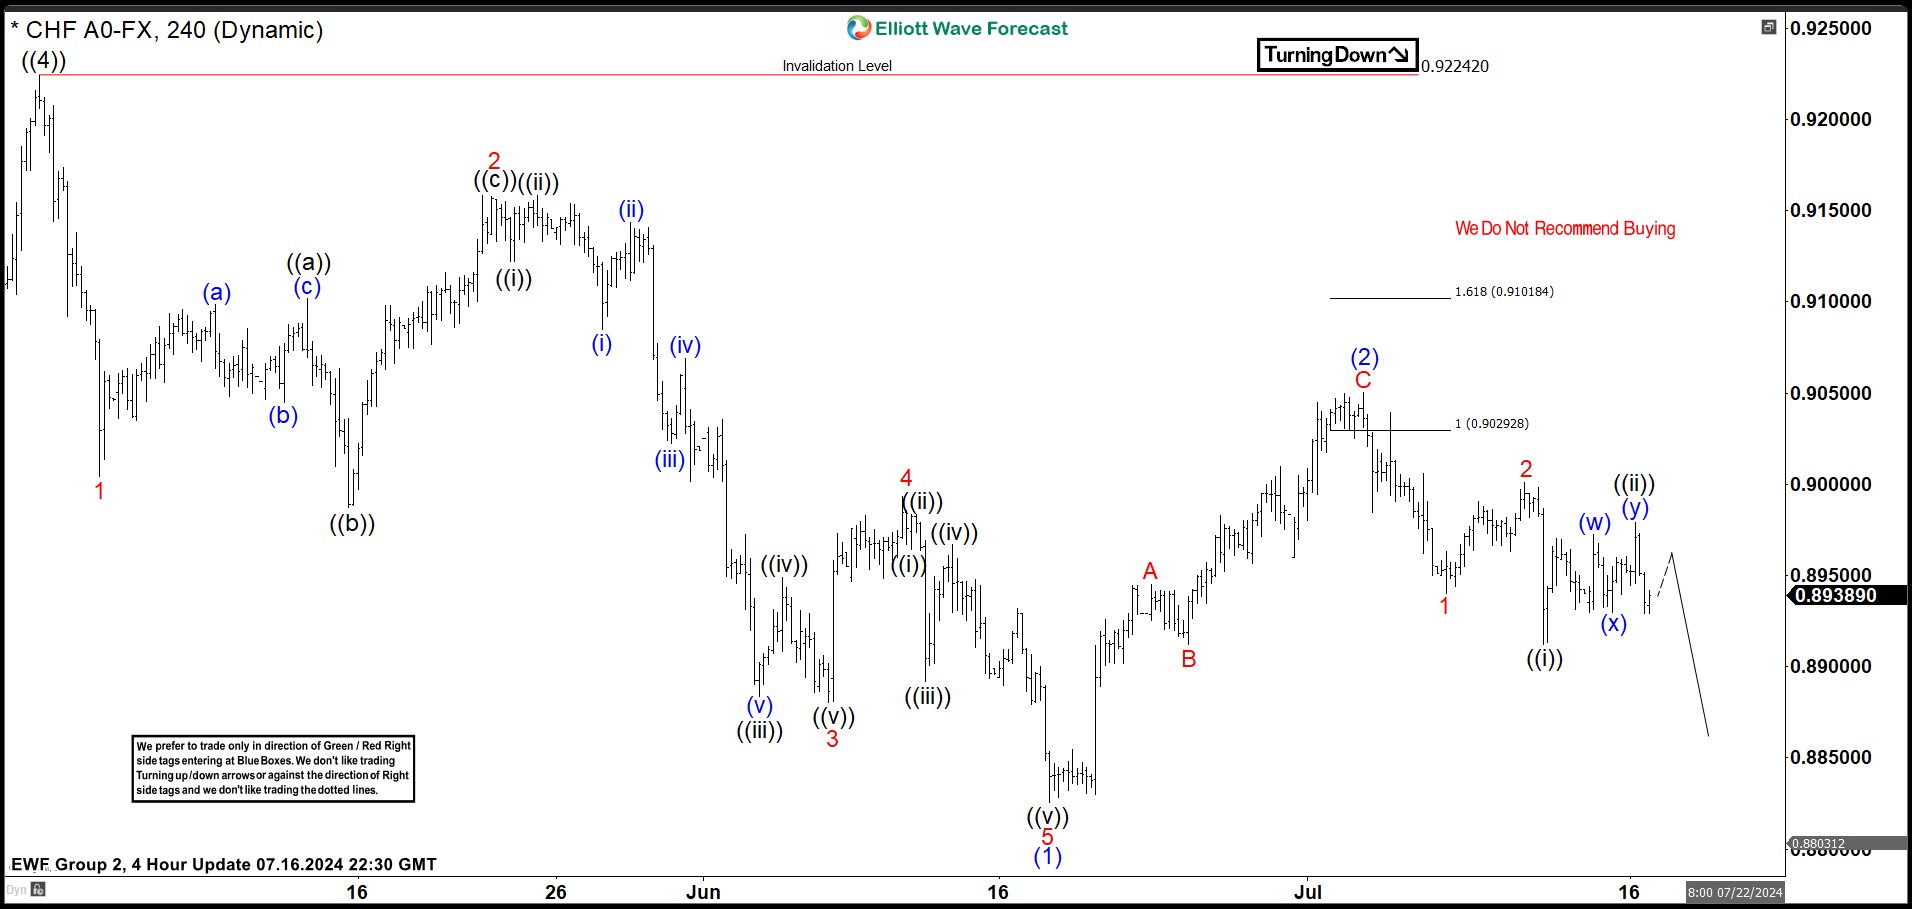
A few days later, we shared this H4 chart with members. A week before this time, we had recognized the end of wave (1) of ((5)) and monitored the development of the corresponding wave (2) correction. Since we wanted to sell bounces, we identified 0.9029-0.9101 as the extreme where wave (2) should end and wave (3) downwards should begin. The price respected the extreme and turned downwards for wave 1-2-((i))-((ii)) nesting. We called for a breakdown for wave ((iii)) of 3 as part of the larger degree wave (3). Eventually, the pair broke down below the start of wave (1), confirming the market’s commitment to the path we expected.
USDCHF H4 Chart- 07.17.2024
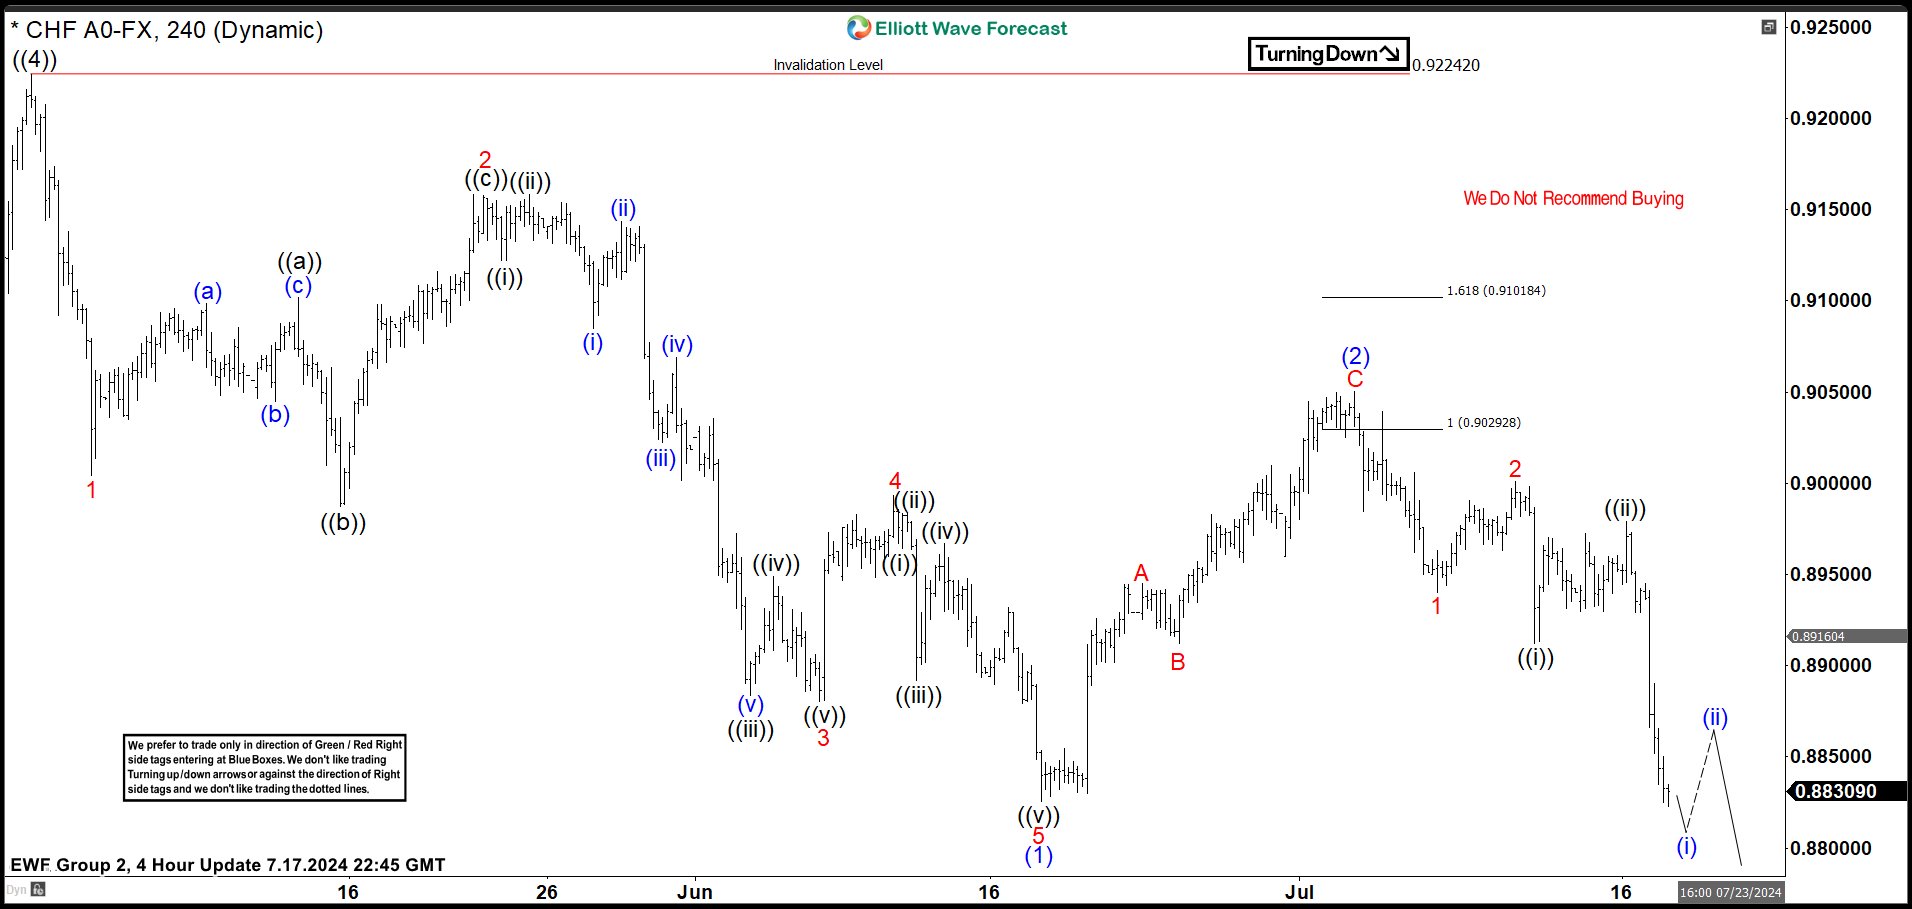
A day later, on July 17, 2024, we shared the H4 chart above with members. As the chart shows, wave ((iii)) is now in progress as the price seeks to break below wave (i) properly. The current sharp decline is wave (i) of ((iii)). The idea is to sell the bounces on both the H1/30Mins and H4 charts. Next, on the shorter cycles, we aim to sell for wave (iii) of ((iii)) after the price completes the next bounce for wave (ii) in 3, 7, 11 swings at our proprietary blue box.
In conclusion, it’s safe and profitable to trade in the direction of the trend. As the saying goes, “the trend is your friend.” Therefore, there is no need to trade against the trend when it’s not broken. As for USDCHF, we want to remain sellers and not buyers until this current bearish cycle is over.
Australian Shrugs on Mixed Employment Data
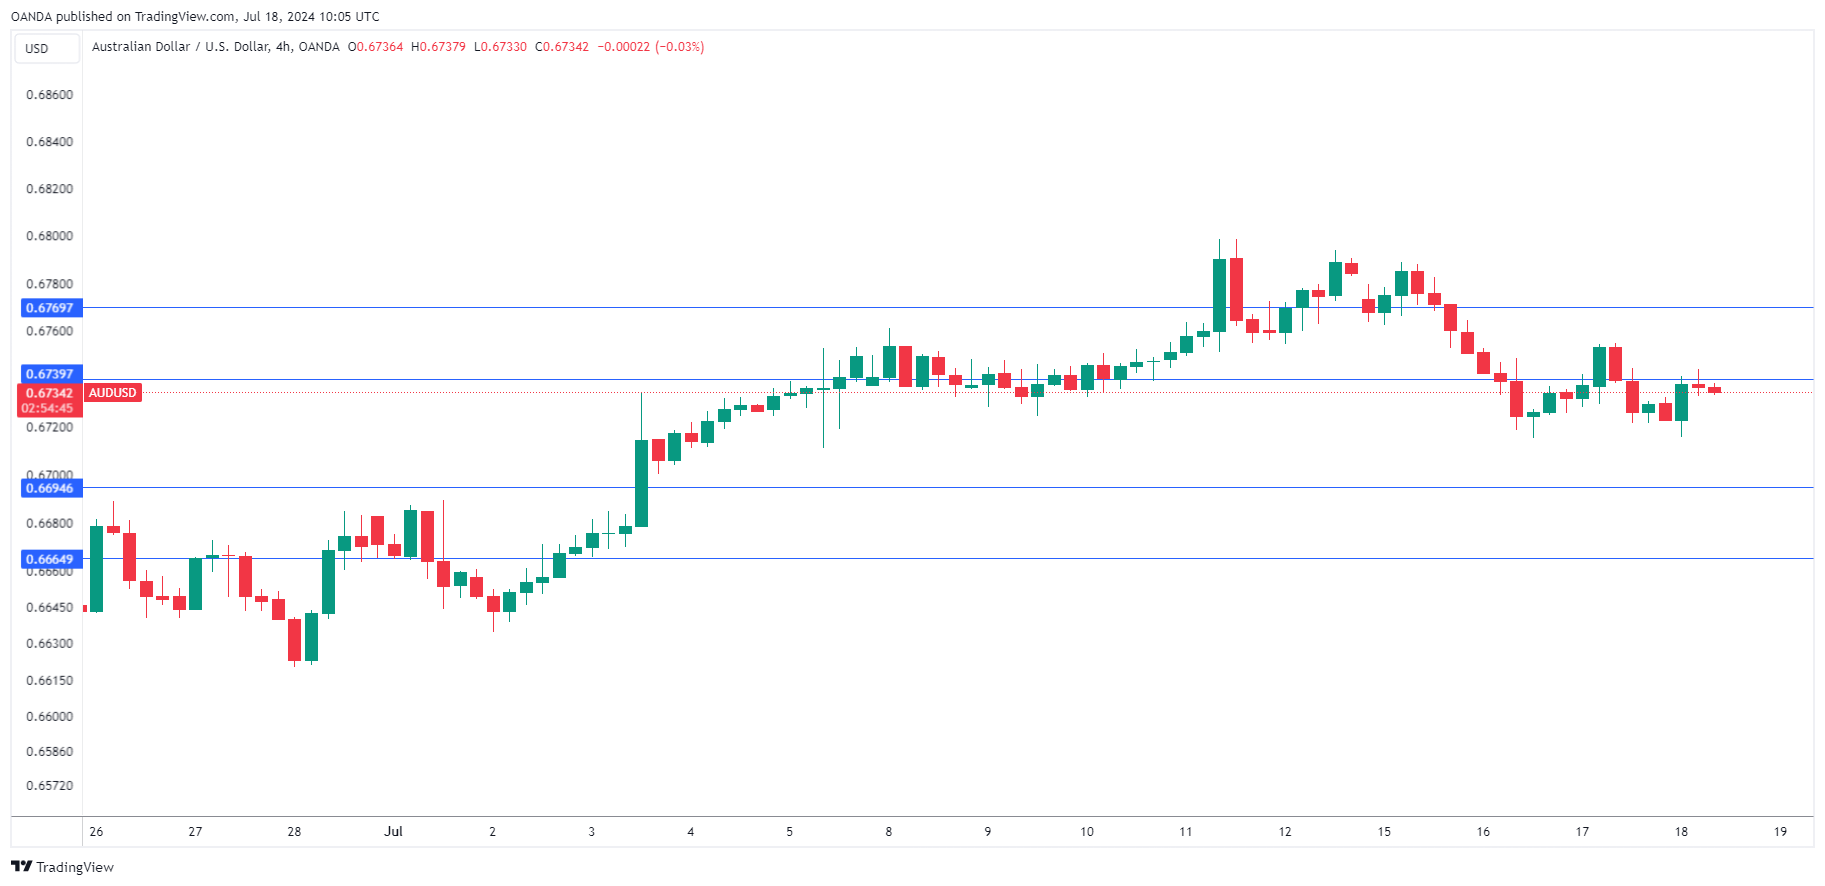
The Australian dollar is showing limited movement on Thursday. AUD/USD is trading at 0.6736 in the European session, up 0.10% on the day, up 0.1% at the time of writing.
Job growth shines but unemployment rises
Australia’s employment report for June was a mix, leaving investors scratching the heads. The Australian dollar didn’t show much reaction to the good news/bad news report.
Job growth surged to 50.2 thousand, up from a revised gain in May of 39.5 thousand and blowing past the market estimate of 20 thousand. Most of the gains were in full-time positions, pointing to a robust labor market. At the same time, the unemployment rate ticked up to 4.1%, up from the May reading of 4.0% which was also the market estimate. Unemployment has been at 4% or higher since April and the 4.1% rate matches a three-year high recorded in April and January of this year.
The Reserve Bank of Australia has stressed that its interest rate decisions will be based on key data. Inflation is the primary factor but policy makers also look at other indicators such as employment. What will the central bank do with this mixed report? On its own, the job numbers are unlikely to cause the RBA to shift policy and raise rates. We’ll have to wait for the CPI report which comes out on July 24, less than a week before the RBA decision. If inflation is higher than expected, it would support the case for a rate hike.
In the US, the markets will be keeping tabs on five FOMC members who will deliver remarks on Thursday and Friday. Investors will be hoping to get some insights on Fed rate policy, with the markets widely expecting a rate cut in September.
AUD/USD Technical
- AUD/USD is testing resistance at 0.6739. Above, there is resistance at 0.6769
- 0.6694 and 0.6664 are the next support levels