
Sample Category Title
EUR/CHF Daily Outlook
Daily Pivots: (S1) 0.9629; (P) 0.9692; (R1) 0.9726; More....
EUR/CHF's steep decline suggests that rebound from 0.9476 has completed at 0.9772 already. Intraday bias is back on the downside. Firm break of 38.2% retracement of 0.9476 to 0.9772 at 0.9659 will target 61.8% retracement at 0.9589 and possibly below. On the upside, above 0.9772 will resume the rally from 0.9476 towards 0.9928 high instead.
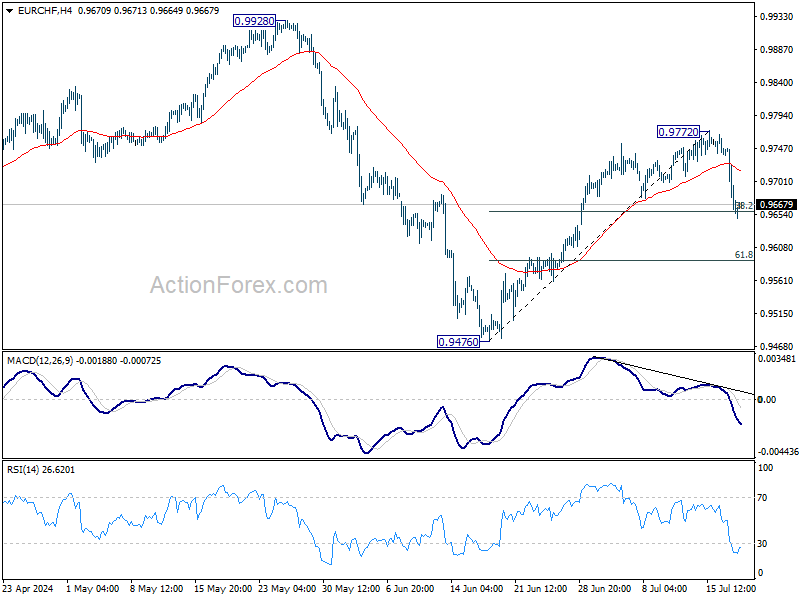
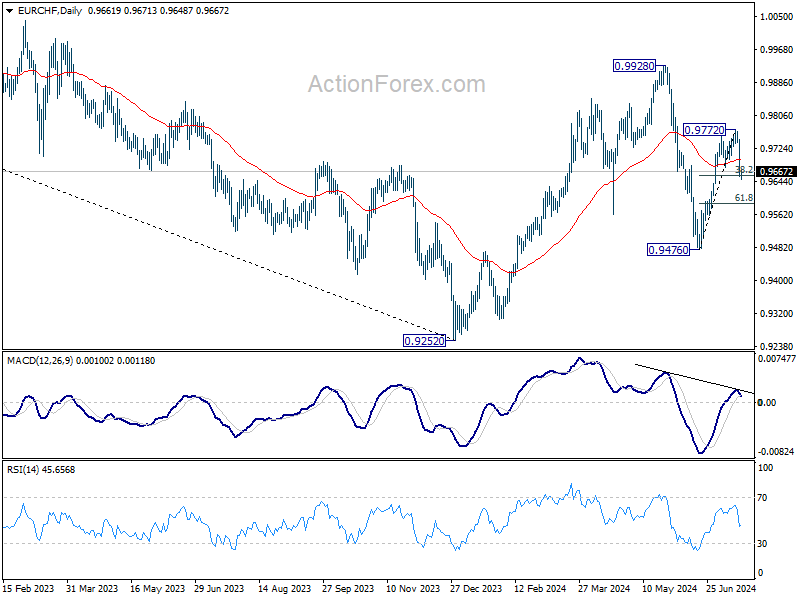
In the bigger picture, rebound from 0.9252 medium term bottom might not be completed yet. But even in case of resumption, strong resistance could emerge from 1.0095 to limit upside. Medium term outlook will be neutral at best as long as 1.0094 structural resistance holds. Meanwhile, break of 0.9476 will bring retest of 0.9252 low.
Euro Mixed as ECB Rate Decision Looms
While Euro maintains its strength against Dollar, its performance is more mixed against other major currencies. The market's attention is now focused on the upcoming ECB rate decision and press conference. It is broadly anticipated that ECB will maintain deposit rate at 3.75% and main refinancing rate at 4.25% correspondingly.
President Christine Lagarde is expected to continue signaling the possibility of further monetary easing, yet she will likely reiterate the bank's commitment to a data-dependent, meeting-by-meeting approach, without giving any concrete forward guidance.
Lagarde has previously highlighted that policymakers "need a lot of data," which isn't always available at every Governing Council meeting. This is seen as an indication the ECB will wait for comprehensive data and updated economic forecasts before making further moves, likely in September and December.
Market analysts are largely in consensus, predicting two additional quarter-point rate cuts for the year, although a minority foresees only one. Market sentiment aligns closely with this outlook, fully pricing in one cut and strongly leaning towards a second.
In terms of currency performance, New Zealand Dollar remains the weakest this week. The Kiwi continues to be under pressure as expectations for the first RBNZ rate cut have been moved forward from February to November. Australian Dollar also struggles, weighed down by a risk-off mood prevalent in Asia, with today's stronger-than-expected job data from Australia offering little relief. Meanwhile, Loonie is currently the third worst.
On the other hand, Swiss Franc is surprisingly the strongest performer this week, further boosted by its rebound against Euro. Japanese Yen holds the second spot, buoyed another round of alleged intervention by Japan yesterday. Euro stands strong in third place, while Dollar and Sterling are mixed in the middle of the pack.
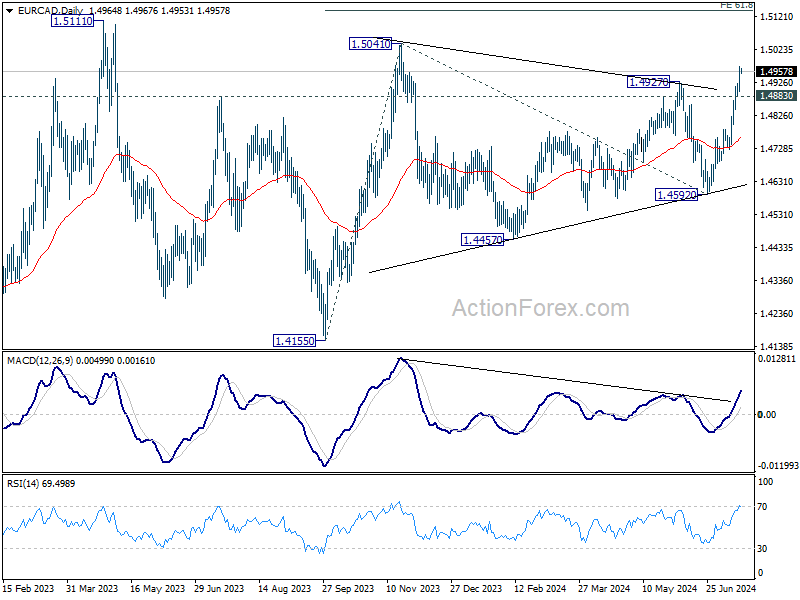
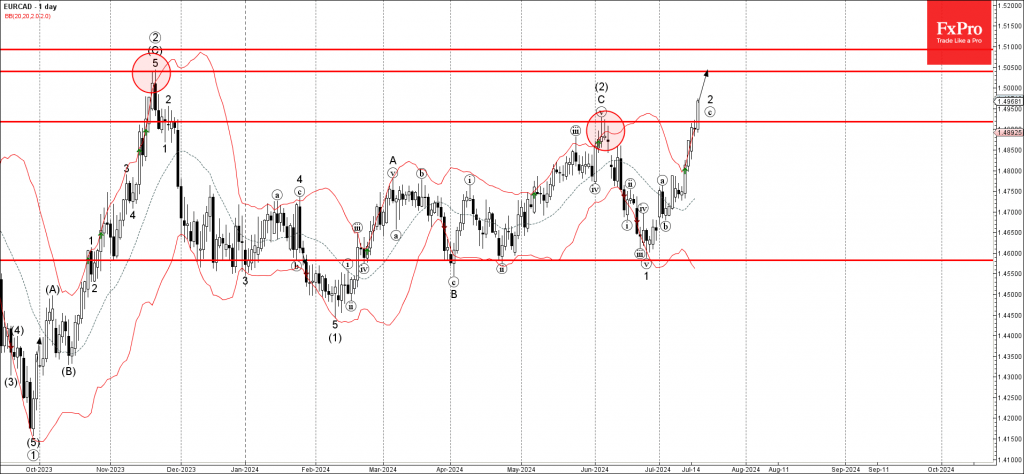
Technically, EUR/CAD's break of 1.4927 resistance this week argues that consolidation pattern from 1.5041 has completed with three waves to 1.4592 already. Further rally is in favor as long as 1.4883 minor support holds. Next target is 61.8% projection of 1.4155 to 1.5041 from 1.4592 at 1.5140. However, break of 1.4883 will delay the bullish case and bring more sideway trading first.
In Asia, at the time of writing, Nikkei is down -2.11%. Hong Kong HSI is up 0.57%. China Shanghai SSE is up 0.22%. Singapore Strait Times is down -0.62%. Japan 10-year JGB yield is up 0.0182 at 1.050. Overnight, DOW rose 0.59%. S&P 500 fell -1.39%. NASDAQ fell -2.77%. 10-year yield fell -0.021 to 4.146.
Japan's exports rise 5.4% yoy in June, but volume down -6.2% yoy
In June, Japan's exports grew by 5.4% yoy to JPY 9209B, falling short of 6.4% yoy expected. This marks the seventh consecutive monthly increase in export value. However, export volume fell by -6.2% yoy, indicating that the rise in export value was driven primarily by higher prices and falling Yen rather than increased demand.
By destination, shipments to the US increased by 11% yoy. Exports to China grew by 7.2% yoy, marking the seventh consecutive month of growth. Overall, exports to Asia rose by 7.7% yoy, but exports to the EU declined by -13.4% yoy.
Imports increased by 3.2% yoy to JPY 8985B, below the expected 9.3% yoy. Import volume also decreased by -8.9% yoy. For June, Japan recorded a trade surplus of JPY 224B.
In seasonally adjusted terms, exports declined by -0.2% mom h to JPY 8961B, while imports rose by 1.6% mom to JPY 9778B, leading to a trade deficit of JPY -817B.
Australia's employment grows 50.2k, labor market remains relatively tight
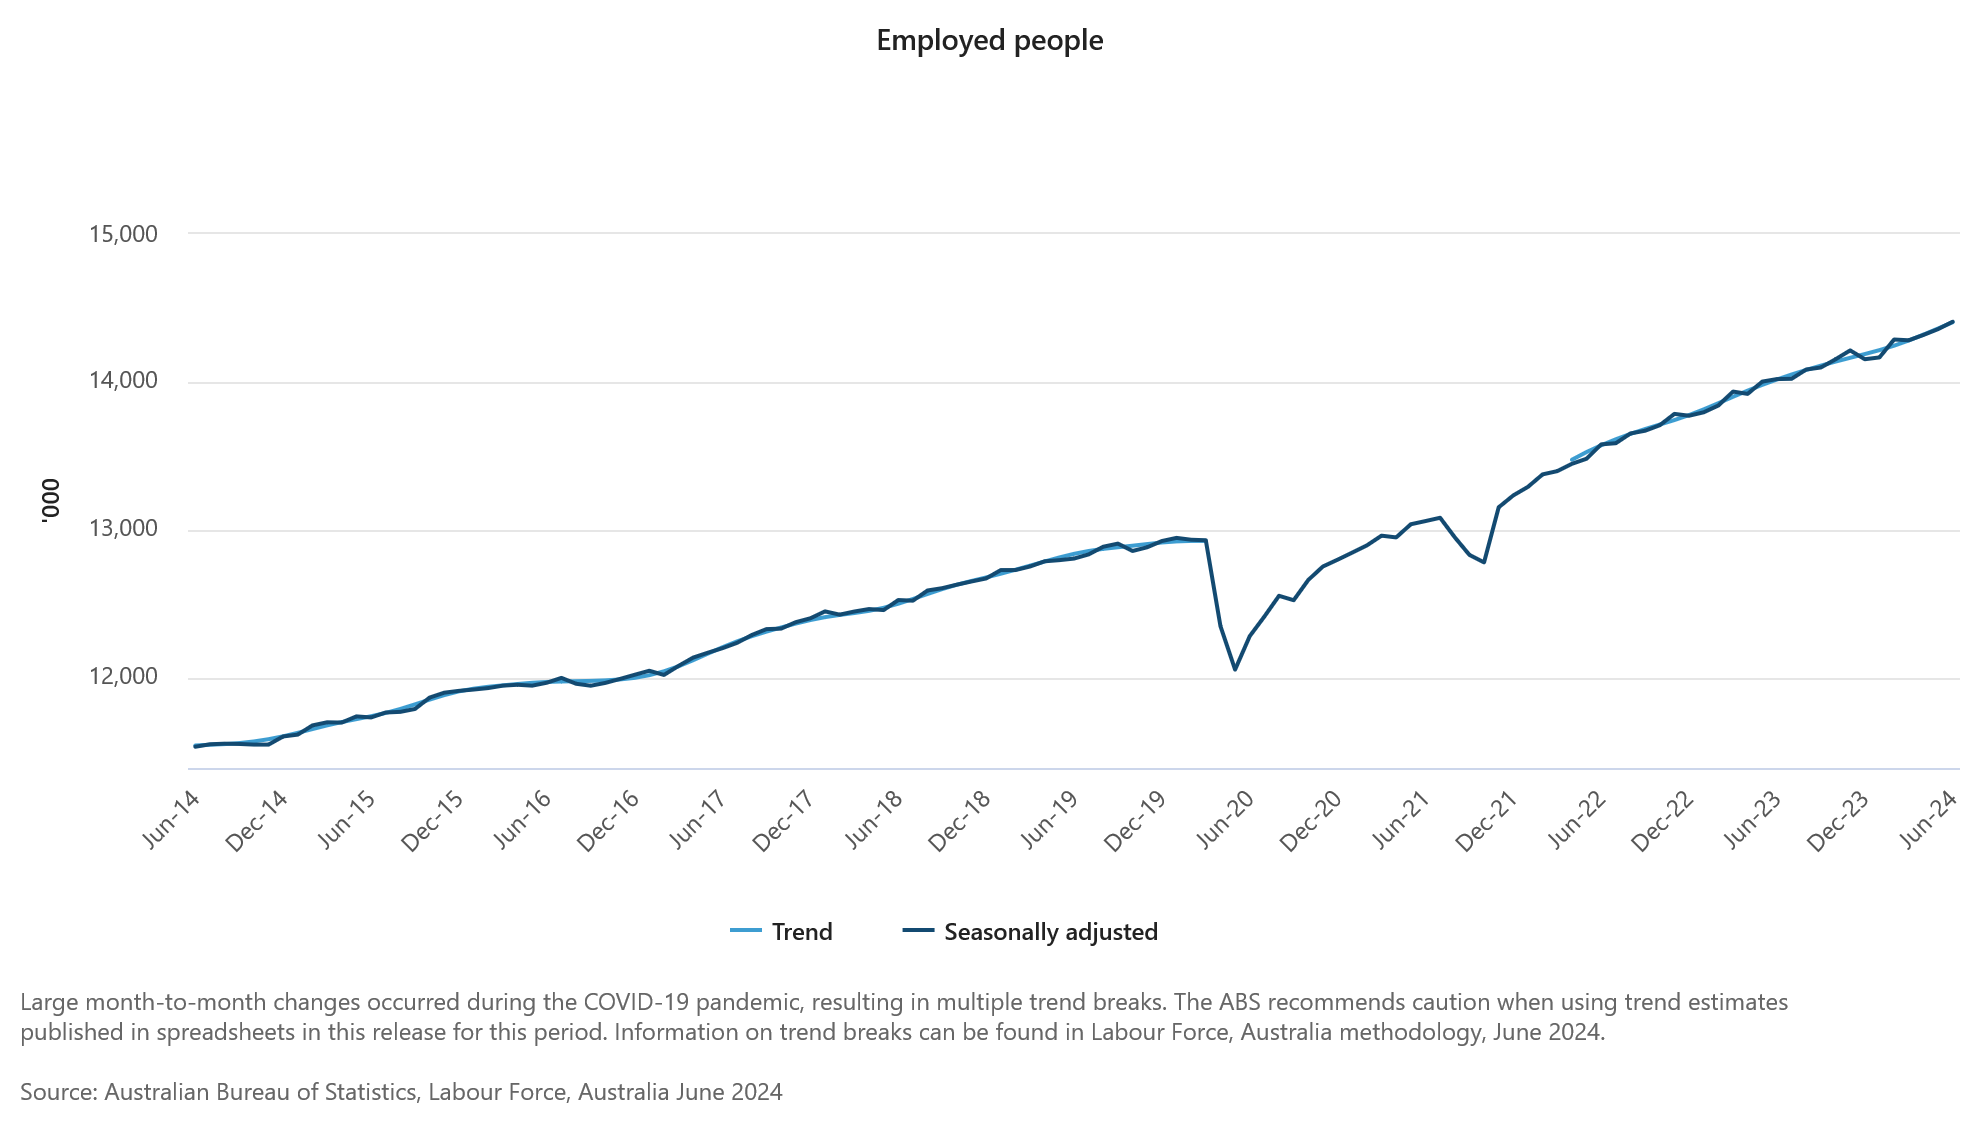
Australia's employment figures for June showed a strong increase, with employment rising by 50.2k, well above the expected 20.0k. This growth included 43.3k full-time jobs and 6.8k part-time jobs.
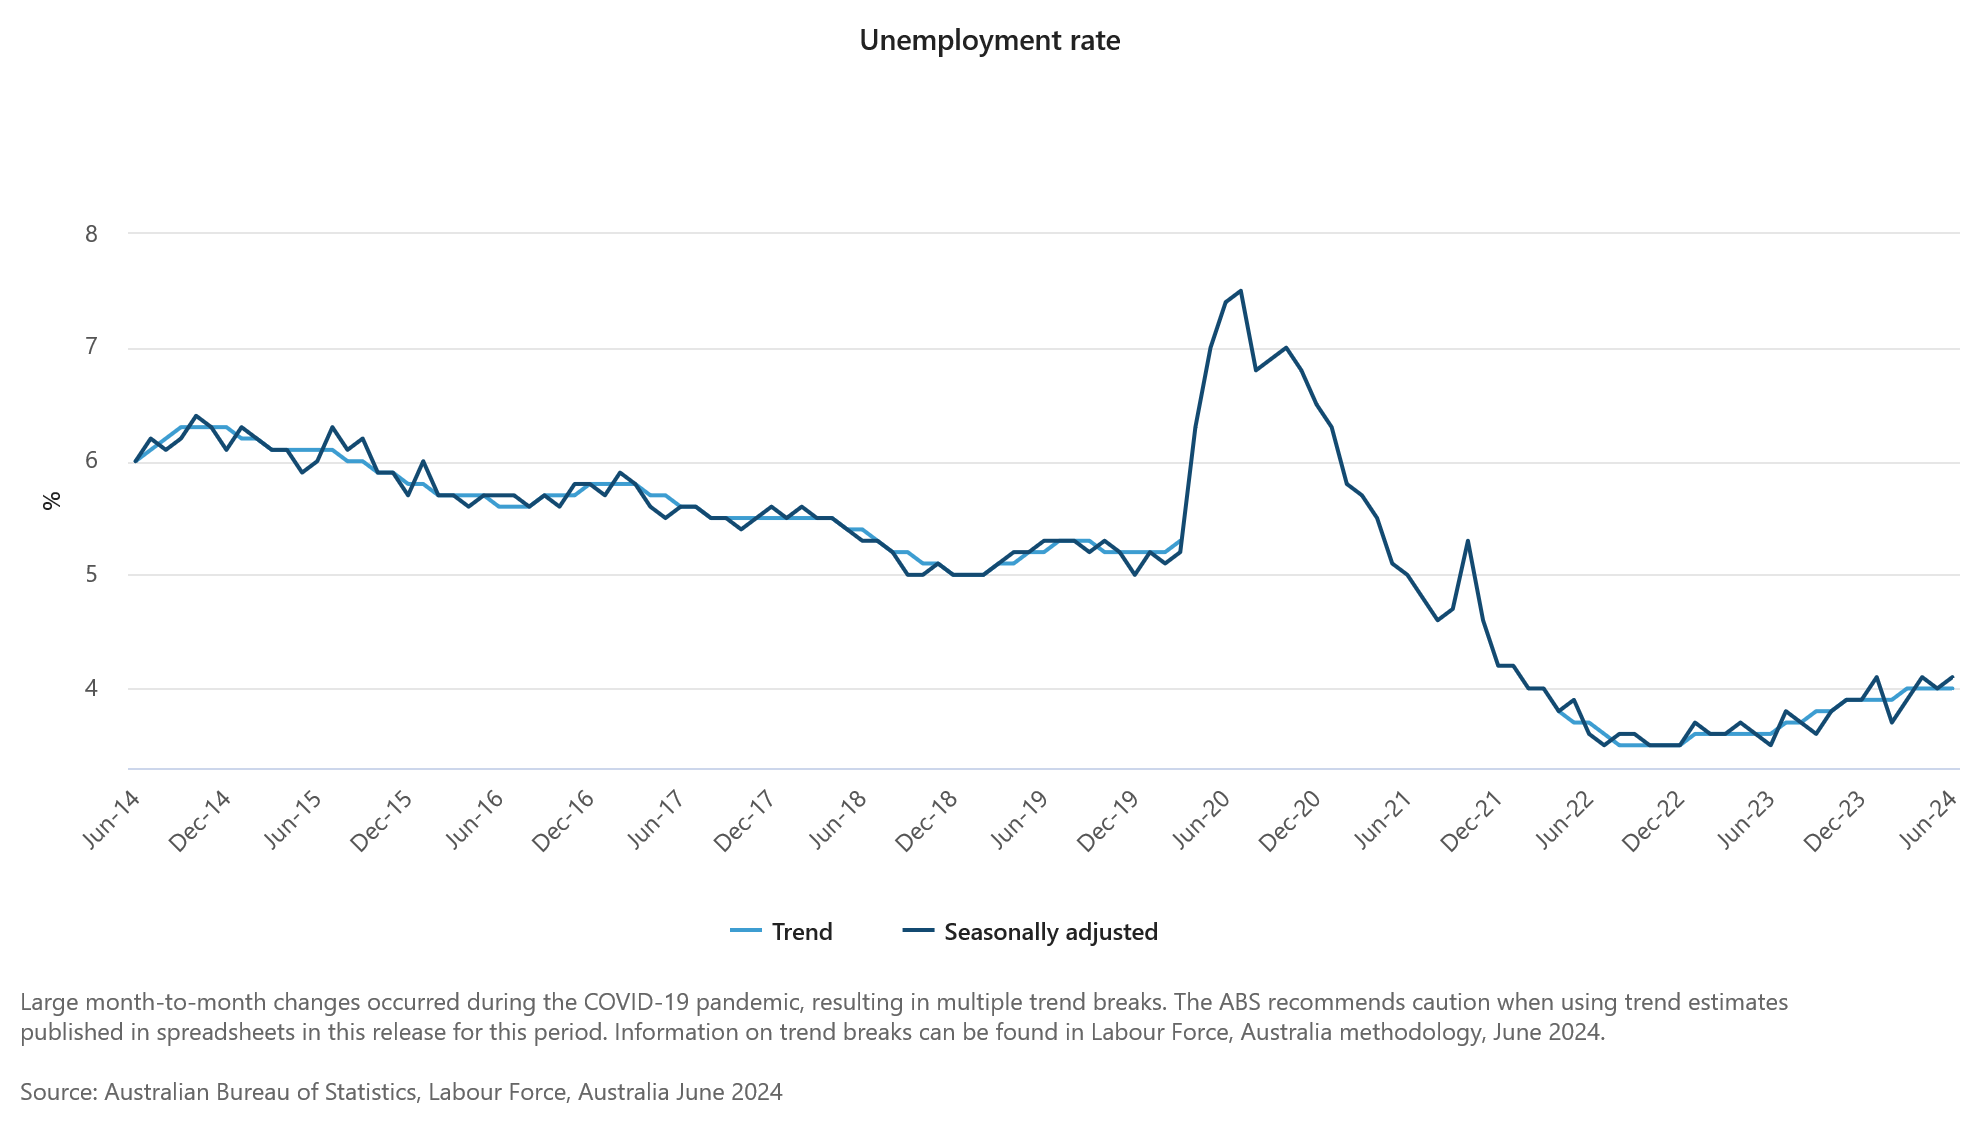
Unemployment rate edged up from 4.0% to 4.1%, in line with expectations. Participation rate also increased from 66.8% to 66.9%, just 0.1% below the historical high of 67.0% set in November 2023. Additionally, the employment-to-population ratio rose by 0.1% to 64.2%, close to its historical peak of 64.4% from November 2023. Monthly hours worked increased by 0.8% mom.
Bjorn Jarvis, head of labour statistics at ABS, observed that both the employment-to-population ratio and the participation rate are still near their 2023 highs. He added that together the persistently high level of job vacancies indicates the labor market "remains relatively tight", even though unemployment rate has been above 4.0% since April.
Australia's NAB business confidence ticks up to -1 in Q2, conditions tumbles to 5
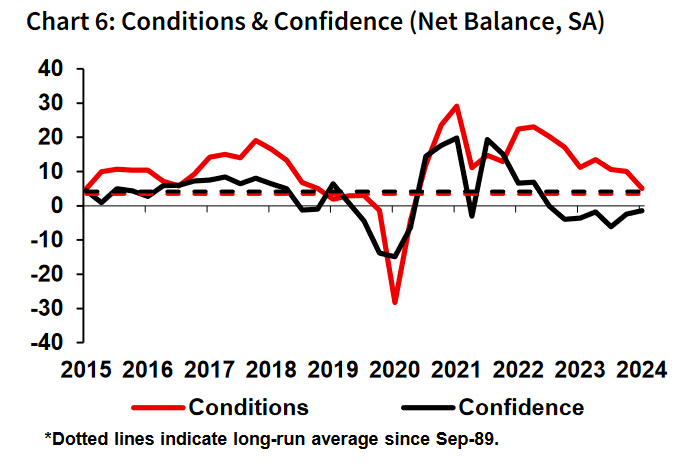
Australia's NAB Quarterly Business Confidence improved marginally, rising from -2 to -1 in Q2. However, business conditions overall weakened, with the index falling from 10 to 5. Trading conditions dropped from 15 to 9, profitability conditions fell from 8 to 2, and employment conditions decreased from 7 to 5.
Cost pressures persisted, with labor costs growing at 1.2%, unchanged from the previous quarter, and purchase costs growing at 0.9%, down from 1.1%. Price growth measures showed some relief, with final product price growth at 0.6% quarter-on-quarter, down from 0.8%. Retail price growth eased to 0.7% from 0.9%, and recreation and personal services price growth slowed to 0.6% from 0.8%.
NAB Chief Economist Alan Oster noted that the survey shows mixed results on cost pressures and prices. While materials cost growth is improving, labor costs remain high. He highlighted that 30% of firms are facing significant challenges with labor availability, and wage costs continue to be a major concern.
Looking ahead
Swiss trade balance and UK emplooyment data will be released in European session. But main focus will be on ECB rate decision. Later in the day, US will release jobless claims as usual on a Thursday.
EUR/CHF Daily Outlook
Daily Pivots: (S1) 0.9629; (P) 0.9692; (R1) 0.9726; More....
EUR/CHF's steep decline suggests that rebound from 0.9476 has completed at 0.9772 already. Intraday bias is back on the downside. Firm break of 38.2% retracement of 0.9476 to 0.9772 at 0.9659 will target 61.8% retracement at 0.9589 and possibly below. On the upside, above 0.9772 will resume the rally from 0.9476 towards 0.9928 high instead.
In the bigger picture, rebound from 0.9252 medium term bottom might not be completed yet. But even in case of resumption, strong resistance could emerge from 1.0095 to limit upside. Medium term outlook will be neutral at best as long as 1.0094 structural resistance holds. Meanwhile, break of 0.9476 will bring retest of 0.9252 low.
Economic Indicators Update
| GMT | Ccy | Events | Actual | Forecast | Previous | Revised |
|---|---|---|---|---|---|---|
| 23:50 | JPY | Trade Balance (JPY) Jun | -0.82T | -0.89T | -0.62T | -0.64T |
| 01:30 | AUD | Employment Change Jun | 50.2K | 20.0K | 39.7K | 39.5K |
| 01:30 | AUD | Unemployment Rate Jun | 4.10% | 4.10% | 4.00% | |
| 06:00 | CHF | Trade Balance (CHF) Jun | 5.05B | 5.81B | ||
| 06:00 | GBP | Claimant Count Change Jun | 23.4K | 50.4K | ||
| 06:00 | GBP | ILO Unemployment Rate (3M) May | 4.40% | 4.40% | ||
| 06:00 | GBP | Average Earnings Including Bonus 3M/Y May | 5.70% | 5.90% | ||
| 06:00 | GBP | Average Earnings Excluding Bonus 3M/Y May | 5.70% | 6.00% | ||
| 12:15 | EUR | ECB Deposit Rate | 3.75% | 3.75% | ||
| 12:15 | EUR | ECB Main Refinancing Rate | 4.25% | 4.25% | ||
| 12:30 | USD | Initial Jobless Claims (Jul 12) | 225K | 222K | ||
| 12:30 | USD | Philadelphia Fed Manufacturing Jul | 2.9 | 1.3 | ||
| 12:45 | EUR | ECB Press Conference | ||||
| 14:30 | USD | Natural Gas Storage | 55B | 65B |
Australia’s NAB business confidence ticks up to -1 in Q2, conditions tumbles to 5
Australia's NAB Quarterly Business Confidence improved marginally, rising from -2 to -1 in Q2. However, business conditions overall weakened, with the index falling from 10 to 5. Trading conditions dropped from 15 to 9, profitability conditions fell from 8 to 2, and employment conditions decreased from 7 to 5.
Cost pressures persisted, with labor costs growing at 1.2%, unchanged from the previous quarter, and purchase costs growing at 0.9%, down from 1.1%. Price growth measures showed some relief, with final product price growth at 0.6% quarter-on-quarter, down from 0.8%. Retail price growth eased to 0.7% from 0.9%, and recreation and personal services price growth slowed to 0.6% from 0.8%.
NAB Chief Economist Alan Oster noted that the survey shows mixed results on cost pressures and prices. While materials cost growth is improving, labor costs remain high. He highlighted that 30% of firms are facing significant challenges with labor availability, and wage costs continue to be a major concern.
Full Australia NAB quarterly business confidence release here.
Australia’s employment grows 50.2k, labor market remains relatively tight
Australia's employment figures for June showed a strong increase, with employment rising by 50.2k, well above the expected 20.0k. This growth included 43.3k full-time jobs and 6.8k part-time jobs.
Unemployment rate edged up from 4.0% to 4.1%, in line with expectations. Participation rate also increased from 66.8% to 66.9%, just 0.1% below the historical high of 67.0% set in November 2023. Additionally, the employment-to-population ratio rose by 0.1% to 64.2%, close to its historical peak of 64.4% from November 2023. Monthly hours worked increased by 0.8% mom.
Bjorn Jarvis, head of labour statistics at ABS, observed that both the employment-to-population ratio and the participation rate are still near their 2023 highs. He added that together the persistently high level of job vacancies indicates the labor market "remains relatively tight", even though unemployment rate has been above 4.0% since April.
Japan’s exports rise 5.4% yoy in June, but volume down -6.2% yoy
In June, Japan's exports grew by 5.4% yoy to JPY 9209B, falling short of 6.4% yoy expected. This marks the seventh consecutive monthly increase in export value. However, export volume fell by -6.2% yoy, indicating that the rise in export value was driven primarily by higher prices and falling Yen rather than increased demand.
By destination, shipments to the US increased by 11% yoy. Exports to China grew by 7.2% yoy, marking the seventh consecutive month of growth. Overall, exports to Asia rose by 7.7% yoy, but exports to the EU declined by -13.4% yoy.
Imports increased by 3.2% yoy to JPY 8985B, below the expected 9.3% yoy. Import volume also decreased by -8.9% yoy. For June, Japan recorded a trade surplus of JPY 224B.
In seasonally adjusted terms, exports declined by -0.2% mom h to JPY 8961B, while imports rose by 1.6% mom to JPY 9778B, leading to a trade deficit of JPY -817B.
Crude Oil Targets Fresh Gains: Key Factors to Watch
Key Highlights
- Crude oil prices started a fresh increase from the $80.20 support.
- A major bearish trend line is forming with resistance at $82.95 on the 4-hour chart.
- Bitcoin is consolidating gains above the $63,500 pivot zone.
- EUR/USD extended its increase above the 1.0910 resistance.
Crude Oil Price Technical Analysis
After a downside correction, Crude oil prices found support above $80.00. The price formed a base near $80.20 and started a fresh increase.
Looking at the 4-hour chart of XTI/USD, the price climbed above the $81.20 resistance and settled above the 200 simple moving average (green, 4-hour). There was a move above the 50% Fib retracement level of the downward move from the $83.80 swing high to the $80.21 low.
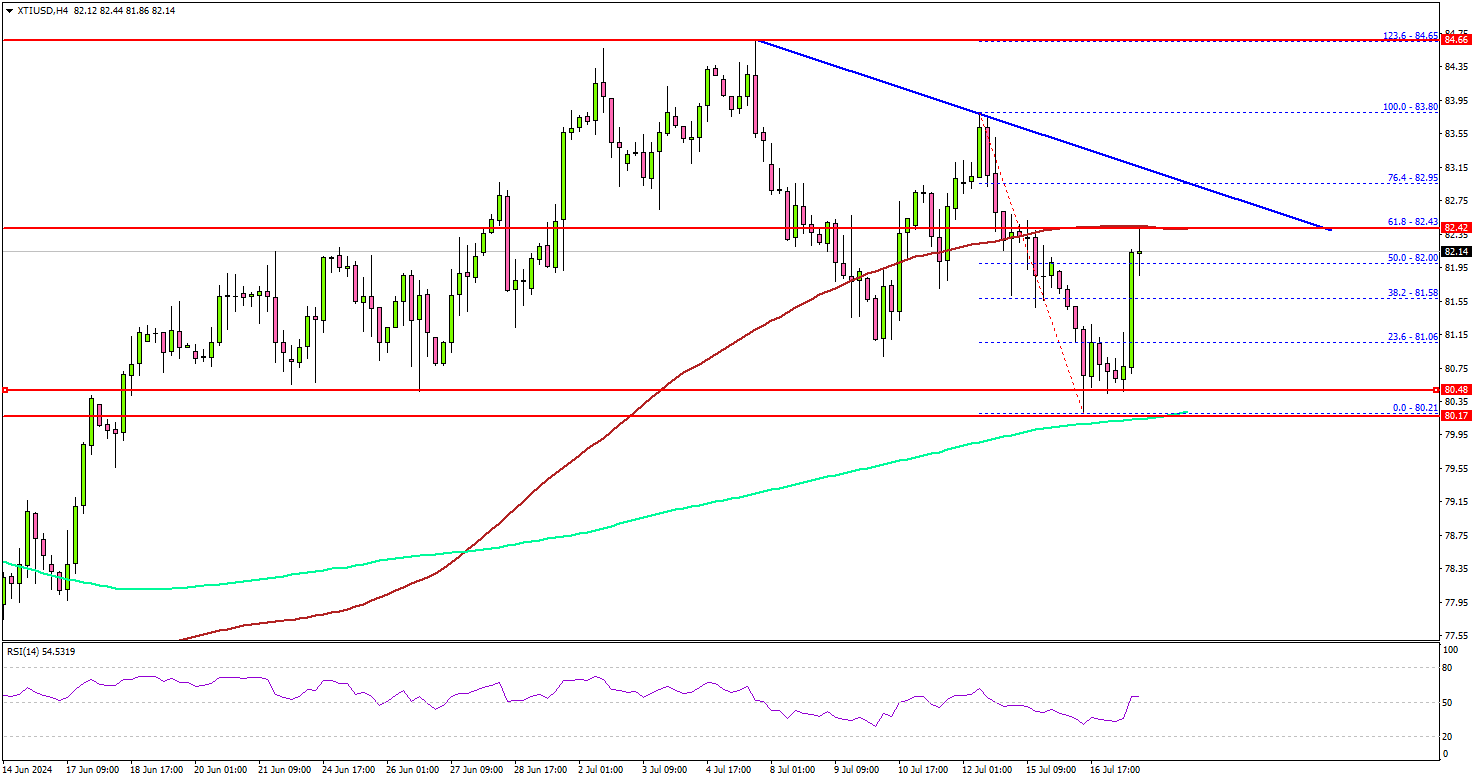
The price tested the 100 simple moving average (red, 4-hour) and the 61.8% Fib retracement level of the downward move from the $83.80 swing high to the $80.21 low.
On the upside, the price is facing hurdles near the $82.50 level. There is also a major bearish trend line forming with resistance at $82.95 on the same chart.
The next major resistance is near the $83.20 zone, above which the price may perhaps accelerate higher. In the stated case, it could even visit the $84.65 resistance.
If not, the price might start another decline. The first major support on the downside is near the $81.20 level. The next major support is $80.20. Any more losses might send oil prices toward $78.80 in the coming sessions.
Looking at EUR/USD, the bulls remained in action, and they were able to push the pair above the 1.0910 resistance zone.
Economic Releases to Watch Today
- ECB Interest Rate Decision - Forecast 3.75%, versus 3.75% previous.
- US Initial Jobless Claims - Forecast 230K, versus 222K previous.
GBPJPY Wave Analysis
- GBPJPY reversed from the resistance area
- Likely to fall to support level 201.65
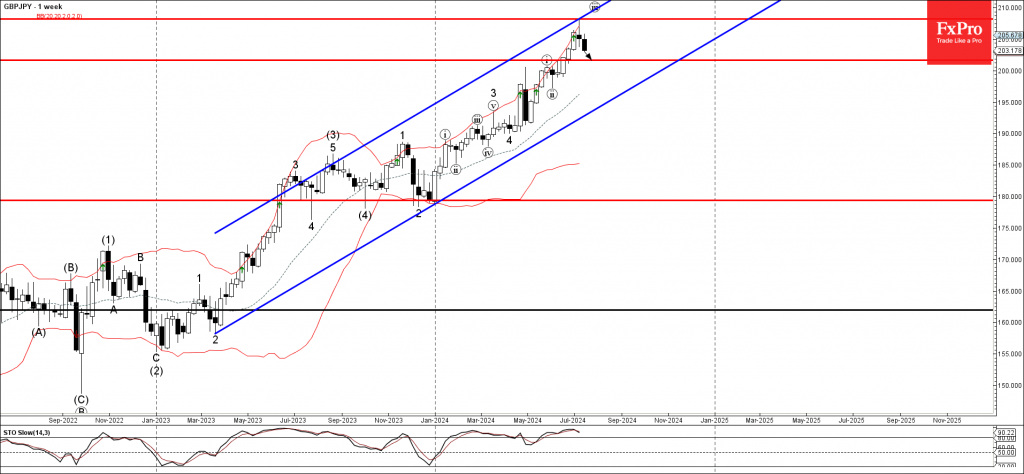
GBPJPY currency pair continues to fall after the price reversed down from the resistance area located between the upper trendline of the weekly up channel from last year and the upper weekly Bollinger Band.
The downward reversal from this resistance area created the weekly Japanese candlesticks reversal pattern Doji.
Given the overbought weekly Stochastic, strongly bearish sterling sentiment, and the equally strong yen optimism seen recently, GBPJPY currency pair can be expected to fall further to the next support level 201.65.
EURCAD Wave Analysis
- EURCAD broke key resistance level 1.4920
- Likely to rise to resistance level 1.5040
EURCAD currency pair recently broke above the key resistance level 1.4920, which stopped the previous correction (2) at the start of June.
The breakout of the resistance level 1.4920 greatly accelerated the active impulse wave c of the ABC correction 2 from the end of last month.
Given the rising euro bullish sentiment, EURCAD currency pair can be expected to rise further to the next resistance level 1.5040 (former multi-month high from November).
Fed’s Waller suggests rate cuts may be nearing
In a speech today, Fed Governor Christopher Waller stated that Fed is "getting closer" to the time when a cut in the policy rate is warranted. He noted that Q2 data on inflation and the labor market has moderated, suggesting that "progress toward price stability has resumed." Waller believes the current data align with the goal of achieving a soft landing and will be watching for further data in the coming months to support this view.
Waller outlined three scenarios for the future. The first, and most optimistic, scenario is that Fed continues to receive "very favorable" inflation data, leading to a "nice run" that began in May. In this case, Waller could "envision a rate cut in the not-too-distant future."
The second scenario, which Waller considers "more likely to occur," involves inflation data coming in "uneven" but still indicating overall progress in disinflation. Under this scenario, a rate cut in the near future is "more uncertain."
The third scenario involves a "significant resurgence in inflation" in the second half of the year, but Waller assigns a "low probability" to this outcome.
Given his belief that the first two scenarios are the most probable, Waller concludes that the "time to lower the policy rate is drawing closer."