Sample Category Title
Gold Shines at Fresh All-Time High
- Gold ends sideways trajectory; enters uncharted territory
- Short-term bias positive but overbought signals suggest some caution
- A close above 2,480 might be necessary to boost buying confidence
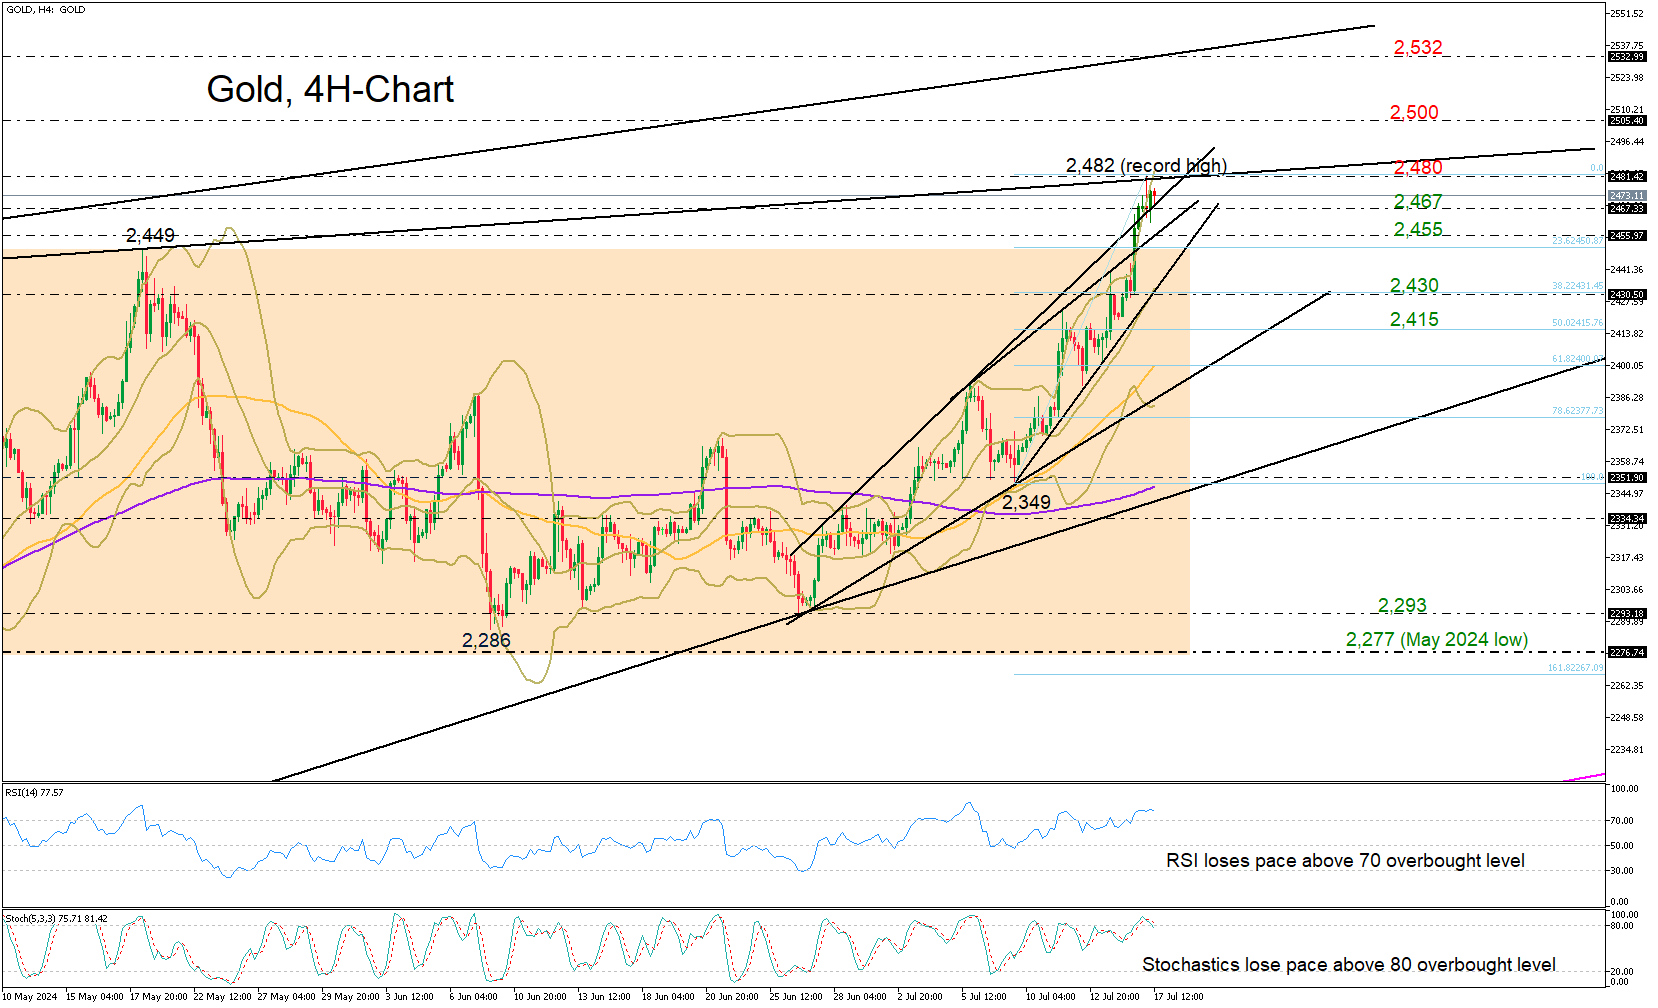
Gold bulls powered ahead to finally exit the three-month range and chart an all-time high of 2,482 on Wednesday.
The bullish breakout has placed the precious metal back into an uptrend, which may continue to attract buyers in the upcoming sessions. However, caution is necessary as the price has already exceeded the upper Bollinger band, and both the RSI and stochastic oscillator are currently in the overbought zone on the four-hour chart.
Perhaps a close above the ascending line, which connects the April and May highs at 2,480, could be the key for an advance towards the 2,500 psychological level. Further up, the bulls could face another critical battle near the resistance line drawn from August 2022 around 2,532.
Should the price retreat beneath 2,467, initial support could emerge near 2,455. Failure to pivot there could upset traders, motivating a decline towards the 20-period SMA (middle Bollinger band) at 2,430 and back into the previous neutral zone. Note that the 38.2% Fibonacci retracement of the upleg started on July 9 is in the region. Hence, another violation there could activate more selling, likely towards the 50% Fibonacci of 2,415.
Overall, although gold’s positive outlook has returned, traders might wait for a breakthrough above 2,480 to reach the 2,500 milestone.
GBP/USD Outlook: Cable Rises Above 1.3000 and Hits New 2024 High
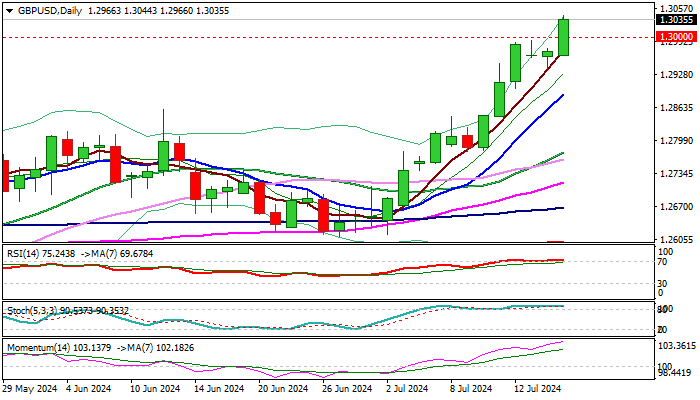
Cable surged through psychological 1.30 barrier and hit its highest in one year on Wednesday, after hotter than expected UK June inflation data tempered expectations for first BoE rate cut in next month policy meeting.
Fresh strength after a two-day pause for consolidation signals continuation of broader uptrend however, close above 1.30 level is required to confirm signal and focus targets at 1.3050 and 1.3100/20.
Strongly overbought daily studies warn that bulls may lose traction, with limited dips (ideally to be contained by 1.30 support and not to exceed 1.2940 higher low) to offer better levels to re-enter bullish market.
Res: 1.3050; 1.3100; 1.3120; 1.3141.
Sup: 1.3000; 1.2966; 1.2940; 1.2893.
GBP Looks Stronger Than USD Thanks to Inflation
A batch of inflation statistics from the UK seems to have fuelled the Pound’s rally against the Dollar and Euro, which has been going strong since the beginning of the month.
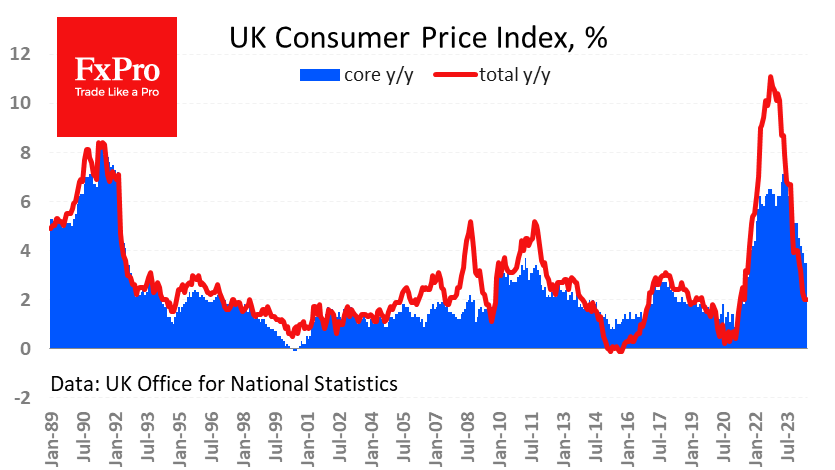
Consumer inflation remained at 2.0%, with the core index at 3.5% y/y. At the same time, positive monthly price trends persisted, adding 0.1% in June versus a commensurate decline in the US. Inflationary processes in the UK look livelier than in the US.
The day before, markets were roughly evenly pricing in the chances of a rate cut on 1 August. Judging by the market reaction, traders are now inclined to extend the pause, expecting the easing cycle to start in September.
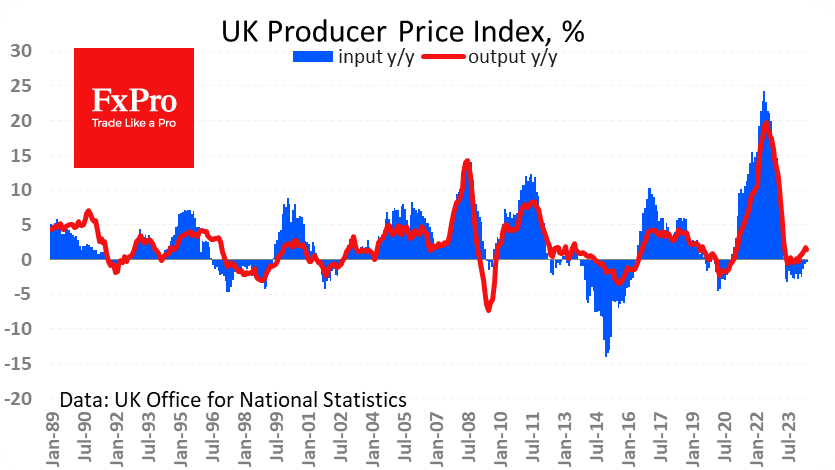
At the same time, we continue to pay attention to disinflationary developments at the producer price level. The Input PPI lost 0.8% in June after a 0.6% decline in May. On a year-over-year basis, it has remained in negative territory for the past 13 months. The Output PPI fell 0.3% in June (the first drop since May 2023). Its growth rate has slowed from 1.7% to 1.4%.
However, it’s easy to spot how inflation builds up as goods move to UK consumers, from a 0.3% fall in Input PPI to a 1.4% rise in Output PPI, to 2% for CPI and 2.9% for Retail Prices Index.
Housing prices also showed a jump in growth rate. According to an estimate released today, house price growth accelerated to 2.3% y/y in May from 1.3% a month earlier. According to the index, home values are now 1.2% below their peak of two years ago.
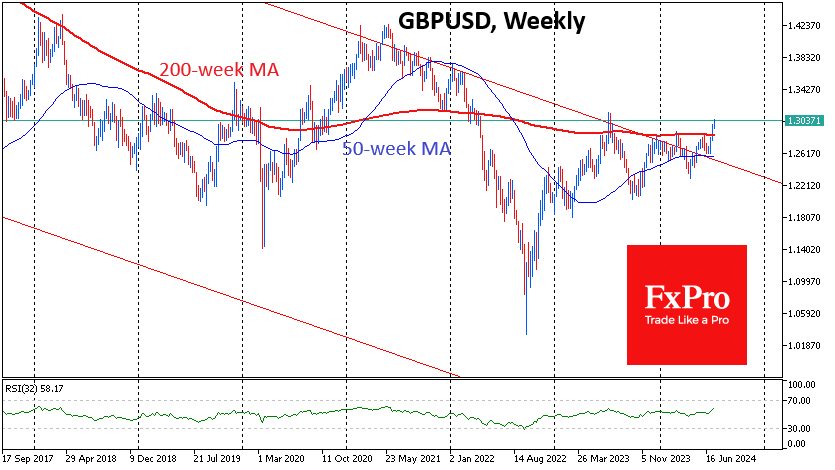
Technically, GBPUSD is enjoying gains, having made a breakout of important resistance. With a strong move last week, it managed to break above the 200-week average, and earlier this year, we saw a break above the resistance of the long-term downtrend channel. That is, the GBP broke the downward trend against the USD since 2008. This sets GBPUSD up for a return to the 2021 cyclical highs at 1.37-1.42 before the end of the year.
Fed’s Williams sees positive signs in inflation trend, awaiting more data
New York Fed President John Williams, in an interview with the Wall Street Journal, indicated that recent inflation readings over the past three months are "getting us closer to a disinflationary trend that we're looking for," noting these as "positive signs."
However, Williams emphasized the need for "more data to gain further confidence" that inflation is moving sustainably toward the Fed's 2% goal. He expressed satisfaction with the current policy stance, stating, "I feel like the stance of policy right now is working well."
Williams suggested that if the favorable data trend continues, he would gain "greater confidence that inflation is moving sustainably to 2%."
AUD/USD: Market Stabilizes Amid Rate Cut Expectations
The Australian dollar has stabilized against the US dollar, currently trading around 0.6738. This follows a period of decline influenced by ongoing speculations regarding the US Federal Reserve's impending policy actions. Expectations are set for the Fed to initiate rate cuts starting in September, with an additional reduction anticipated before the year's end.
Fed Chairman Jerome Powell recently reinforced these expectations by indicating that the regulator might not wait for inflation to hit the 2% target before reducing rates, responding to the current trajectory of the consumer price index.
Conversely, the Reserve Bank of Australia (RBA) is perceived to be trailing its international counterparts in easing monetary policy, which has contributed to the subdued performance of the AUD.
Later this week, Australia is slated to release its employment statistics. These figures are crucial as they provide a tangible measure of the labour market's health and could potentially influence the RBA's policy decisions moving forward.
AUD/USD technical analysis
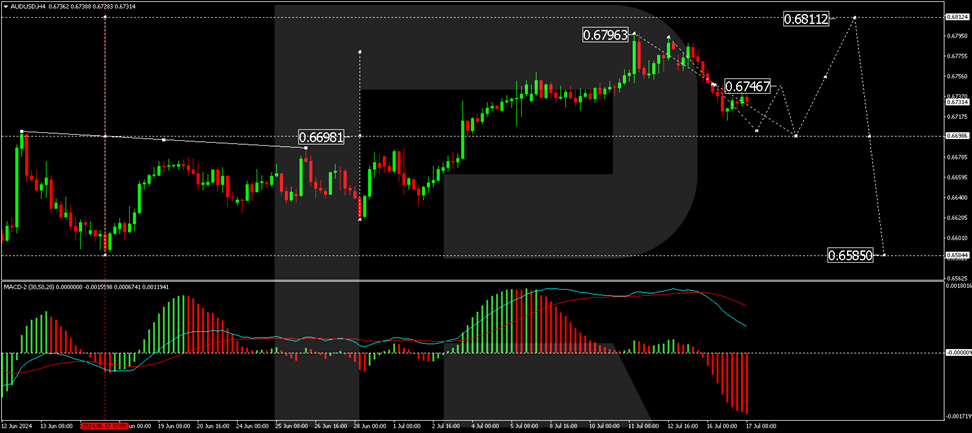
The AUD/USD pair is currently developing a downward movement towards the 0.6703 level, which serves as a local target. Upon reaching this level, a corrective movement upwards to 0.6747 is expected, which will test this resistance from below. Following this correction, the market may resume its downward trend towards 0.6696, completing the current correction wave before potentially initiating a new upward trajectory towards 0.6811. The MACD indicator supports this outlook, with its signal line indicating a downward trend despite being above the zero mark.
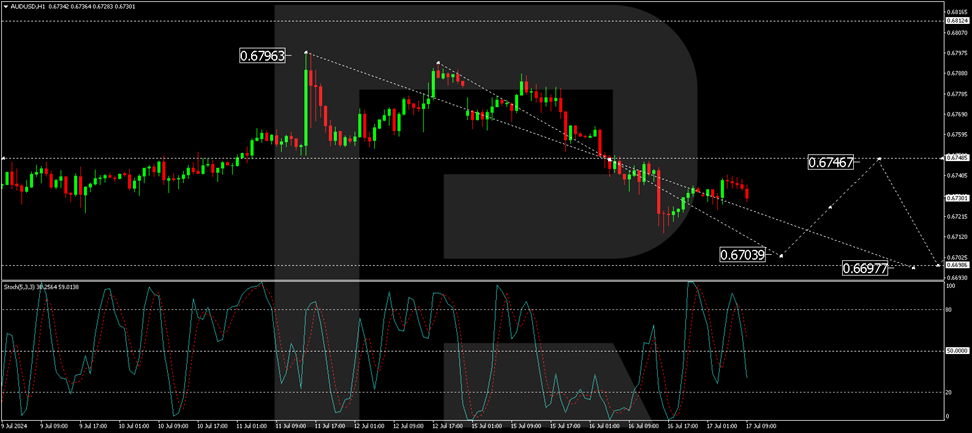
On the hourly chart, the AUD/USD has established a consolidation range around the 0.6747 level. With a downward exit, the pair continues to develop a downward structure aiming for the 0.6704 level. After this target is achieved, an upward correction to retest 0.6747 is anticipated. Subsequently, a new decline towards 0.6696 may occur. The Stochastic oscillator suggests that the current upward momentum is waning, with its signal line poised to drop from above 80, indicating potential for further declines.
Investors and traders should monitor these levels closely, especially in light of forthcoming economic data from Australia, which could significantly sway market sentiment and currency valuation.
Dollar Index (DXY) Elliott Wave Calling the Decline After 3 Waves Bounce
In this technical article we’re going to take a quick look at the Elliott Wave charts of Dollar Index DXY , published in members area of the website. As our members know, Dollar has given us recovery against the 105.21 peak. It found sellers after 3 waves pattern and made the decline toward new lows as expected. Consequently, we expect more short-term weakness in the near term. In the further text, we are going to explain the wave count.
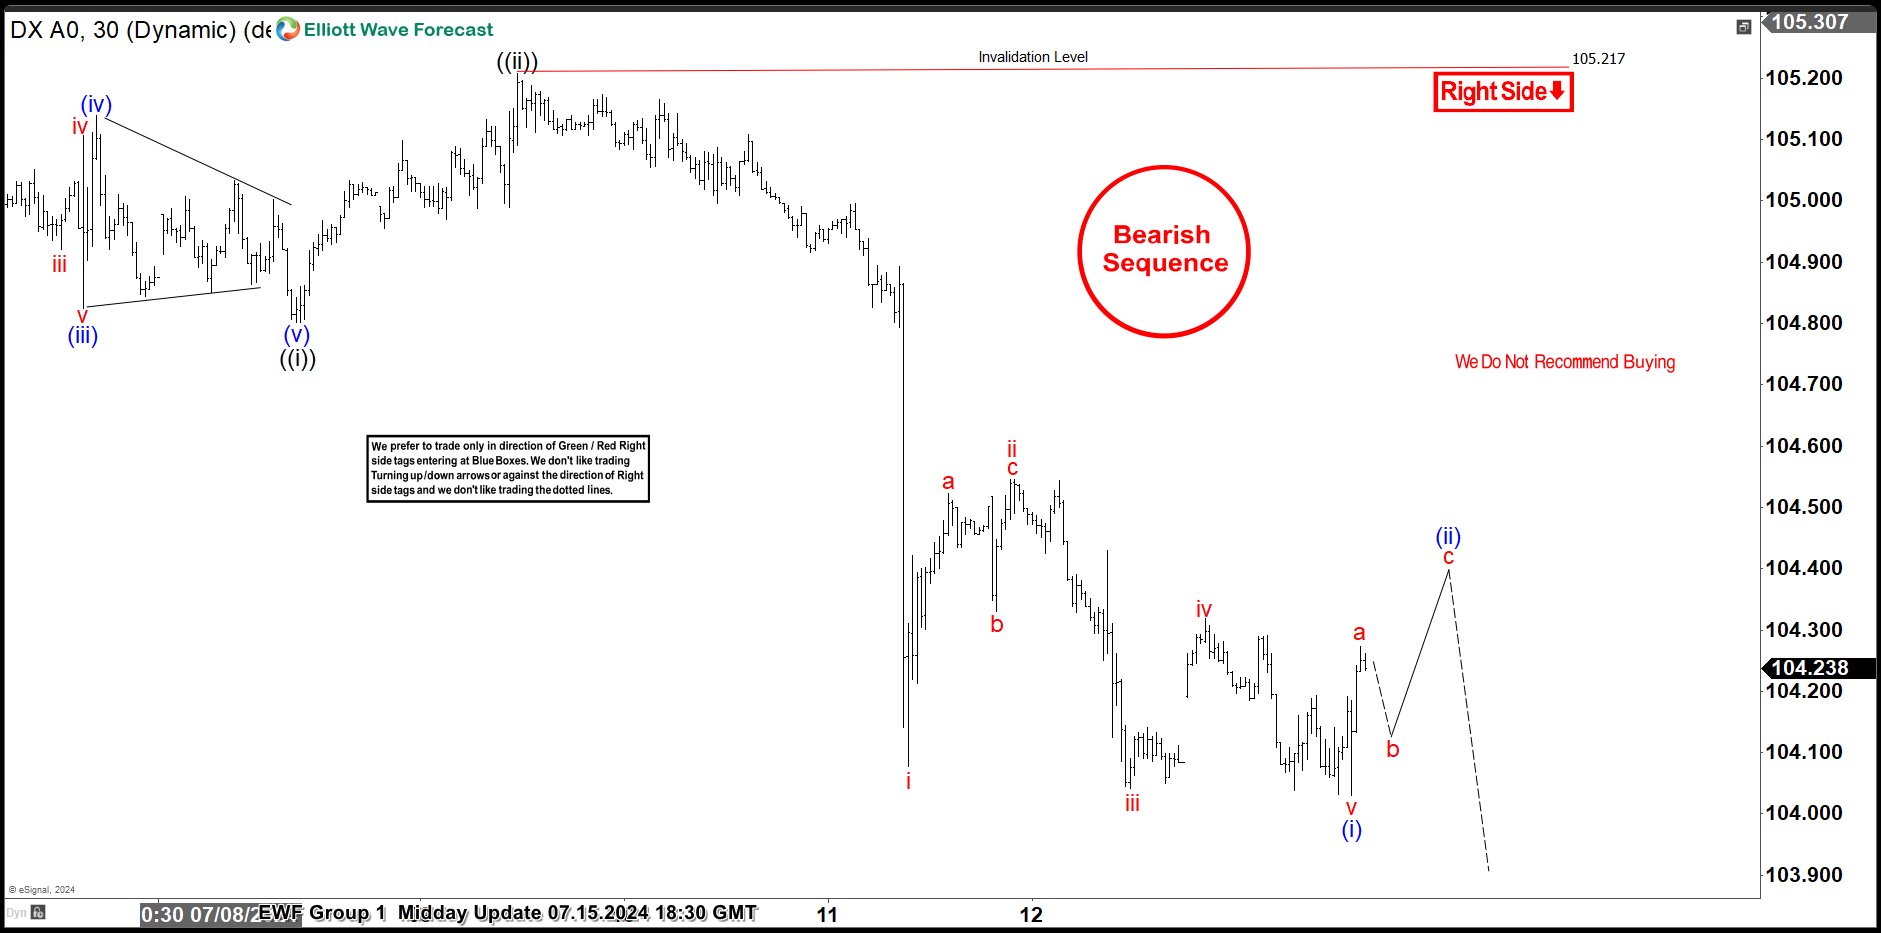
DXY H1 Midday Update 07.15.2024
DXY ended cycle from the 105.217 peak as 5 waves structure leading diagonal. Current view suggests we are getting wave (ii) blue recovery , that can be unfolding as 3 waves bounce. We expect Dollar index to keep finding intraday sellers in 3, 7, and 11 swings.
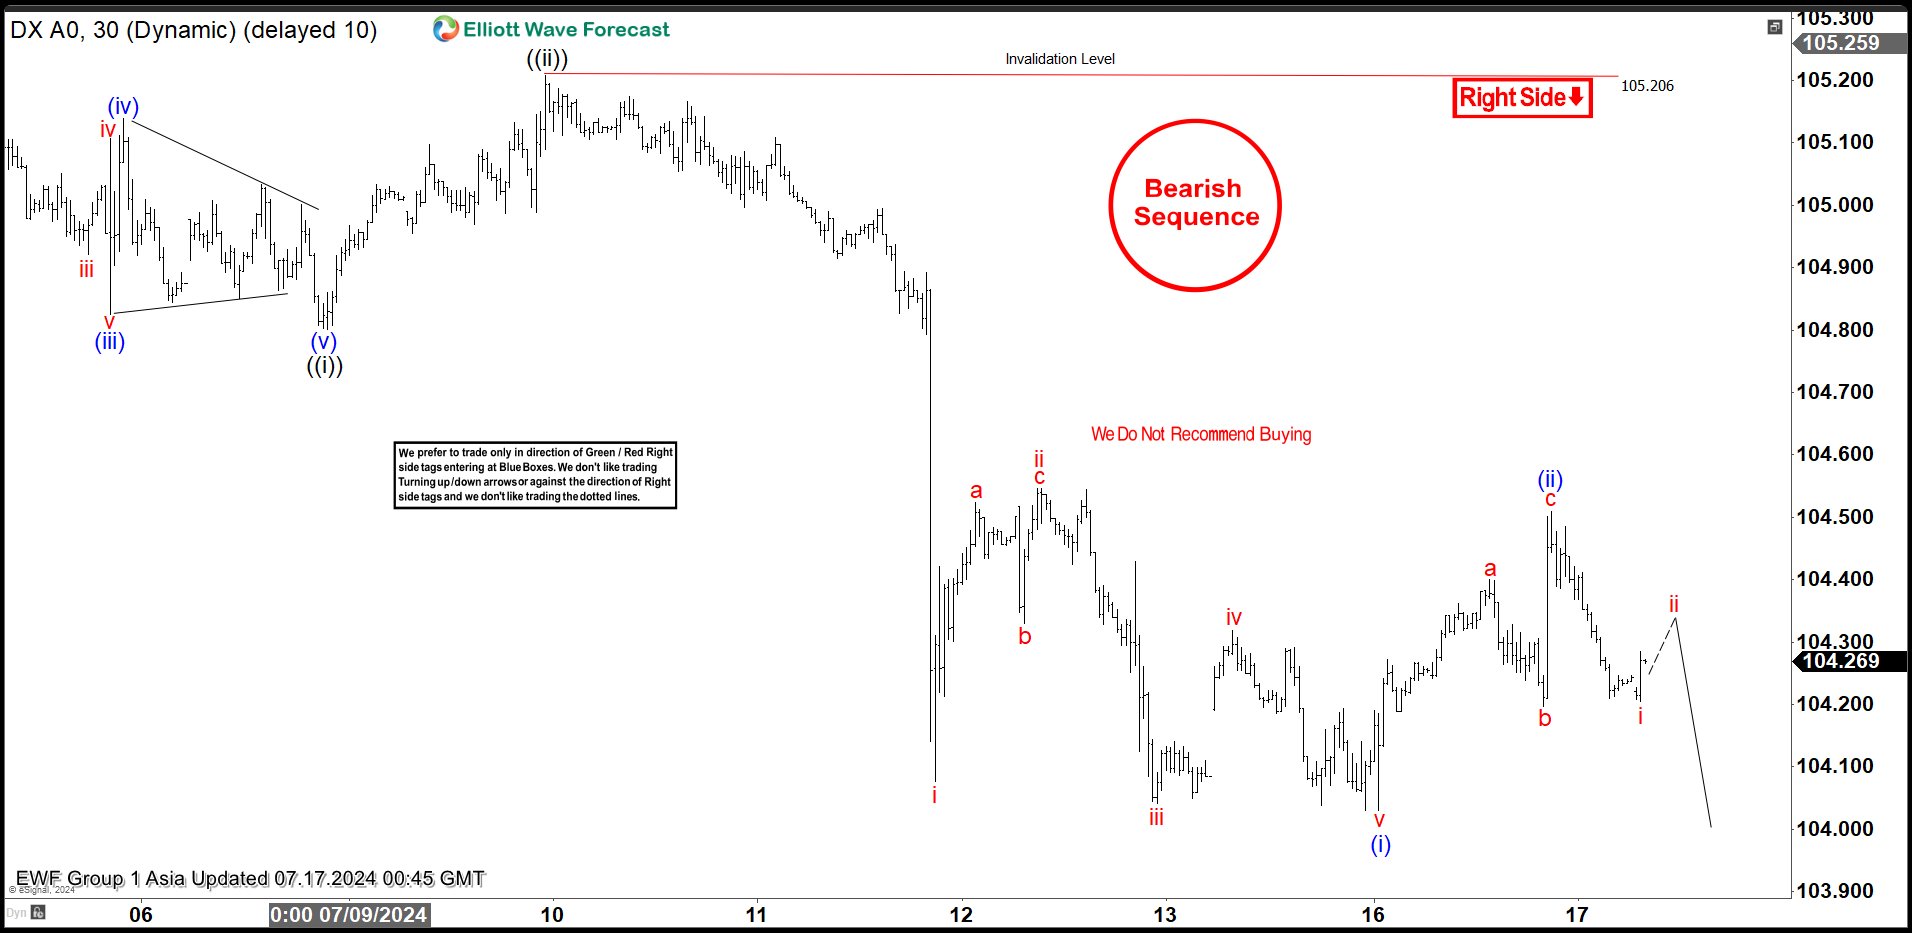
DXY H1 Asia Update 07.17.2024
DXY made clear 3 waves up from the lows. Current view suggests wave (ii) blue recovery is done at 104.50 high, labeled as abc red. As far as the price holds below that level, we expect more downside in near term. We would like to see break below (i) blue to confirm next leg down is in progress.
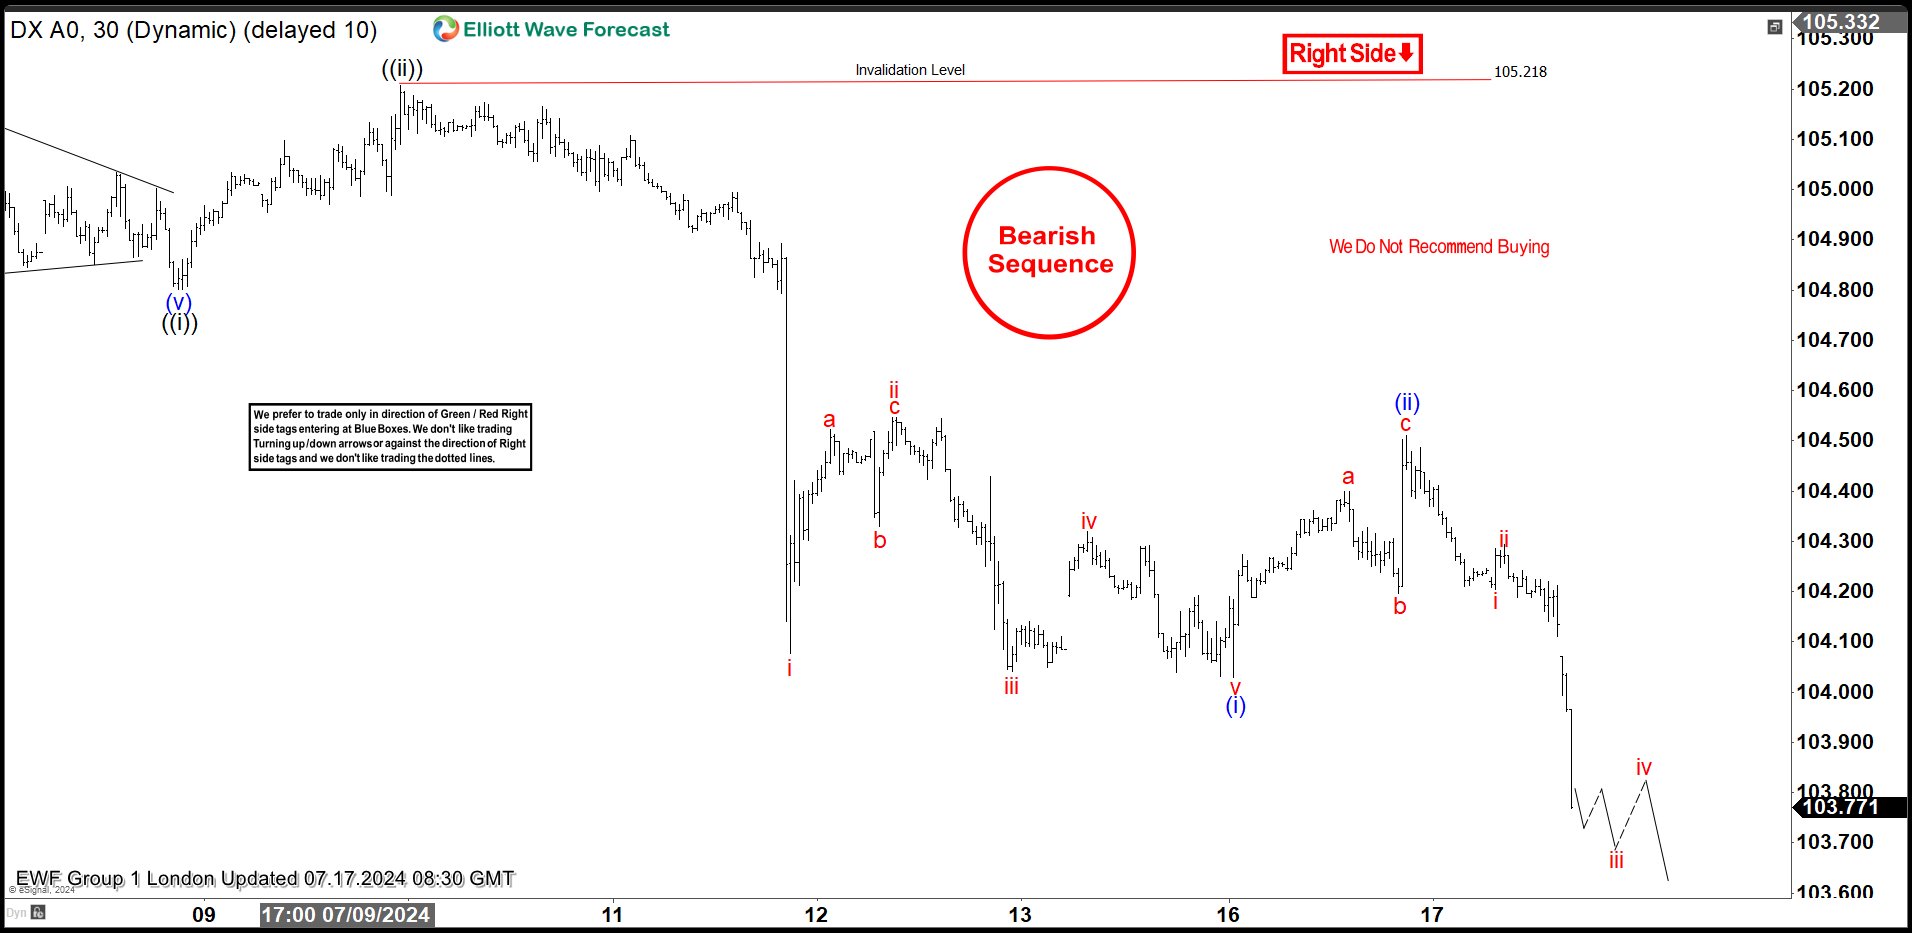
DXY H1 London Update 07.17.2024
Dollar index made a further decline as expected. The price made break of previous low , confirming wave (iii) blue is in progress.
EUR/USD Rallies Toward Key Confluence Zone Amid Accelerating DXY Selloff
- Eurozone inflation remained stable at the end of Q2 2024, with core inflation for services and non-energy goods unchanged at 4.1% and 0.7% respectively.
- EU services inflation remains persistently high and is unlikely to decrease significantly in the near future. A challenge for the ECB?
- EUR/USD is approaching a key resistance zone around 1.0950 ahead of the ECB meeting, which could be pivotal for sustained bullish momentum.
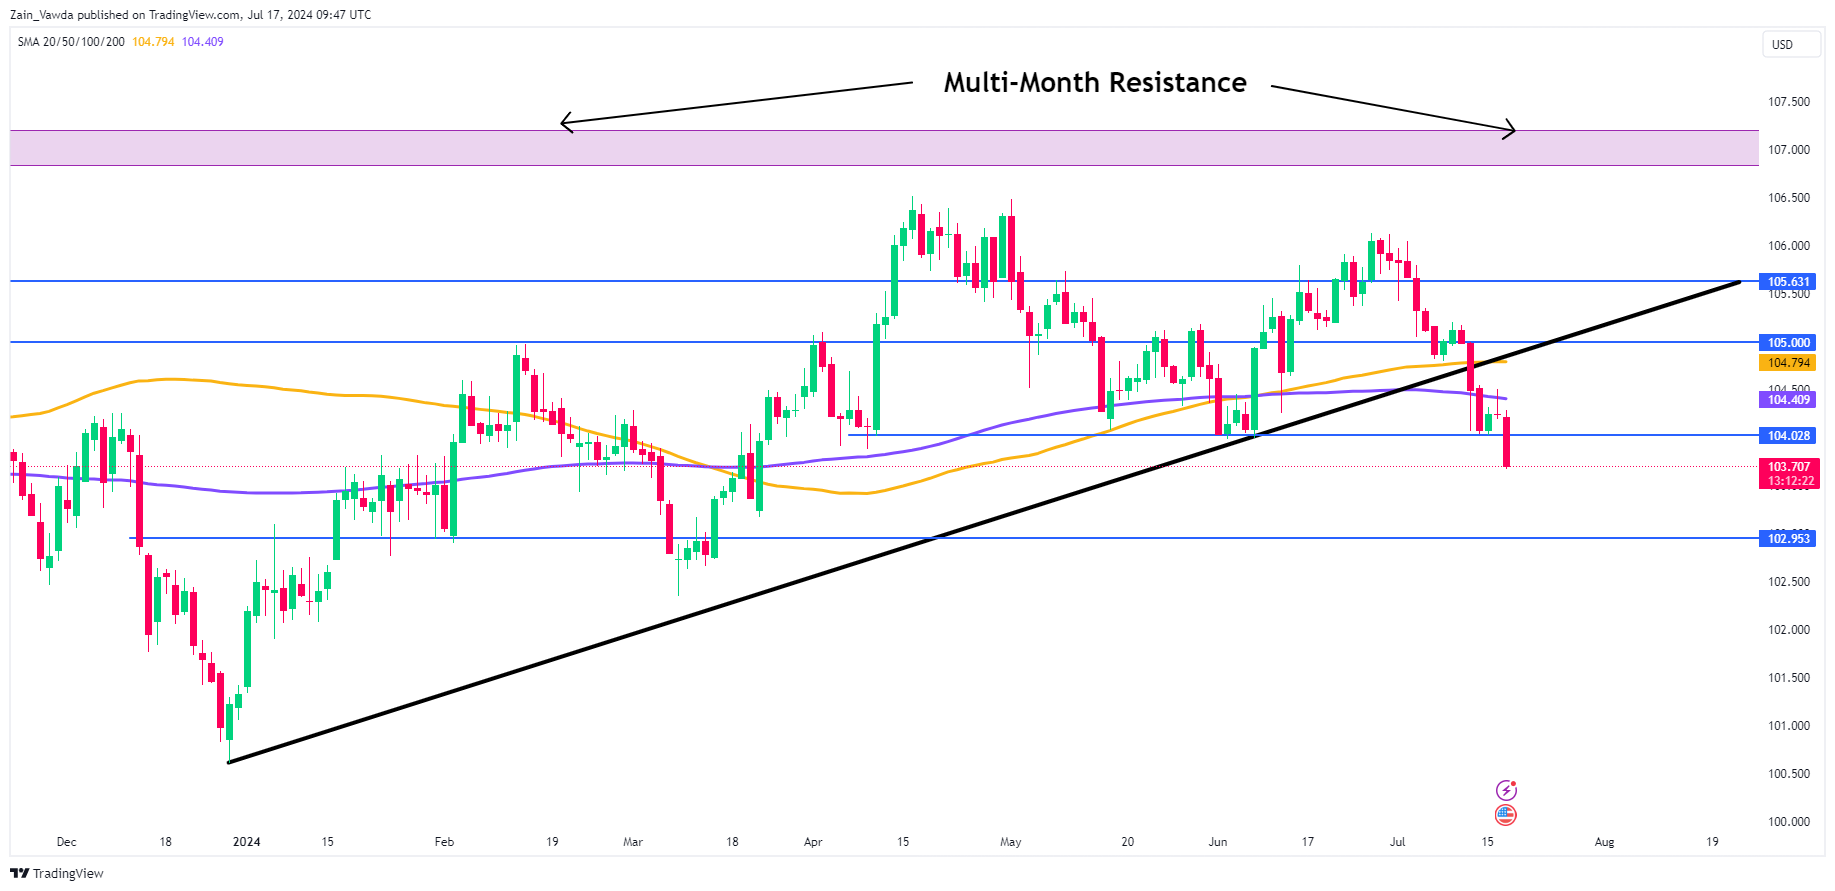
EUR/USD continued its advance above the 1.0900 handle this morning as eurozone inflation matched the consensus and first estimates. An accelerated selloff in the DXY has also benefited EUR/USD, as traders increase their bets on rate cuts from the US Federal Reserve, putting pressure on the US Dollar.
US Dollar Index (DXY) Daily Chart, July 17, 2024
Source: TradingView.com
Inflation in the Eurozone remained mostly stable at the end of the second quarter. Energy inflation saw a slight decrease to 0.2% year-over-year from 0.3% in May. Inflation for food, alcohol, and tobacco dropped by 0.2 percentage points to 2.4%.
Core inflation for both services and non-energy goods stayed the same at 4.1% and 0.7%, respectively. The month-over-month increase in core inflation was revised up by 0.1 percentage points to a 0.4% rise. Year-over-year rates matched the advance estimates, except for a minor downward adjustment of 0.1 percentage points in the inflation of food, alcohol, and tobacco, which was initially reported at 2.5%.
In a similar vein to the UK, services inflation remains as sticky as ever and a concern for the European Central Bank (ECB). The inflation picture in the eurozone also faces some near-term challenges.
In France, energy inflation is expected to rise in July due to an increase in gas distribution costs. Additionally, the Taylor Swift tour across major European cities in July poses an additional upside risk to inflation in hotels and other accommodations.
Despite a summer of challenges on the inflation front two more rate cuts from the ECB do appear on the cards with markets currently pricing in 48 bps of cuts before the year end. Market participants have been emboldened by the increase in US rate cut bets, but I expect that the majority of that has now been priced in.
The Week Ahead: ECB Meeting Up Next
The Economic docket is light in the US this week, with Federal Reserve policymakers the main attraction. Comments from Fed policymakers could stoke volatility but are unlikely to sway growing rate cut bets.
The ECB meeting tomorrow will now be the center of attention. EUR/USD is in a delicate position heading into the meeting as it rests just shy of a key confluence zone. The ECB are expected to hold rates steady tomorrow with the press conference likely to hold more sway.

Technical Analysis
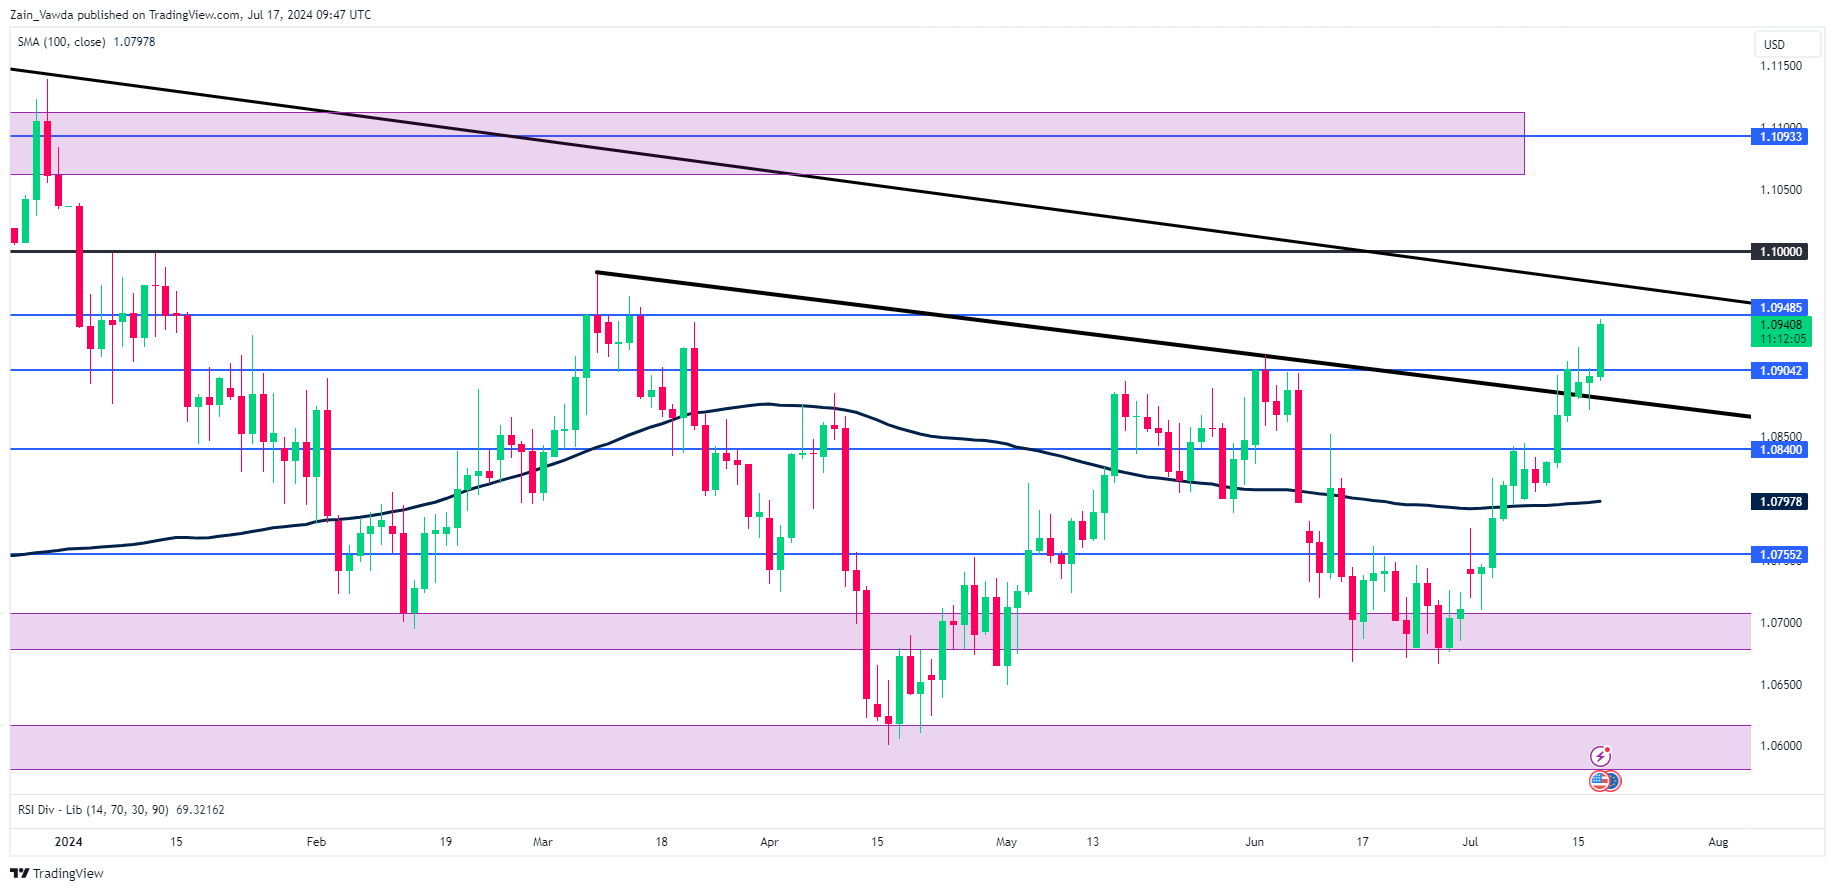
From a technical perspective, EUR/USD is currently trading at levels not seen since March 2024. Bulls might be concerned about the long-term descending trendline, which sits just above a crucial resistance zone around the 1.0950 mark.
This zone could be pivotal for sustained bullish momentum; however, a rejection at this trendline could push EUR/USD back towards support at the 1.0840 level in the coming weeks.
EUR/USD Chart, July 17, 2024
Source: TradingView (click to enlarge)
Support
- 1.0900
- 1.0840
- 1.0800
Resistance
- 1.0950
- 1.1000
- 1.1093
GBP/USD at 1-Year High as UK CPI Remains at 2%
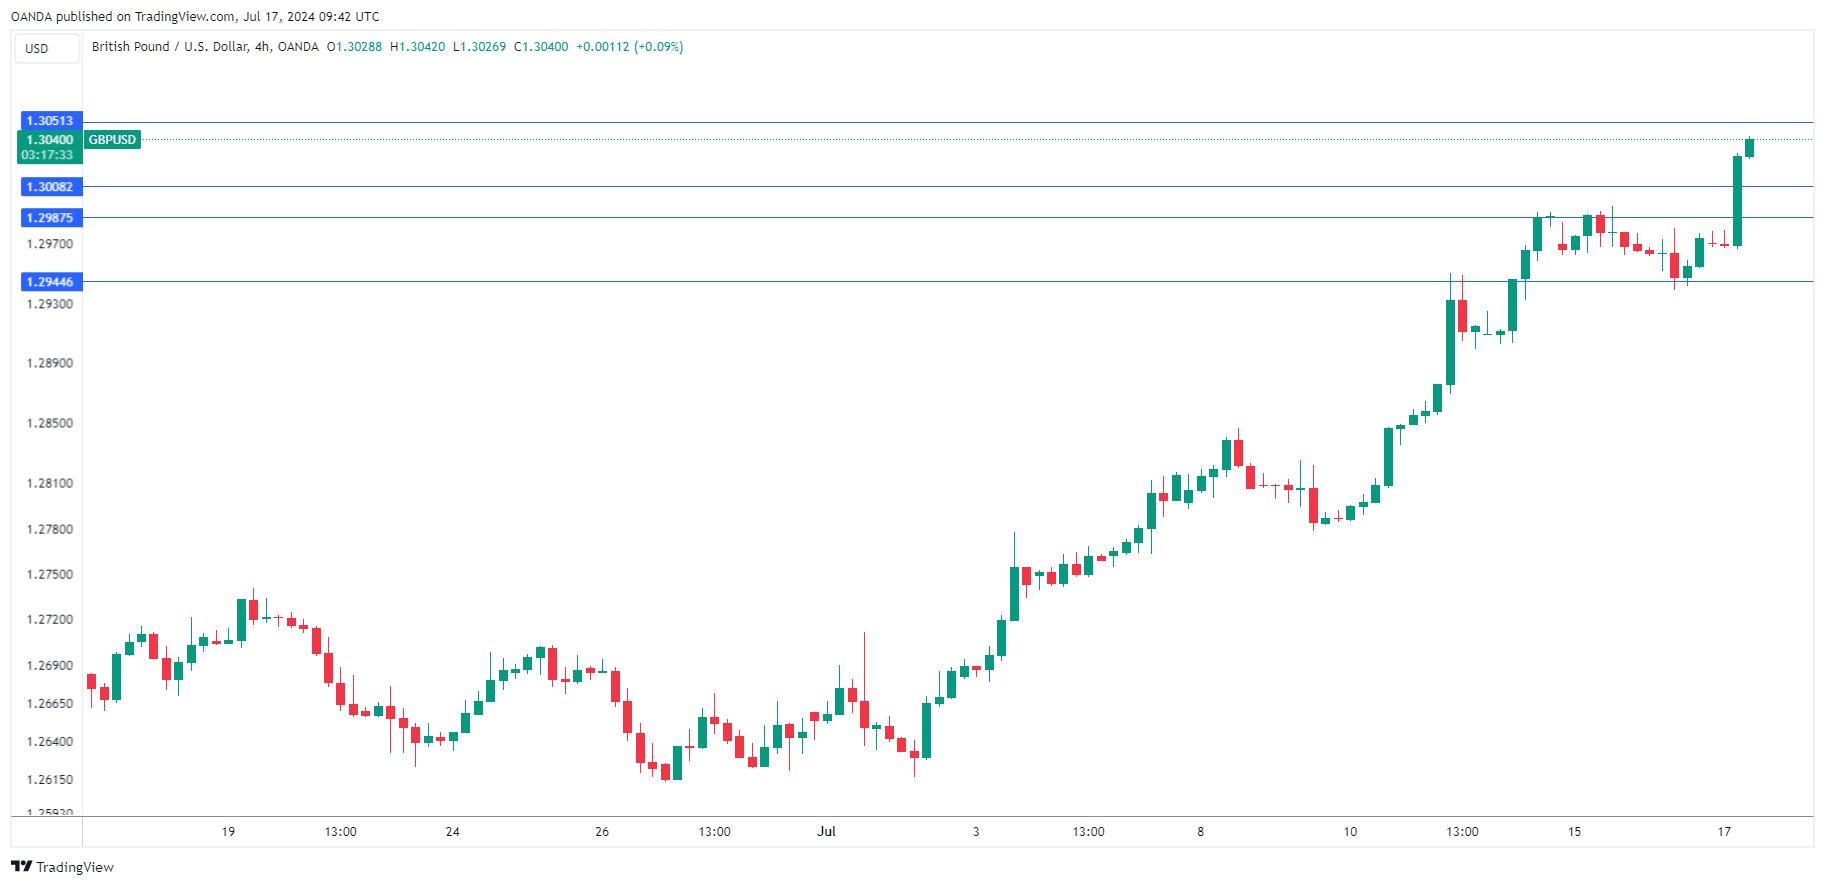
The British pound continues to roll and is up for a sixth straight day. GBP/USD is trading at 1.3038 in the European session, up 0.51% on the day. The pound has sparkled in July, climbing 3% and hitting its highest level since July 2023.
UK inflation unchanged
UK consumer inflation remained at 2% y/y in July, unchanged from June. This was higher than the market estimate of 1.9% but it’s hard to complain when inflation is at the BoE’s 2% target for two months running. Monthly, inflation dipped to 0.1%, down from 0.3% a month earlier, and matching the market estimate. Core inflation rose 3.5% y/y, unchanged from June and matching the market estimate. Monthly, core inflation dropped from 0.5% to 0.2%, below the market estimate of 0.1%.
The inflation report was positive and the pound responded by extending its impressive July rally. The fly in the ointment was services inflation, which the Bank of England watches keenly for signs of domestic inflationary pressure. Services inflation has been an outlier and was unchanged at 5.7% in July.
How will the BoE view the inflation report? Overall the release was positive, but services inflation is almost three times higher than the 2% target, which is a concern for policy makers. The cash rate is currently at 5.25%, unchanged since August 2023 when inflation was 7.9%. There is pressure on the BoE to provide relief and hit the rate-cut trigger but the central bank may lack the confidence to make a move at the next meeting on August 1.
The remainder of the week will be busy, with the UK releasing the employment report on Thursday and retail sales on Friday.
GBP/USD Technical
- GBP/USD is testing resistance at 1.3008. Above, there is resistance at 1.3051
- 1.2987 and 1.2944 are the next support levels
Crypto Market Reversal Saves XRP & Litecoin from Collapse
Market picture
The crypto market is recovering faster than it was falling, adding another 2.4% in 24 hours to $2.4 trillion. Bitcoin has rallied 15% since Saturday, now testing $66K. Ethereum is trying to cross $3500. Among the top coins, XRP stands out, soaring 12% in a day and 38% in 7 days, taking out Solana with its more modest 3.4% rise in a day.
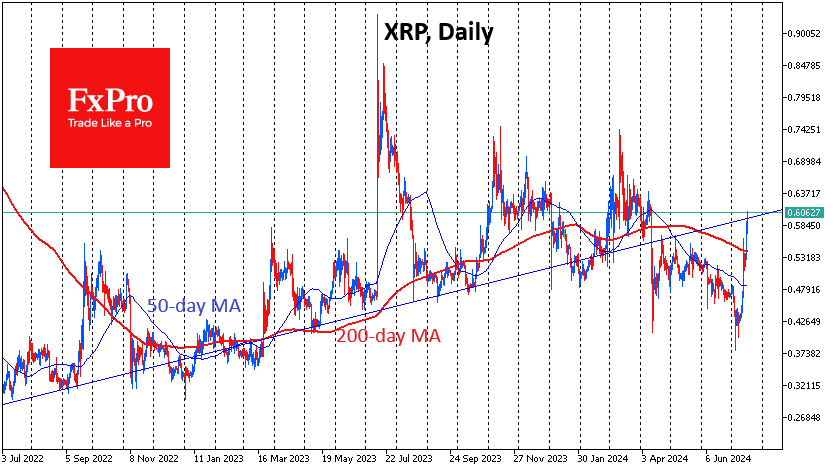
The move in XRP is truly outstanding, proving once again the importance of global support at $0.4. The coin has been performing worse than the market for a long time, but the reversal of sentiment in crypto has sparked a rise on steroids in the once-largest altcoin. On the latest bounce, the price rose to $0.6, its highest since April. This is an attempt to jump back into the uptrend of the past two years. However, it may well turn out that XRP needs to rest after the climb. And this high is appropriate, as we saw prolonged consolidations here in November-December and March.
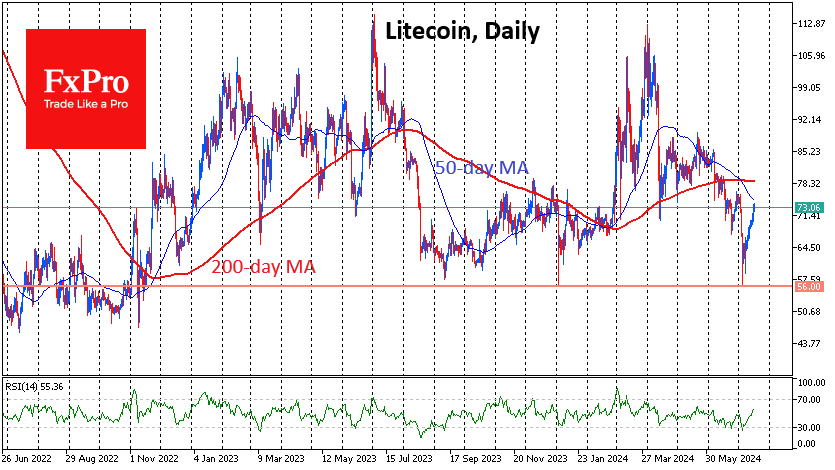
Another mature altcoin, Litecoin, gained persistent buyers’ interest, recording its ninth consecutive day of growth. At the start of the month, its price fell to $56 – a historically important support area. The sentiment in the crypto market changed at a critical moment for Litecoin. However, the same can be said about XRP.
News background
According to SoSoValue, on 15 July, inflows into spot bitcoin ETFs totalled $301.4 million, surpassing $300 million for the second day in a row. The positive trend continued for the seventh consecutive day at $1.49 billion, and it has increased to $16.11 billion since BTC-ETFs were approved in January.
The market was shaken up by Mt.Gox’s withdrawal of $6.1bn worth of bitcoins, which led to a short-term drop in BTC below $63,000. According to Arkham data, the bankrupt Mt. Gox exchange transferred nearly 96,000 BTC to unidentified addresses. Later, the Kraken exchange reported receiving some of Mt. Gox’s assets in BTC and BCH. Their distribution may take 7-14 days. In total, Mt.Gox will distribute 138,985 BTC worth ~$8.74bn.
Bloomberg analyst Eric Balchunas said spot ETH-ETF trading in the US will begin on 23 July. According to him, “The SEC finally asked issuers to return final Forms S-1 on Wednesday.”
Stripe, a payment service, now allows EU residents to purchase Bitcoin, Ethereum, and Solana using credit and debit cards. In 2018, Stripe abandoned digital assets, citing Bitcoin’s high volatility.
Jack Dorsey’s Block firm, the developer of the BitKey hardware wallet, has enabled users to buy BTC using credit cards, bank transfers and fintech solutions like Apple Pay, Google Pay and PayPal.
Announced in February, the Chrome browser extension for leading non-custodial exchange Uniswap became available to all users. Market participants can create a new wallet or import an existing one. The extension works with 11 networks – Arbitrum, Avalanche, Base, Blast, BNB Chain, Celo, Ethereum, Optimism, Polygon, ZKsync and Zora Network.
XAU/USD Outlook: Gold Hits New Record High
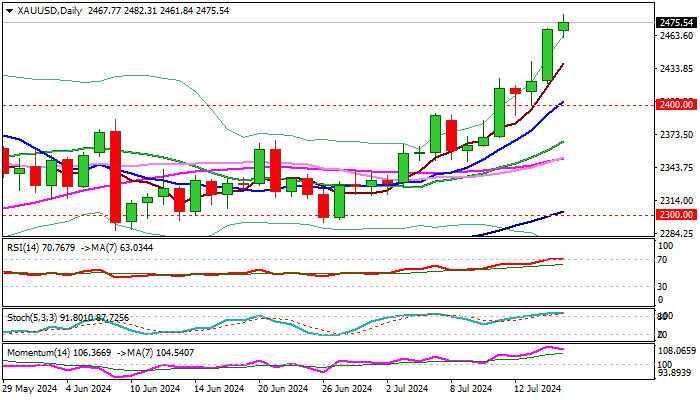
Gold hit new record high early Wednesday ($2482), following acceleration through former top on Tuesday (metal was up 1.9% for the day, the biggest daily gain since Dec 13).
Break above previous all-time high ($2450) signaled an end of corrective phase ($2450/$2286) and continuation of a larger uptrend.
Growing expectations for September Fed rate cut, fueled by the recent US inflation data and dovish comments from Fed officials, sparked fresh demand for the yellow metal.
Bulls approach immediate target at $2500, but may accelerate further, as favorable conditions on US rate outlook were boosted by heated geopolitical situation, as well as expectations that demand from gold’s top consumer China will remain strong, despite a pause in metal purchases in May and June.
Gold price entered uncharted territory again, with violation of $2500 barrier to expose targets at $ 2512/51/74 (Fibo projections).
Meanwhile, increased headwinds should be expected on approach to $2500 barrier, as daily studies are overbought.
Limited profit-taking is likely to mark a price adjustment before fresh push higher, with former top ($2450) and $2400 (psychological, reinforced by 10DMA) now acting as solid supports and expected to keep the downside protected.
Res: 2500; 2512; 2551; 2574.
Sup: 2461; 2450; 2400; 2368.