

Sample Category Title
Analysis of XAU/USD: Gold Price Sets Historical Record
As the XAU/USD chart shows, on 16th July, the gold price rose above $2460 for the first time in history. The bullish sentiment is driven by:
→ Anticipation of Fed rate cuts, as the appeal of non-yielding bullion generally increases in low-interest-rate environments.
→ Geopolitical tensions, with an attempt on Trump's life possibly boosting demand for the "safe-haven asset."
→ Demand from central banks.
Reuters reports that analysts at Commonwealth Bank of Australia believe the gold price could exceed their forecast of $2500 per ounce by the end of 2024. "It is worth highlighting gold's ability to find support under any conditions this year," they say.
Can the gold price rise further?
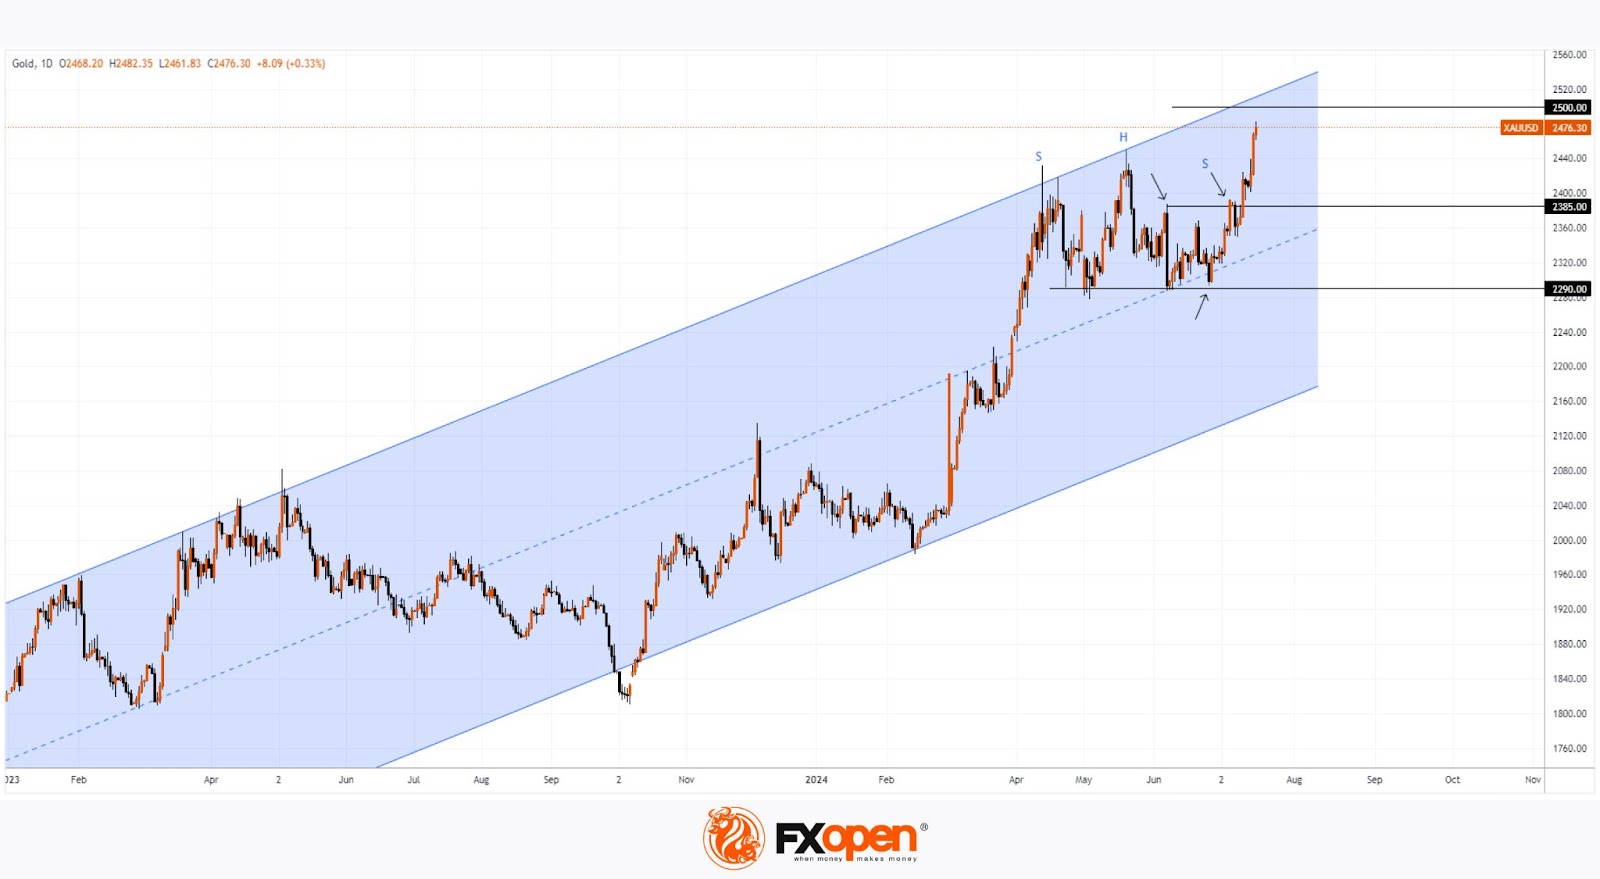
Technical analysis of the XAU/USD chart provides valuable insights:
→ The gold price is in an upward trend (shown in blue).
→ The support level at $2290, reinforced by the median line of the blue channel, pushed the price up (shown by an arrow).
→ The bulls managed to break the $2385 level, which had acted as resistance since 7 June (shown by arrows).
→ The bearish Head and Shoulders (SHS) pattern failed.
The contours of the upward channel suggest the potential for the gold price to rise to its upper boundary, where the psychological level of $2500 per ounce also lies. Thus, the Commonwealth Bank of Australia's forecast could come true much earlier than the end of 2024.
Start trading commodity CFDs with tight spreads. Open your trading account now or learn more about trading commodity CFDs with FXOpen.
This article represents the opinion of the Companies operating under the FXOpen brand only. It is not to be construed as an offer, solicitation, or recommendation with respect to products and services provided by the Companies operating under the FXOpen brand, nor is it to be considered financial advice.
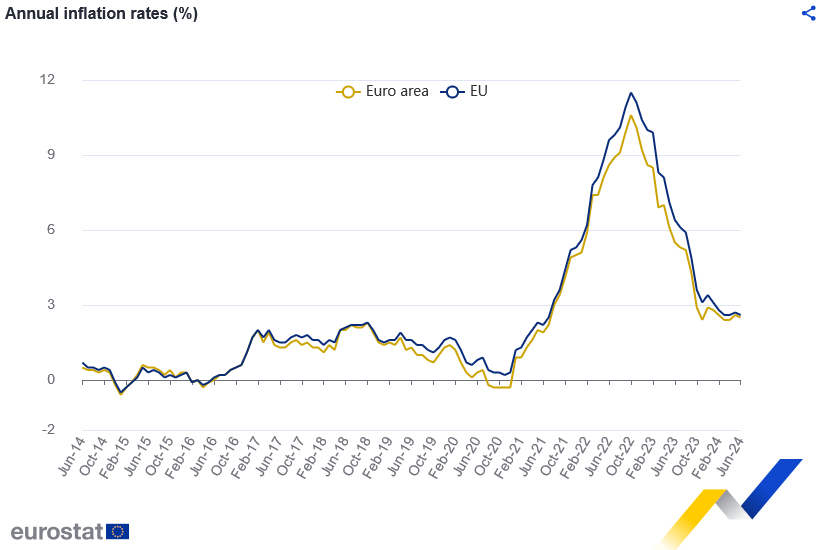
Eurozone CPI finalized at 2.5% in Jun, core at 2.9%
Eurozone CPI was finalized at 2.5% yoy in June, down from May's 2.6% yoy. CPI core (ex-energy, food, alcohol & tobacco) was finalized at 2.9% yoy, unchanged from prior month's reading. The highest contribution to annual inflation rate came from services (+1.84 percentage points, pp), followed by food, alcohol & tobacco (+0.48 pp), non-energy industrial goods (+0.17 pp) and energy (+0.02 pp).
EU CPI was finalized at 2.6% yoy, down from May's 2.7% yoy. The lowest annual rates were registered in Finland (0.5%), Italy (0.9%) and Lithuania (1.0%). The highest annual rates were recorded in Belgium (5.4%), Romania (5.3%), Spain and Hungary (both 3.6%). Compared with May 2024, annual inflation fell in seventeen Member States, remained stable in one and rose in nine.
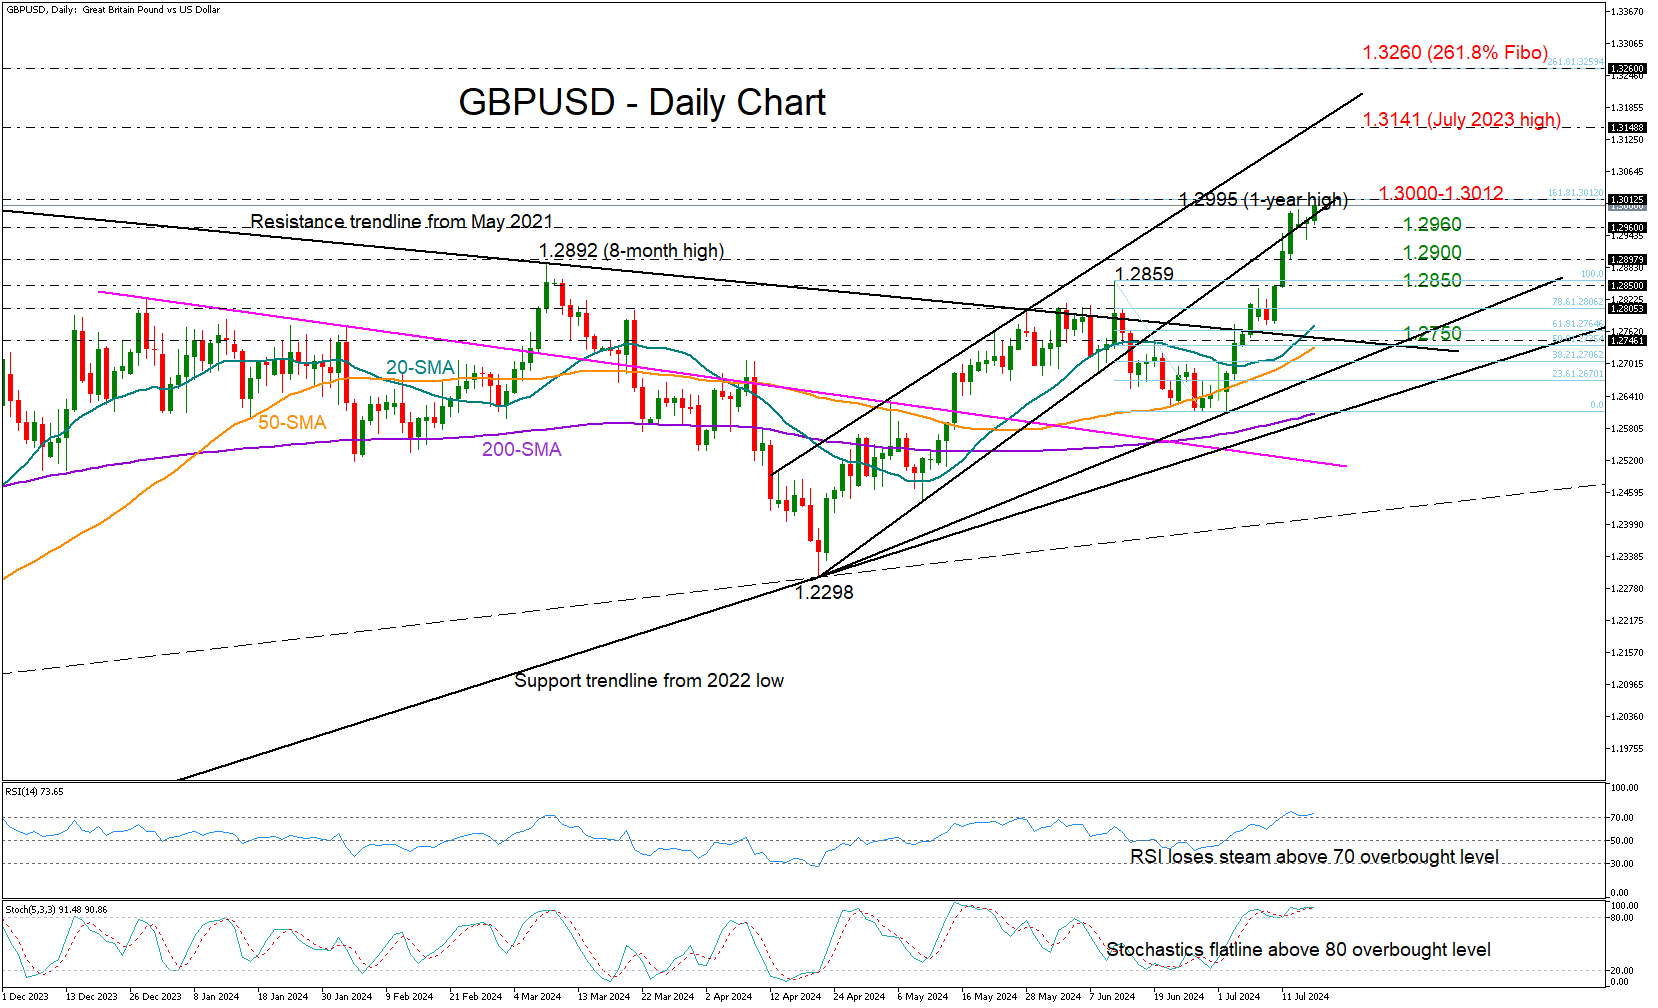
GBPUSD Hits Fresh 1-Year High
- GBPUSD jumps to fresh 1-year high after UK CPI surprises slightly higher
- Technical indicators point to overbought conditions following steep rally
- UK employment figures next on the agenda due on Thursday 06:00 GMT
The UK CPI inflation data on Wednesday gave GBPUSD a slight boost as consumer prices grew by 2.0% instead of the expected 1.9%. The pair gently surpassed its previous peak to post a new one-year high of 1.3011.
After a continuous rise since June, we can anticipate some stability as both the RSI and stochastic oscillator indicate overbought conditions.
Therefore, traders might patiently await a clear breakthrough above the psychological level of 1.3000 and the 161.8% Fibonacci extension of June’s decline at 1.3012 before targeting the July 2023 peak of 1.3141. Note that the ascending trendline from April is within the neighborhood, and a violation there might be a prerequisite for a continuation towards the 261.8% Fibonacci of 1.3260.
If bullish forces quickly fade, causing a drop below the nearby support zone at 1.2960, attention may turn to Friday’s low at 1.2900. A deeper downfall could retest the former resistance territory around 1.2850. Otherwise, sellers could stay in play until the price reaches its 20- and 50-day simple moving averages (SMAs) as well as the broken 2021 descending trendline near 1.2750.
In summary, GBPUSD remains on a positive trajectory in the short- and medium-term. However, considering recent rapid appreciation and overbought signals, there could be some consolidation in the short-term.
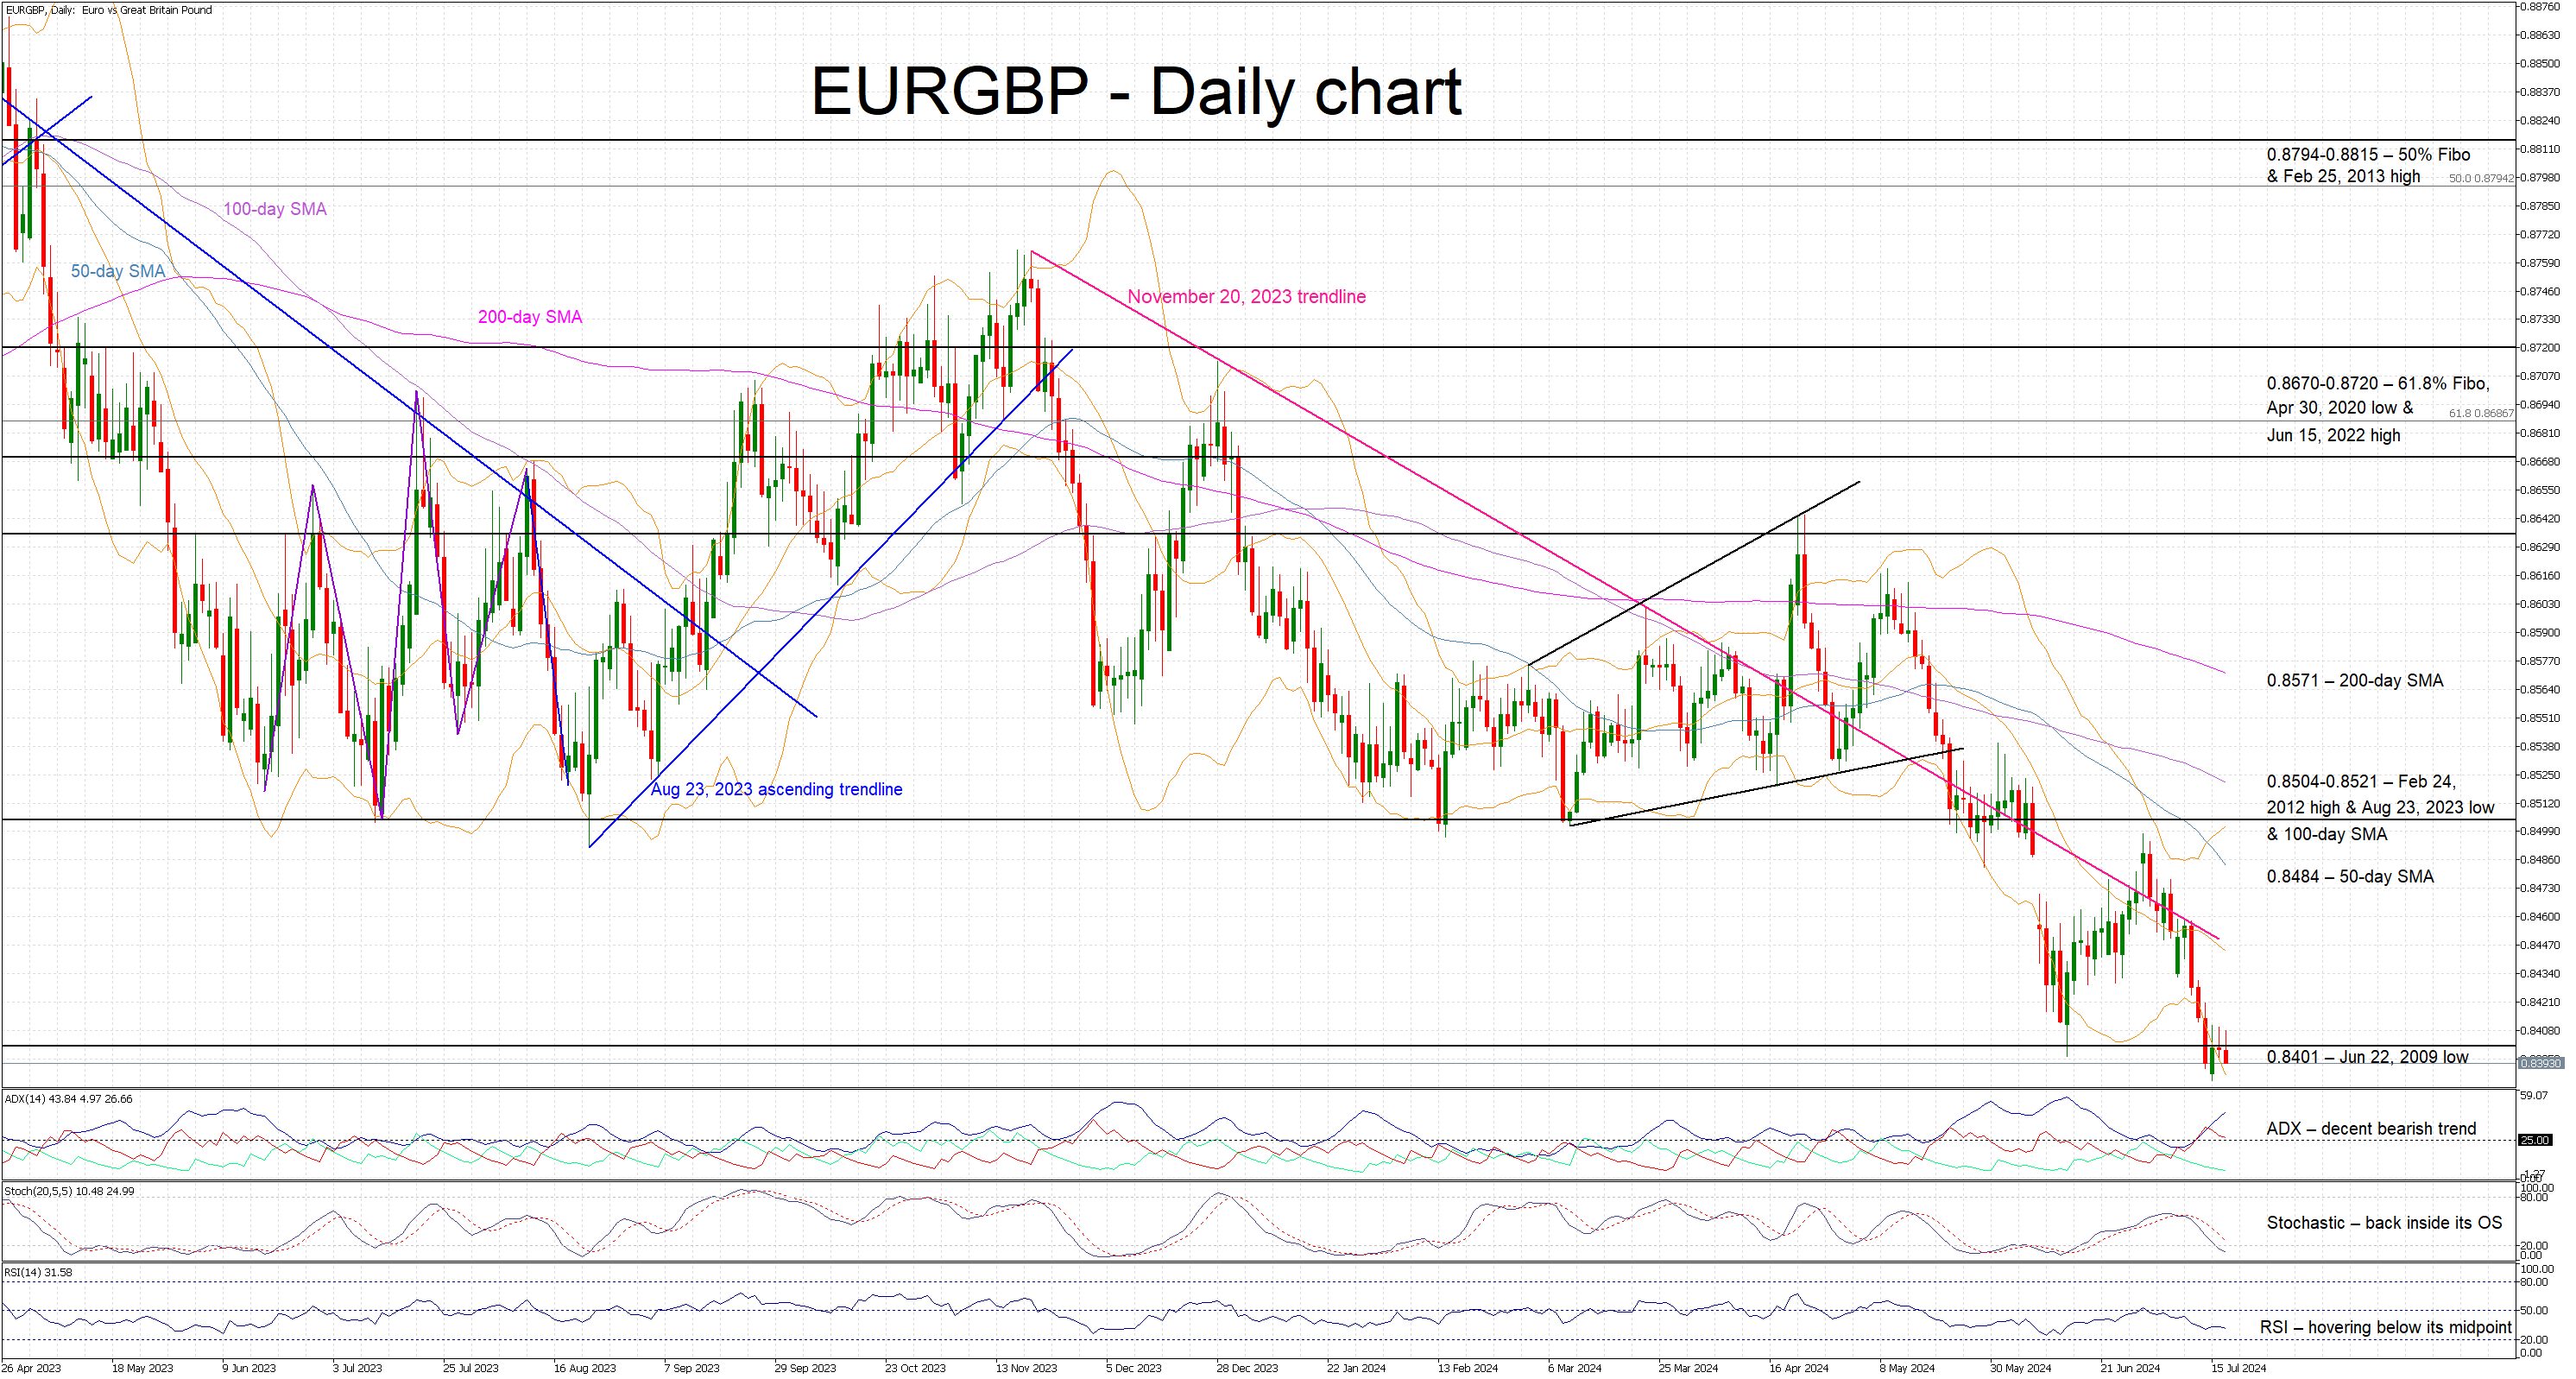
EURGBP Trades to a New 2024 Low
- EURGBP drops to the lowest level since August 2022
- Political unrest and weaker economic data keep the euro under pressure
- Momentum indicators could point to a reversal soon
EURGBP is hovering around the lowest level since August 2022, having recorded a decent correction from the early July local peak. The newfound political stability in the UK is supporting the pound while the euro remains under pressure on the back of the political unrest in France and a series of weaker economic data prints. The market is preparing for Thursday’s ECB meeting, where a dovish show by President Lagarde could open the door to another downleg.
In the meantime, the momentum indicators are mostly mixed. The Average Directional Movement Index (ADX) remains above its 25-threshold, and it is edging higher in a vertical fashion. The RSI is stuck below its 50-midpoint, but it appears to be unable to test its mid-June lows. Similarly, the stochastic oscillator has returned inside its oversold area (OS), but it has failed to record a lower low as seen in the EURGBP. This could mean that a bullish divergence could be in the works.
Should the bulls manage to retake control, they could first try to push EURGBP above the 0.8401 level and then stage a rally towards the 50-day simple moving average (SMA) at 0.8484. If successful, they could then test their determination against the busy 0.8504-0.8521 area, which is defined by the February 24, 2012 high, the August 23, 2023 low and the 100-day SMA.
On the flip side, the bears appear determined to maintain their recent gains by keeping EURGBP below the 0.8401 level. They could then gradually push it lower towards the August 4, 2022 low at 0.8339, with the December 5, 2016 low being a tad lower at 0.8304.
To sum up, EURGBP remains on the back foot and a dovish show at Thursday’s ECB meeting could potentially open the door to a more protracted correction towards the 0.8300 area.
Market Analysis: AUD/USD and NZD/USD Poised For Fresh Gains
AUD/USD is attempting a fresh increase from the 0.6715 support. NZD/USD is also rising and could target the 0.6090 resistance.
Important Takeaways for AUD/USD and NZD/USD Analysis Today
- The Aussie Dollar found support at 0.6715 and recovered higher against the US Dollar.
- There is a major bearish trend line forming with resistance at 0.6740 on the hourly chart of AUD/USD at FXOpen.
- NZD/USD is consolidating above the 0.6050 support.
- There was a break above a key bearish trend line with resistance at 0.6060 on the hourly chart of NZD/USD at FXOpen.
AUD/USD Technical Analysis
On the hourly chart of AUD/USD at FXOpen, the pair formed a base above 0.6715. The Aussie Dollar started a decent recovery wave above the 0.6725 resistance against the US Dollar, as mentioned in the previous analysis.
The bulls pushed the pair above the 23.6% Fib retracement level of the downward move from the 0.6793 swing high to the 0.6714 low. However, the pair is still below the 50-hour simple moving average.
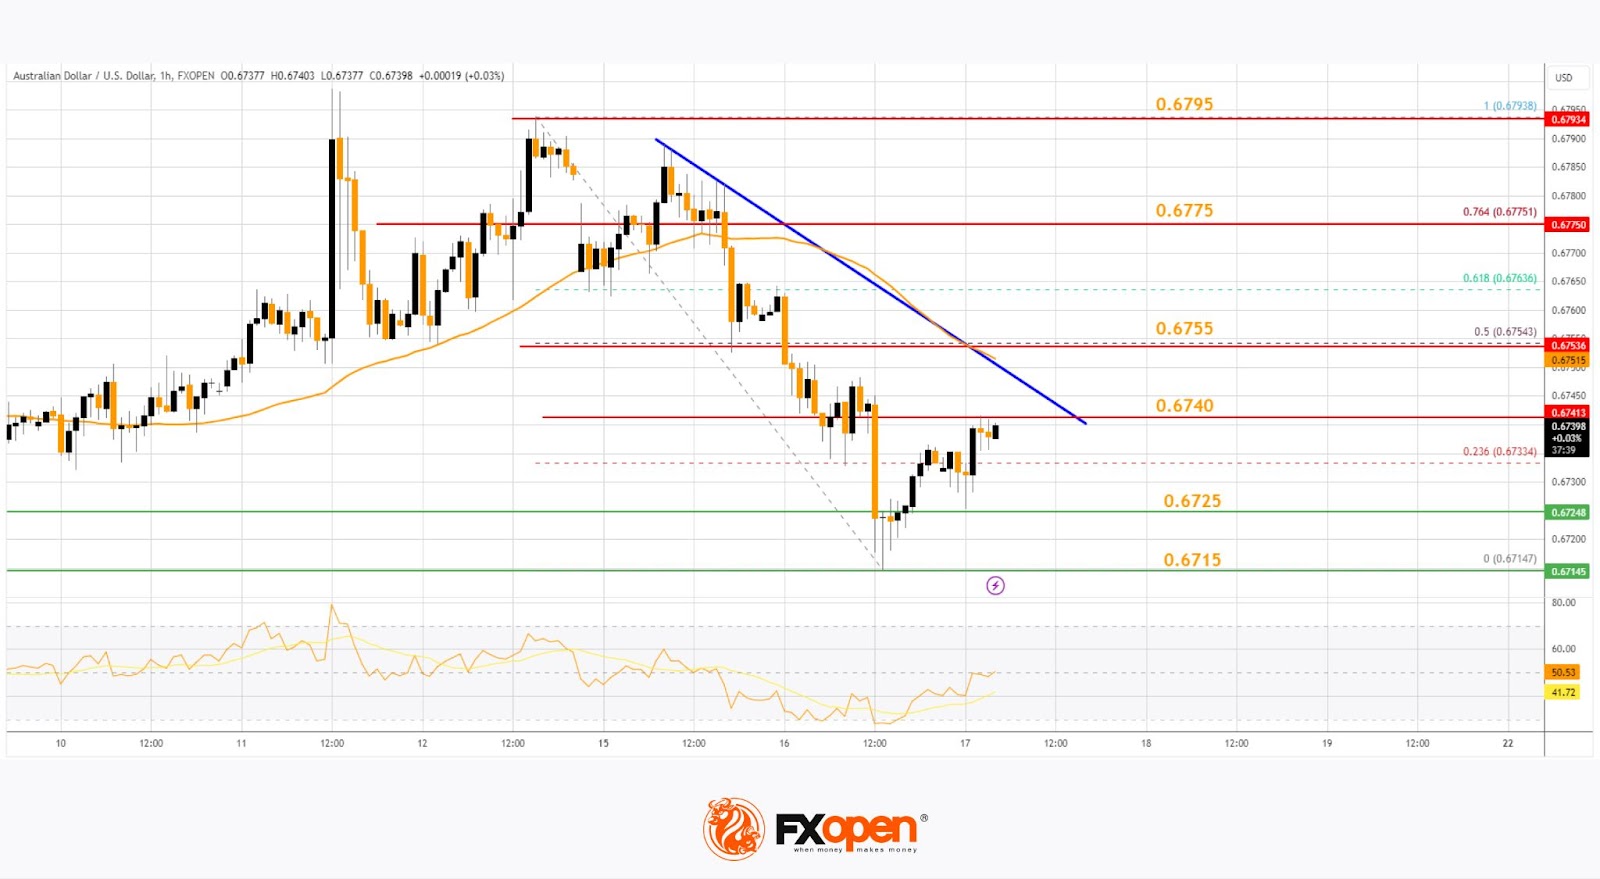
On the upside, the AUD/USD chart indicates that the pair is now facing resistance near the 0.6740 zone. There is also a major bearish trend line forming with resistance at 0.6740.
The first major resistance might be 0.6755 and the 50% Fib retracement level of the downward move from the 0.6793 swing high to the 0.6714 low. An upside break above the 0.6755 resistance might send the pair further higher.
The next major resistance is near the 0.6775 level. Any more gains could clear the path for a move toward the 0.6795 resistance zone.
If not, the pair might correct lower. Immediate support sits near the 0.6725 level. The next support could be 0.6715. If there is a downside break below the 0.6715 support, the pair could extend its decline toward the 0.6660 zone. Any more losses might signal a move toward 0.6640.
NZD/USD Technical Analysis
On the hourly chart of NZD/USD on FXOpen, the pair also followed AUD/USD. The New Zealand Dollar formed a base above the 0.6035 level and started a decent increase against the US Dollar.
The pair climbed above the 0.6050 resistance. There was a break above a key bearish trend line with resistance at 0.6060. The pair spiked above the 50-hour simple moving average and tested the 50% Fib retracement level of the downward move from the 0.6125 swing high to the 0.6033 low.
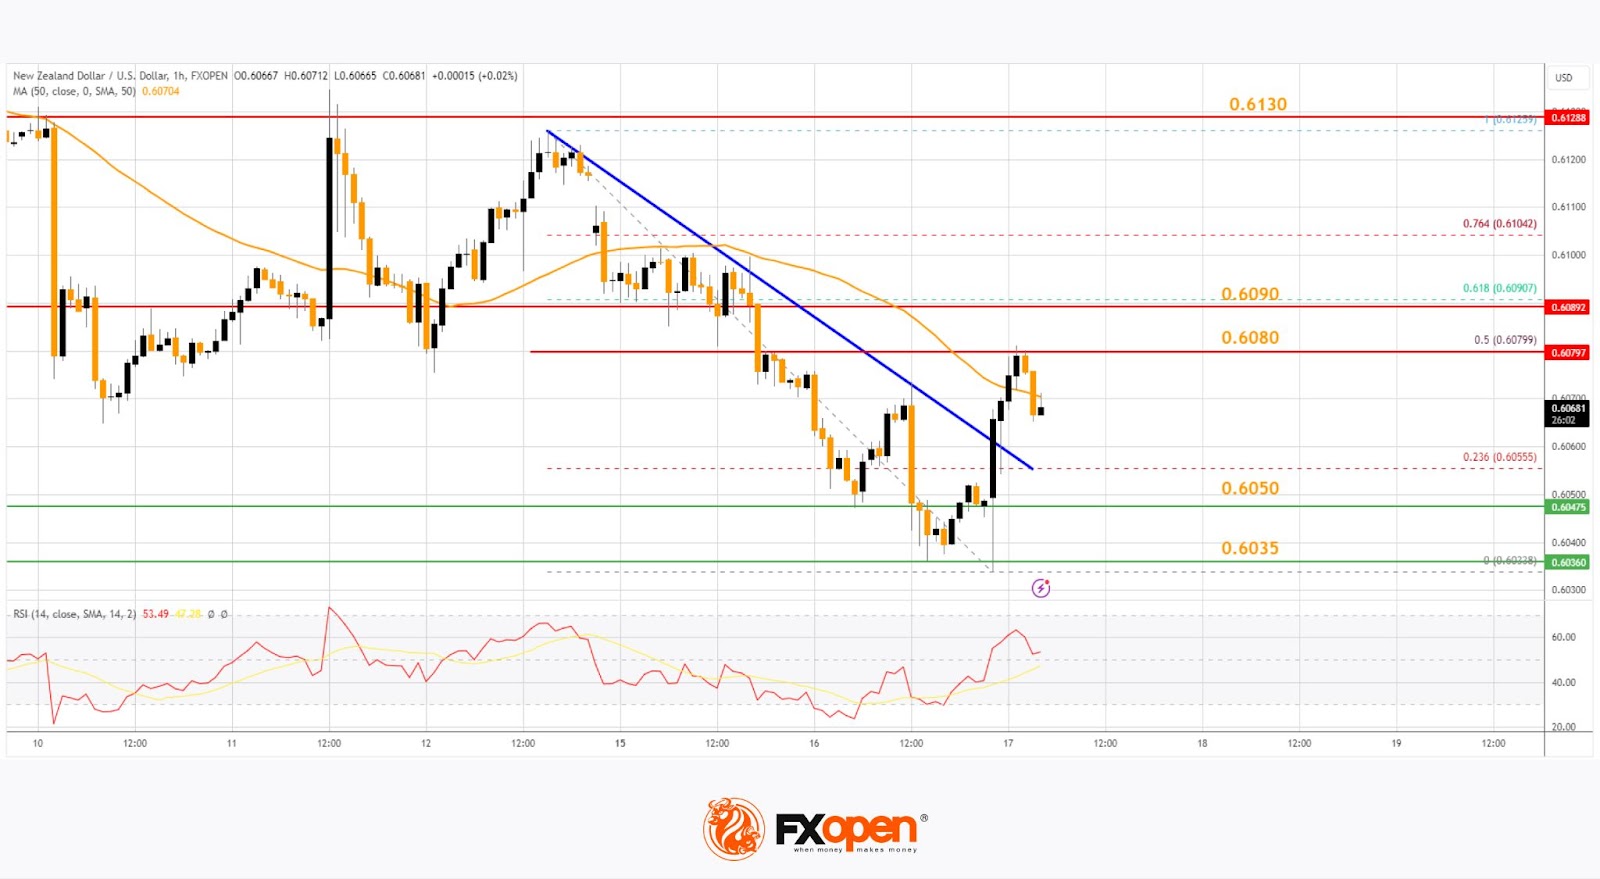
The NZD/USD chart suggests that the RSI is back above 50 and signaling a positive bias. On the upside, the pair is facing resistance near the 0.6080 zone. The next major resistance is near the 0.6090 level and 61.8% Fib retracement level of the downward move from the 0.6125 swing high to the 0.6033 low.
A clear move above the 0.6090 level might even push the pair toward the 0.6130 level. Any more gains might clear the path for a move toward the 0.6180 resistance zone in the coming days.
On the downside, there is a support forming near the 0.6050 zone. If there is a downside break below the 0.6050 support, the pair might slide toward 0.6035. Any more losses could lead NZD/USD in a bearish zone to 0.6000.
Trade over 50 forex markets 24 hours a day with FXOpen. Take advantage of low commissions, deep liquidity, and spreads from 0.0 pips. Open your FXOpen account now or learn more about trading forex with FXOpen.
This article represents the opinion of the Companies operating under the FXOpen brand only. It is not to be construed as an offer, solicitation, or recommendation with respect to products and services provided by the Companies operating under the FXOpen brand, nor is it to be considered financial advice.
A Speech by Fed Waller is a Wildcard
Markets
Consensus-beating June US retail sales only temporary interfered with reigning market momentum. Core retail sales rose by 0.8% M/M (& 0.9% M/M for retail sales control group) in what for now remains more of a catch-up move after weak consumer spending YTD. Sales were mainly boosted by goods spending with customers lured by price discounts. US Treasuries spiked lower in a first reaction with the dollar profiting, but those moves were completely undone during US trading hours. US yields lost 4 bps (2-yr) to 8.6 bps (30-yr), with the long end of the curve overturning the temporary underperformance related to president-candidate Trump’s boost in election polls. The US 2-yr yield tested the March low at 4.4% with the US 10-yr yield at risk of giving away first technical support around 4.18%. Markets are adding to bets that the Fed will have to cut policy rates sooner and faster than indicated in June. Fed governors don’t commit to a specific guidance and stick to the official view that it will be appropriate to lower borrowing costs later this year. Fed Kugler yesterday indicated that a weaker labour market driven by layoffs (instead of reducing vacancies) could prompt her to support a rate cut sooner rather than later. If the next inflation reports don’t confirm the Q2 easing of inflation pressures, it may be appropriate to hold rates steady a little bit longer. In FX space, the dollar spiked to EUR/USD 1.0870 immediately after June retail sales, but the pair eventually closed around 1.09. It is still at risk of breaking 1.0916 resistance. US stock markets rose by 0.2% (Nasdaq) to 1.85% (Dow). YTD it was the best result for the Dow Jones. The small cap Russell 2000 added 2.9% and is an astonishing 12% higher since last week’s benign CPI print. The interest-rate sensitive small cap index profits from rotation inflows as the market set its eyes on a near term Fed rate cut.
Today’s eco calendar is thin with US housing data and production figures. A speech by Fed Waller is a wildcard. He has been the most outspoken en influential Fed member calling to delay interest rate cuts (“What’s the rush?”, “There’s still no rush”). Any signals that he’s moving closer to action will add to current market momentum, pushing (short term) US yields and the dollar down. Sterling this morning holds just above EUR/GBP 0.84 as near consensus inflation figures (headline 2% Y/Y, core 3.5% Y/Y, services 5.7% Y/Y) suggest a wait-and-see approach by the Bank of England at the August 1 policy meeting.
News & Views
New Zealand inflation eased slightly more than expected in Q2, to 0.4% Q/Q and 3.3% Y/Y (from 0.6% Q/Q and 4%). As such, inflation is moving closer to the 1-3% target range of the Reserve Bank of New Zealand. Housing and household utilities was the largest contributor to the quarterly inflation rate due to rising prices for rent (+1.2%), construction of new houses (0.9%) and household energy (including electricity and gas) increasing 2.8%. The largest downward contributor was recreation & culture. Tradeable inflation (final goods and services that are influenced by foreign markets) remains very subdued at -0.5% Q/Q and 0.3% Y/Y. Non-tradeable inflation, an indicator of the domestic supply-demand balance, also eased to 0.9% Q/Q and 5.4% Y/Y, but remains sticky driven mainly by rent, insurance and tobacco. The latter is a source of concern for the RBNZ, even as the central bank indicated at last week’s policy meeting that it might be coming closer to the point to at least consider some scaling back of the tightening. The 2-y New-Zealand bond yield adds 3.bps this morning. The market still sees a 50% chance for a rate cut in August. The Kiwi dollar rebounds modestly after the recent setback (NZD/USD 0.6065).
The National Bank of Poland published its monthly core inflation figures (June) yesterday. Core inflation excluding food and energy prices rose by 0.2% M/M and 3.6% Y/Y (from 3.8%). Other measures of underlying inflation (ex-administered prices +0.1%M/M, ex most volatile prices +0.2% M/M and 15% trimmed average +0.2% M/M) also showed benign monthly dynamics. The data probably won’t convince the National Bank of Poland to cut rates anytime soon though as the central bank expects price hikes for energy and strong wage growth to reaccelerate inflation in the second half of this year and early 2025. NBP governor Glapinski at the July policy meeting excluded a rate cut this year and even indicated that it might take until 2026 for the NBP to be able to ease policy.
Graphs
GE 10y yield
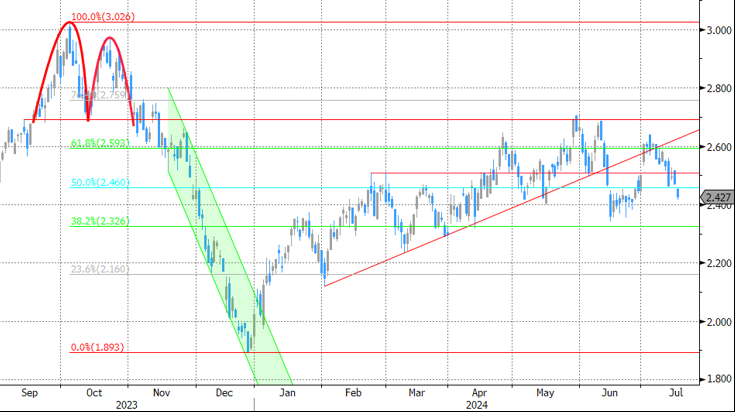
The ECB cut its key policy rates by 25 bps at the June policy meeting. A more bumpy inflation path in H2 2024, the EMU economy gradually regaining traction and the Fed’s higher for longer US strategy make follow-up moves difficult. Markets are coming to terms with that. Meanwhile, much of the save haven bids were reversed after the (first round in) the French elections. The 2.34%-2.4% support zone looks solid.
US 10y yield
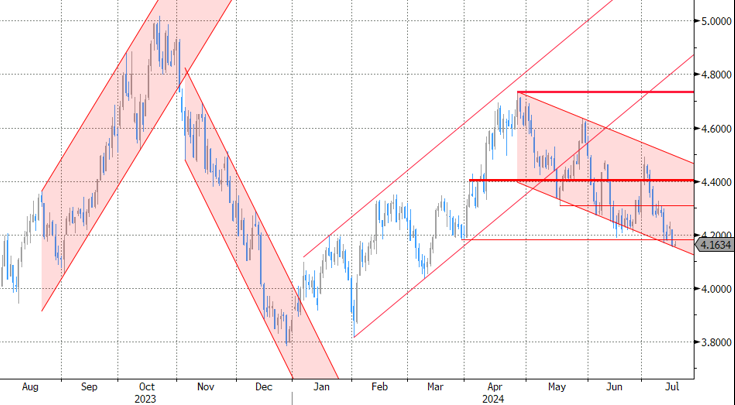
The Fed indicated that it needs more evidence to lower its policy rate. June dots suggested one move in 2024 and four next year. Disappointing ISM and back-to-back downward CPI surprises put the US money market back on (at least) two rate cuts this year (September/December). The US 10-yr yield tests the recent lows and the downside of the downward trend channel in the 4.2% area.
EUR/USD
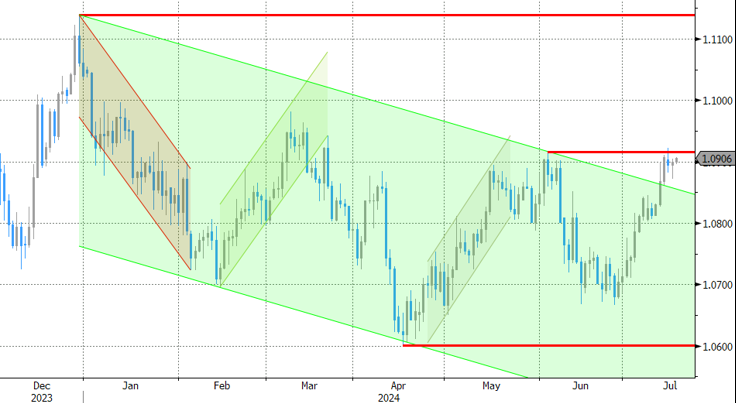
EUR/USD is testing the topside of the 1.06-1.09 range as the dollar loses interest rate support at stealth pace. Markets consider a September rate cut a done deal and only need confirmation from high-ranked Fed officials. In the meantime, the euro got rid of the (French) political risk premium. Risks of a topside break are high, bringing the psychologic 1.10 and the December 2023 top at 1.1139 on the radar.
EUR/GBP
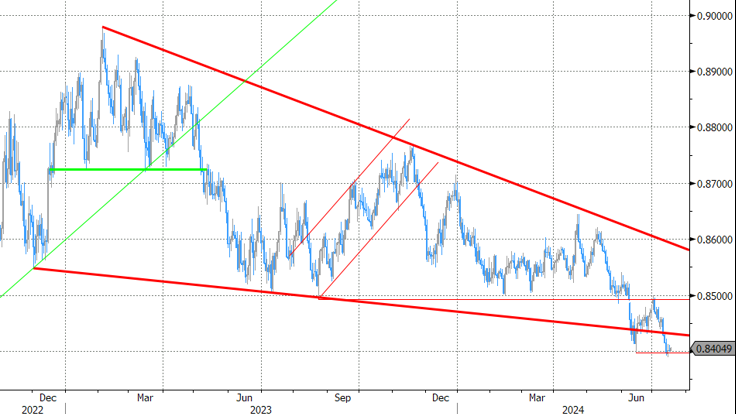
Debate at the BOE is focused at the timing of rate cuts. May headline inflation returned to 2%, but core measures weren’t in line with inflation sustainably returning to target any time soon. Still some BoE members at the June meeting appeared moving closer to a rate cut. Labour has yet to reveal its policy plans after securing a landslide election victory. EUR/GBP 0.84 is support is being tested.
EUR/GBP Daily Outlook
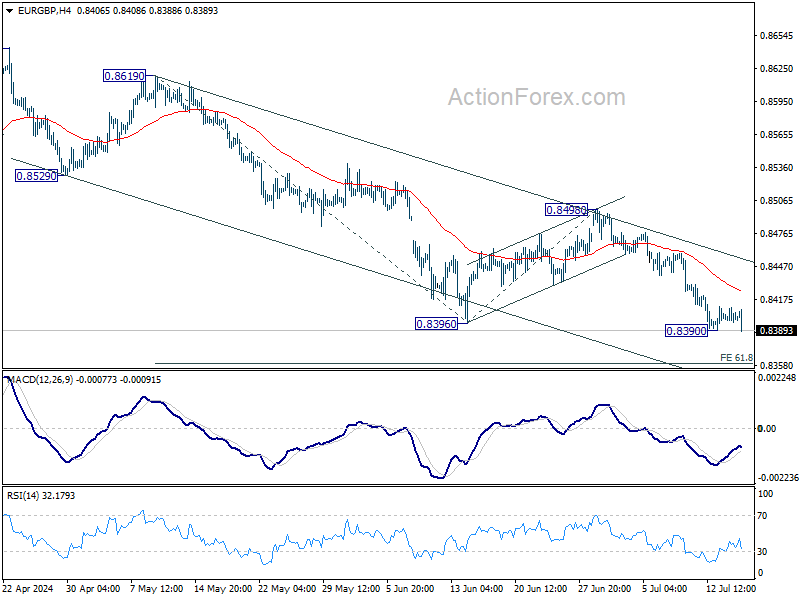
Daily Pivots: (S1) 0.8395; (P) 0.8403; (R1) 0.8408; More....
Immediate focus in on 0.8390 temporary low in EUR/GBP. Firm break there will resume larger down trend and target 61.8% projection of 0.8619 to 0.8396 from 0.8498 at 0.8360. While another recovery cannot be ruled out, outlook will stay bearish as long as 0.8498 resistance holds.
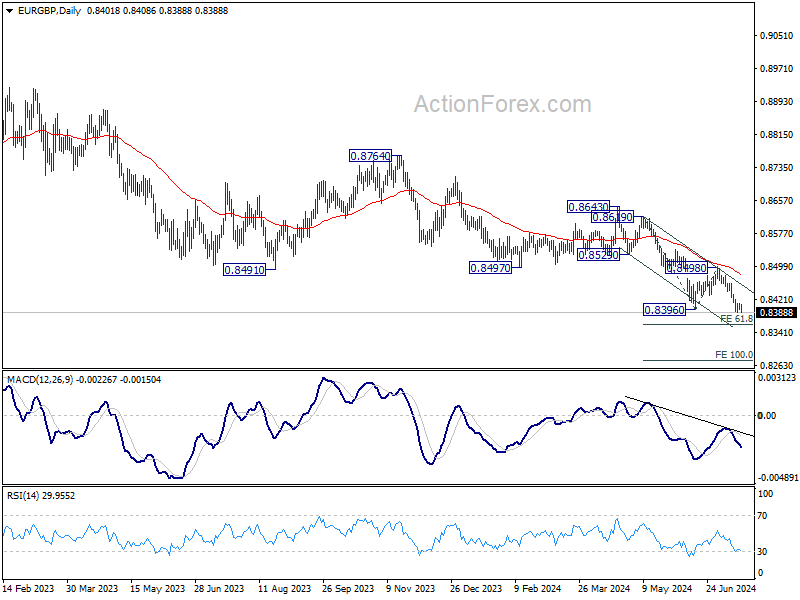
In the bigger picture, down trend from 0.9267 (2022 high) is in progress. Next target is 0.8201 key support (2022 low). For now, outlook will remain bearish as long as 0.8643 resistance holds, even in case of stronger rebound.
GBP/JPY Daily Outlook
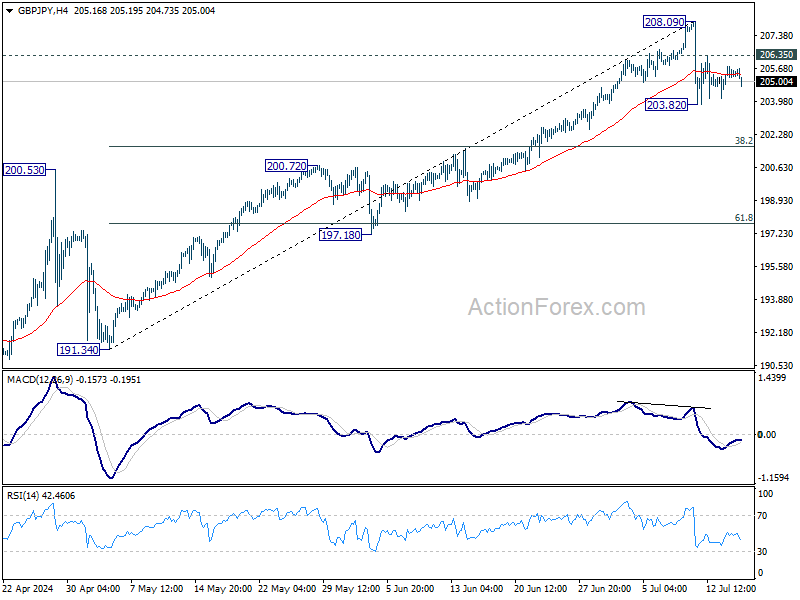
Daily Pivots: (S1) 204.94; (P) 205.37; (R1) 205.94; More...
Intraday bias in GBP/JPY stays neutral for consolidation above 203.82 temporary low. Corrective fall from 208.09 short term top could still extend lower. Break of 203.82 would target 38.2% retracement of 191.34 to 208.09 at 201.69. Strong support is expected there to bring rebound. On the upside, above 206.35 minor resistance will turn intraday bias will turn bias back to the upside for retesting 208.09. However, sustained break of 201.69 will argue that larger correction is already underway.
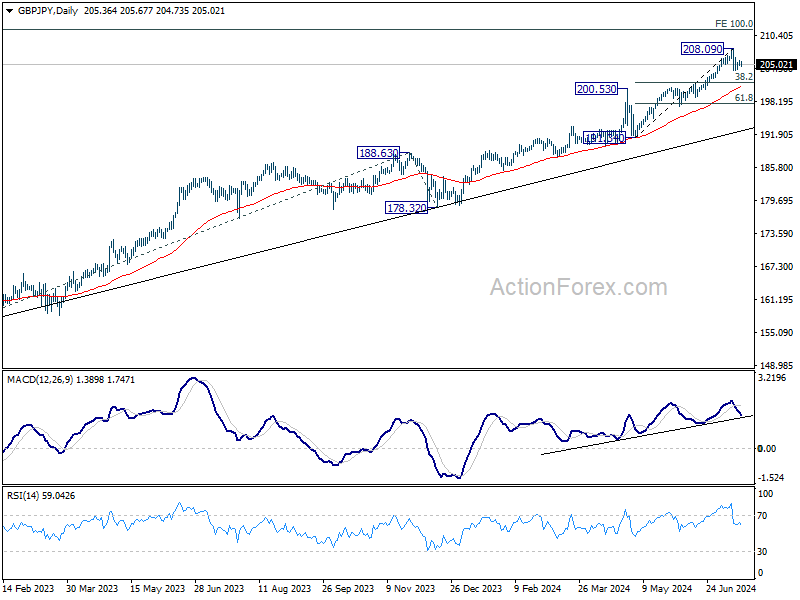
In the bigger picture, long term up trend is still in progress. Next target is 100% projection of 155.33 to 188.63 from 178.32 at 211.62. Outlook will stay bullish as long as 200.72 resistance turned support holds, even in case of deep pullback.
GBP/USD Daily Outlook
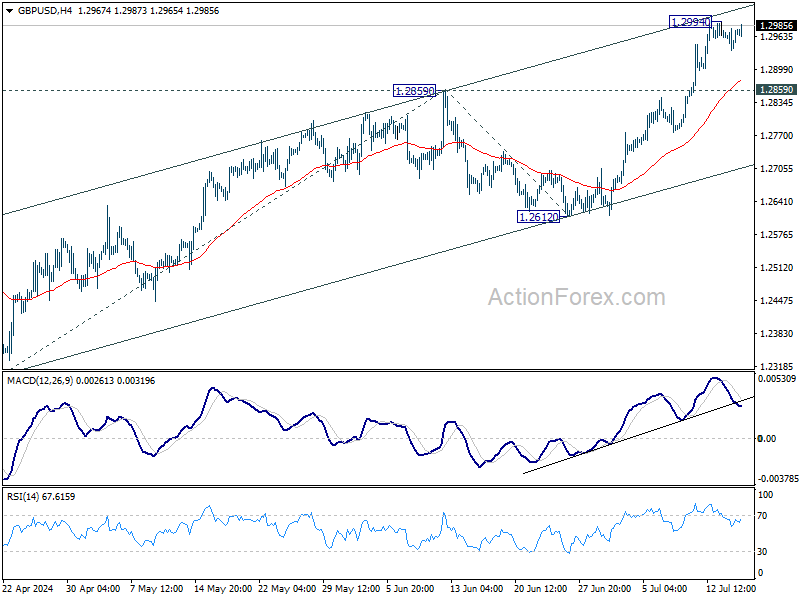
Daily Pivots: (S1) 1.2948; (P) 1.2965; (R1) 1.2992; More...
GBP/USD is staying in consolidation below 1.2994 temporary top and intraday bias remains neutral. Further rally is expected as long as 1.2859 resistance turned support holds. Above 1.2994 will resume the rally from 1.2298 and target 100% projection of 1.2298 to 1.2859 from 1.2612 at 1.3173, which is slightly above 1.3141 key medium term resistance. However, break of 1.2859 will turn bias to the downside for deeper pullback.
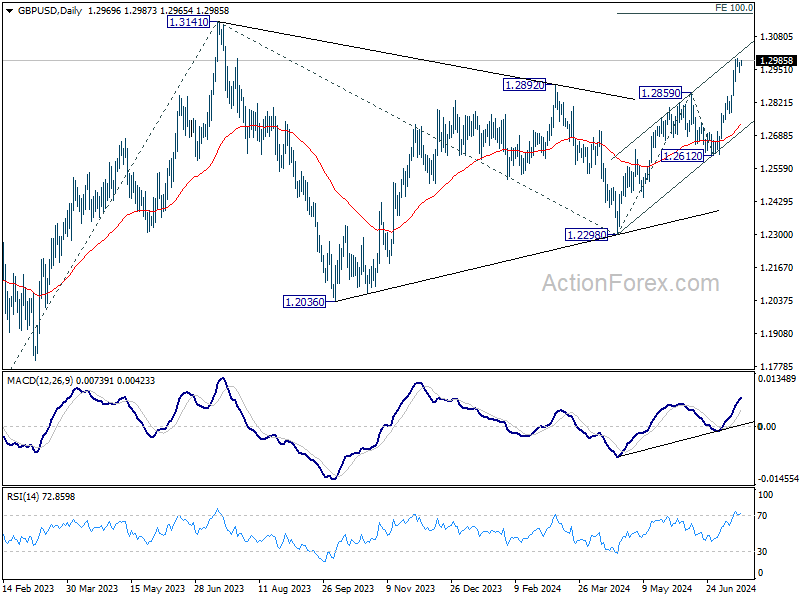
In the bigger picture, corrective pattern from 1.3141 medium term top (2023 high) could have completed with three waves to 1.2298 already. This will now remain the favored case as long as 1.2612 support holds. Firm break of 1.3141 will target 61.8% projection of 1.0351 (2022 low) to 1.3141 from 1.2298 at 1.4022.
Sterling Steady, Kiwi Rebounds, Gold Hits Record
Forex markets have been relatively subdued today. Sterling remains steady after June's UK CPI data revealed that both headline and core inflation were unchanged from the previous month. Significantly, services inflation also failed to cool, which could keep BoE cautious about making a premature rate cut on August 1. Some key members of the MPC may prefer to see further progress in disinflation before taking any action.
Earlier in Asian session, New Zealand Dollar showed a surprising rebound despite lower-than-expected Q2 CPI figures. Many economists have now revised their forecasts, anticipating the first RBNZ rate cut in November. Kiwi's bounce can be seen as a "cover-on-news" move, as the Q2 inflation data was not disastrous enough to cause major concern.
For the week so far, Swiss franc is leading as the best performer, followed by Dollar and Euro. New Zealand Dollar remains the weakest, with Australian Dollar and Canadian Dollar also underperforming. Yen and Pound are positioned in the middle of the performance spectrum.
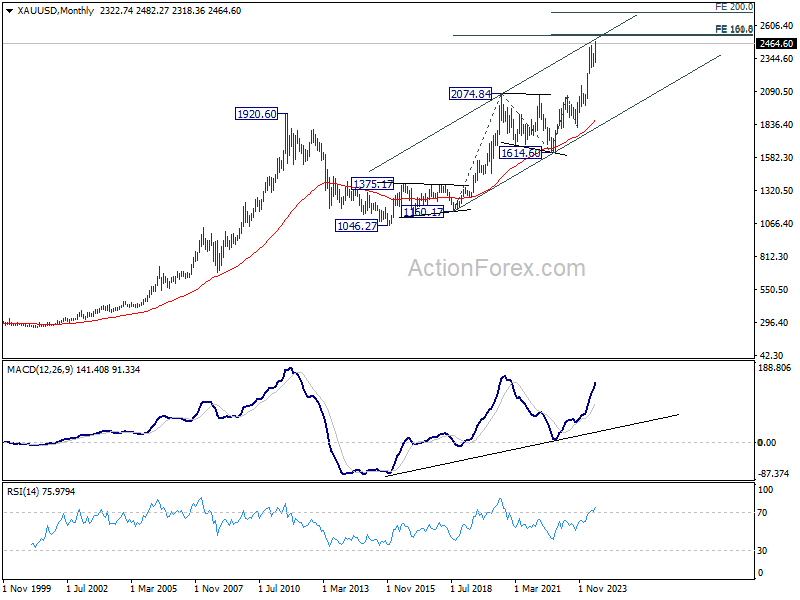
Technically, following up on our post yesterday, Gold did break to new record high. It's now facing a key cluster projection level at around 2500, with 100% projection of 1160.17 to 2074.84 from 1614.60 at 2529.27 and 161.8% projection of 1614.60 to 2062.95 from 1810.26 at 2535.96. Strong resistance could be seen from there to bring rebound.
However, decisive break above 2500/50 range could prompt upside acceleration to 200% projection of 1614.60 to 2062.95 from 1810.26 at 2706.96. For this upside acceleration to occur, broad-based selloff in Dollar might have to be seen, with EUR/USD breaking through 1.09 handle decisively.
In Asia, Nikkei fell -0.43%. Hong Kong HSI is up 0.01%. China Shanghai SSE is down -0.35%. Singapore Strait Times is down -0.01%. Japan 10-year JGB yield rose 0.0103 to 1.035. Overnight, DOW surged 1.85%. S&P 500 rose 0.64%. NASDAQ rose 0.20%. 10-year yield fell -0.062 to 4.167.
UK CPI steady at 2% in Jun, core CPI unchanged at 3.5%
UK CPI was unchanged at 2.0% yoy in June, matched expectations. CPI core (excluding energy, food, alcohol and tobacco) was unchanged at 3.5% yoy, above expectation of 3.4% yoy. CPI goods annual rate fell from -1.3% yoy to 1.4% yoy. CPI services annual rate was unchanged at 5.7% yoy.
For the month, CPI rose 0.1% mom , matched expectations.
New Zealand's CPI slows to 3.3% in Q2, vs exp 3.5%
New Zealand's CPI for Q2 rose by 0.4% qoq, down from previous quarter's 0.6% qoq and missing the expected 0.5% qoq.
Tradeable inflation, which includes goods and services that are subject to international competition, fell by -0.5% qoq, an improvement from previous -0.7% qoq. Conversely, non-tradeable inflation, covering domestic goods and services, rose by 0.9% qoq, down from prior 1.6% qoq.
Over the past 12 months, CPI growth rate slowed from 4.0% yoy to 3.3% yoy, falling short of anticipated 3.5% yoy. This marks the lowest level since Q2 2021 but remains slightly above RBNZ's target band of 1-3%.
Tradeable inflation saw a significant decline from 1.6% yoy to 0.3% yoy, reflecting lower imported inflationary pressures. Non-tradeable inflation also eased, dropping from 5.8% yoy to 5.4% yoy, indicating some cooling in domestic price pressures.
Australia's Westpac leading index ticks up to -0.13%, below trend growth persists
Australia's Westpac leading index saw a slight improvement, rising from -0.28% to -0.13% in June. Despite this uptick, economic activity is expected to remain below trend until early 2025.
Westpac said while growth is expected to pick up slightly in the latter half of 2024 and into early 2025, it will still be modest, at an annual pace of 2.2%, and is about flat in per capita terms.
Fed's Kugler signals rate cuts later this year amid continued disinflation
In a speech overnight, Fed Governor Adriana Kugler noted that despite "a few bumps" earlier in the year, inflation has "continued to trend down" across "all price categories."
She mentioned that supply and demand are "gradually coming into better balance," with supply bottlenecks easing and demand moderating due to high interest rates and the depletion of households' excess savings.
Kugler also pointed out that the labor market has seen "substantial rebalancing," with nominal wage growth moderating. This trend suggests that inflation will continue moving toward Fed's 2% target.
Kugler indicated that if economic conditions continue to evolve favorably, with more rapid disinflation and resilient employment, "it will be appropriate to begin easing monetary policy later this year." However, she stressed that her approach will remain data-dependent.
She added that if the labor market cools too much and unemployment rises due to layoffs, it might be necessary to cut rates "sooner rather than later." On the other hand, if data do not confirm that inflation is moving sustainably toward 2%, it may be appropriate to "hold rates steady for a little longer."
IMF's Gourinchas suggests Fed can wait before cutting rates
IMF chief economist Pierre-Olivier Gourinchas stated in a Reuters interview that Fed can afford to "wait a little bit" before lowering interest rates. He expected that one Fed rate cut is likely this year but refrained from specifying the timing.
Gourinchas noted that the IMF expects US inflation to reach Fed's 2% target in the first half of 2025, ahead of Fed's internal projection of 2026. This suggests that there would not be an "extended period" before rate cuts become appropriate.
Looking ahead
Eurozone CPI final will be released in European session. Later in the day, US will release building permits and housing starts, industrial production and capacity utilization. Fed will also publish the beige book economic report.
GBP/USD Daily Outlook
Daily Pivots: (S1) 1.2948; (P) 1.2965; (R1) 1.2992; More...
GBP/USD is staying in consolidation below 1.2994 temporary top and intraday bias remains neutral. Further rally is expected as long as 1.2859 resistance turned support holds. Above 1.2994 will resume the rally from 1.2298 and target 100% projection of 1.2298 to 1.2859 from 1.2612 at 1.3173, which is slightly above 1.3141 key medium term resistance. However, break of 1.2859 will turn bias to the downside for deeper pullback.
In the bigger picture, corrective pattern from 1.3141 medium term top (2023 high) could have completed with three waves to 1.2298 already. This will now remain the favored case as long as 1.2612 support holds. Firm break of 1.3141 will target 61.8% projection of 1.0351 (2022 low) to 1.3141 from 1.2298 at 1.4022.
Economic Indicators Update
| GMT | Ccy | Events | Actual | Forecast | Previous | Revised |
|---|---|---|---|---|---|---|
| 22:45 | NZD | CPI Q/Q Q2 | 0.40% | 0.50% | 0.60% | |
| 22:45 | NZD | CPI Y/Y Q2 | 3.30% | 3.50% | 4.00% | |
| 01:00 | AUD | Westpac Leading Index M/M Jun | 0.00% | 0.00% | ||
| 06:00 | GBP | CPI M/M Jun | 0.10% | 0.10% | 0.30% | |
| 06:00 | GBP | CPI Y/Y Jun | 2.00% | 2.00% | 2.00% | |
| 06:00 | GBP | Core CPI Y/Y Jun | 3.50% | 3.40% | 3.50% | |
| 06:00 | GBP | RPI M/M Jun | 0.20% | 0.20% | 0.40% | |
| 06:00 | GBP | RPI Y/Y Jun | 2.90% | 2.90% | 3.00% | |
| 06:00 | GBP | PPI Input M/M Jun | -0.80% | 0.10% | 0.00% | -0.60% |
| 06:00 | GBP | PPI Input Y/Y Jun | -0.40% | -0.10% | -0.70% | |
| 06:00 | GBP | PPI Output M/M Jun | -0.30% | 0.10% | -0.10% | 0.00% |
| 06:00 | GBP | PPI Output Y/Y Jun | 1.40% | 1.70% | ||
| 06:00 | GBP | PPI Core Output M/M Jun | 0.10% | 0.20% | ||
| 06:00 | GBP | PPI Core Output Y/Y Jun | 1.10% | 1.00% | ||
| 09:00 | EUR | Eurozone CPI Y/Y Jun F | 2.50% | 2.50% | ||
| 09:00 | EUR | Eurozone CPI Core Y/Y Jun F | 2.90% | 2.90% | ||
| 12:30 | USD | Building Permits Jun | 1.40M | 1.40M | ||
| 12:30 | USD | Housing Starts Jun | 1.30M | 1.28M | ||
| 13:15 | USD | Industrial Production M/M Jun | 0.30% | 0.90% | ||
| 13:15 | USD | Capacity Utilization Jun | 78.60% | 78.70% | ||
| 14:30 | USD | Crude Oil Inventories | -0.9M | -3.4M | ||
| 18:00 | USD | Beige Book |