Sample Category Title
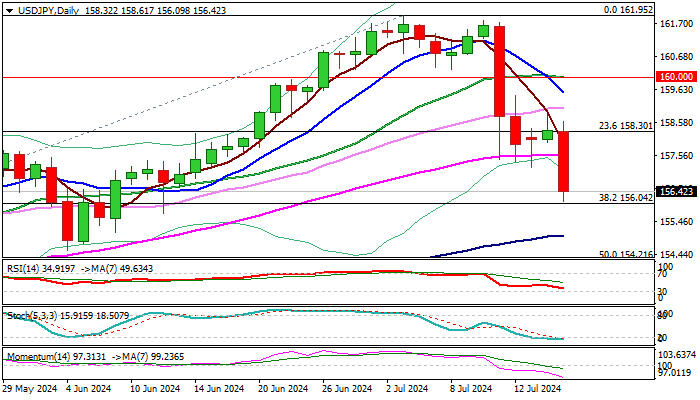
USD/JPY Outlook: Sharply Down, Markets Suspect Intervention
USDJPY was sharply down on Wednesday (down 1.3% during the European / early US session), with markets suspecting another intervention, after Japan’s authorities intervened in the market and pushed yen away from the lowest levels in nearly four decades..
Although comments from top officials were not clearly pointing to intervention, the size and the pace of the latest move suggests that authorities continued to buy yen, in attempts to further strengthen weakening currency.
Fresh drop is pressuring pivotal Fibo support at 156.04 (38.2% of 146.48/161.95), with firm break here to add to negative outlook and allow for stronger correction towards 100DMA (155.04) and Fibo 50% (154.21).
Strong negative momentum and MA’s (10/20/55) in bearish configuration support the notion, wit broken 55DMA (157.55) to ideally cap.
Res: 157.55; 158.30; 158.86; 159.52.
Sup: 156.04; 155.71; 155.04; 154.21.
Australian Dollar Eyes Employment Report
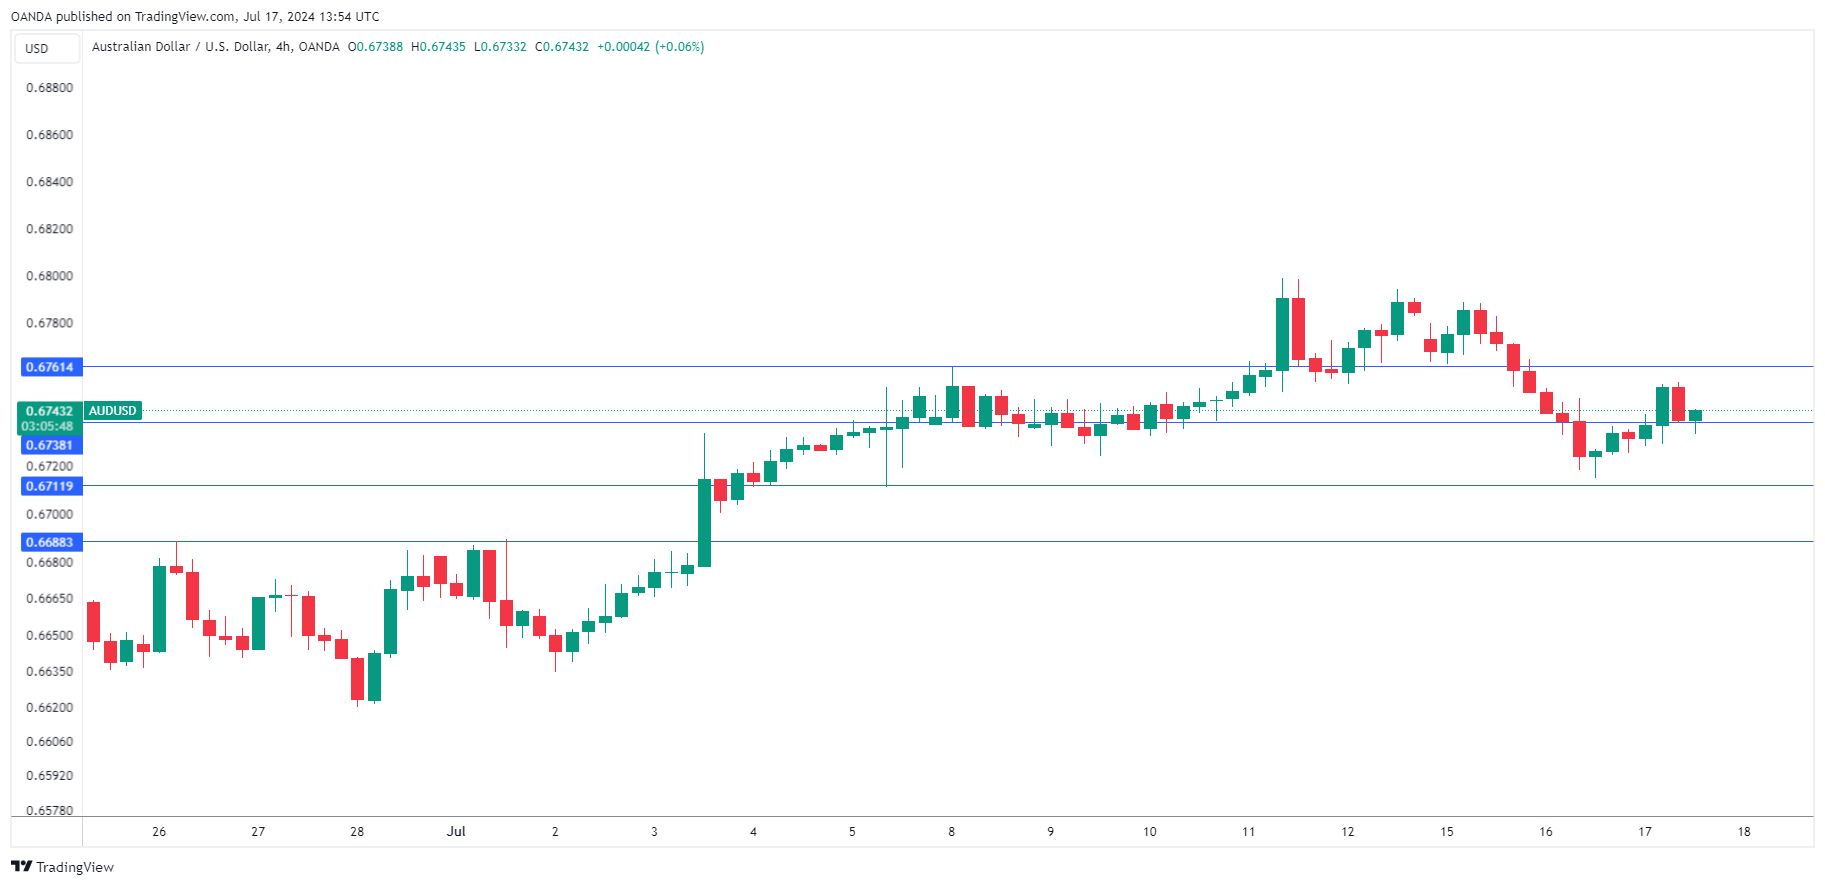
The Australian dollar is steady on Wednesday. AUD/USD is trading at 0.6743 early in the North American session, up 0.08% on the day.
Australia releases the June employment report early on Thursday. The market estimate stands at 20 thousand, compared to 39.7 thousand in May, which was a three-month high. The labor market has been tight, supporting the case for the Reserve Bank of Australia to avoid lowering interest rates.
Inflation hasn’t fallen as quickly as the RBA had hoped and unexpectedly rose in June from 3.6% to 4%, the highest level this year. The acceleration in inflation has policy makers concerned and the cautious RBA has kept the possibility of a rate hike on the table. The central bank has maintained the cash rate at 4.35% since December 2023 and a rate cut looks unlikely in the near term, barring an unexpected decline in inflation. The markets have priced in a 15% likelihood of a rate cut at the next meeting on August 6, according to the ASX RBA rate tracker.
We’ll hear from a host of Federal Reserve officials during the remainder of the week, and the markets will be hoping for insights about upcoming rate decisions. On Tuesday, Fed Governor Adriana Kugler said she was “cautiously optimistic” that inflation was returning the 2% target, noting that recent inflation readings have been softer than expected and wage growth has eased. Kugler didn’t provide a time line for a rate cut but said it would be appropriate to lower rates “later this year”.
AUD/USD Technical
- AUD/USD is testing resistance at 0.6738. Above, there is resistance at 0.6761
- 0.6711 and 0.6688 are the next support levels
Sunset Market Commentary
Markets
After last-week’s softer than expected US CPI data, global investors gained ever greater confidence that the Fed will embark for a genuine, protracted easing cycle soon. Yields turned south, especially at the short end of the (US) yield curve. The dollar faced an uphill battle, but losses after all remained modest. Key support levels mostly survived. Even as (US) yields steadied, FX markets today tried/succeded some kind of catching up move. Remarkably, this USD decline occurred even as equities mostly trade in red, pondering the impact of a protectionist Trump trade policy regarding IT-related exports to China (amongst others). It has been different of late and a yen rebound after presumed BOJ interventions stalled earlier this week. Even so, today the Japanese currency was first to profit from a weak USD and forced the break. USD/JPY dropped below the 157.19 correction low, triggering further stop-loss unwinding of stale yen-short/USD-long positions. At 156.40, USD/JPY trades about 3.5% below the multi-year peak touched early this month. The euro isn’t the front-runner to profit from the USD setback, but the USD/JPY decline also pushed EUR/USD beyond 1.0916/20 resistance (currently 1.0945). The 1.0981 March top is the last stop before the 1.10 barrier. The broader USD decline and easing of global financing conditions broadly supports smaller currencies that are often sensitive to global (risk)sentiment (NOK, SEK, AUD, CAD and NZD, the latter after mixed domestic CPI data). In CEE, the Czech krone and the forint also succeded modest gains. The zloty, regional outperformer YTD, for the second day in row lost ground. We saw no obvious trigger for PLN underperformance. The technical break in several major USD cross rates is noteworthy, but we look out whether/how long this combination of USD-weakness and equity risk-off lasts.
Cable (1.3035) today was squeezed beyond the 1.30 barrier, a level last seen this time last year. Aside from USD weakness, sterling strength was also in play. The UK currency of late profited from a return of political stability after the UK Parliamentary election. Today, UK inflation data didn’t provide a clear trigger for the BoE to aggressively downsize sterling’s interest rate support anytime soon. At 0.1% M/M and 2% Y/Y, UK inflation for the second consecutive month matched the BoE target. Still, core- 3.5 % Y/Y and services inflation (5.7% Y/Y) flagged a clear warning signal that there is some work to do for the BoE. The minutes of the June meeting showed that the unchanged decision at that time was a rather close call as several members wanted to gradually scale back policy restriction. Today’s data don’t make it easier for ‘middle-of-the-road’ MPC members to change camp already at the August meeting. UK monetary policy is again drifting closer to the Fed’s path rather than to an ECB scenario. UK yields added between 3.5 bps (2-y) and 2.5 bps (30-y). The market now only sees a <40% chance on an August rate cut vs almost 50% before to data. UK labour data (tomorrow) and retail sales (Friday) might further finetune the debate. EUR/GBP (0.8385) is trading at the lowest level in almost 2-year with the Augst 2022 low (0.834) the next reference on the technical charts.
News & Views
Belgian newspaper De Tijd reports that Belgium is running a €27.8bn budget deficit according to preliminary data by the Budget Monitoring Committee in preparation of federal formation talks (4.6% of GDP). That’s close to the €27.5bn estimated by the outgoing government. For next year, the deficit is expected to widen to €29.4 bn. Under unchanged policy settings, this rises to €46.5bn by 2029 (vs previous estimate of €45bn). The lion share of these deficits are on a federal rather than regional level. To comply with EU rules, the federal government needs to finds €27.6bn by 2029.
An analysis by the National Bank of Poland showed that domestic companies expect their financial conditions to worsen in Q3 amid demand worries. A particularly clear weakening of demand forecasts was noted in consumer services and in the construction industry. Companies lowered their employment forecasts and reduced their planned increase in salaries. The number of companies planning new investment has decreased as well.
Graphs
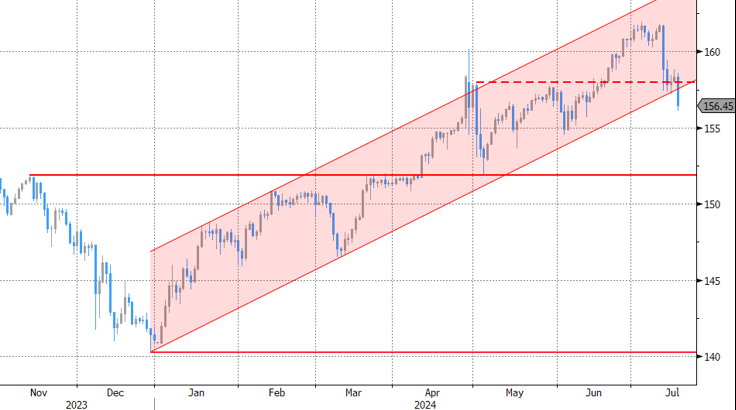
USD/JPY: Yen taking the lead on broad USD correction
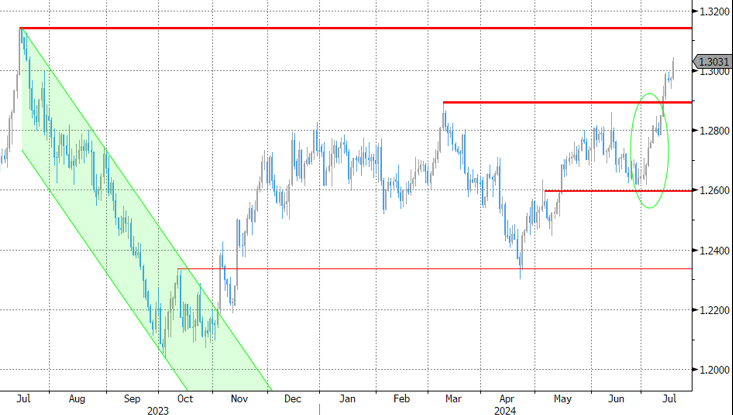
Cable (GBP/USD) jumping beyond 1.30 for the first time in a year as BoE maybe won’t be able to frontrun Fed policy easing.
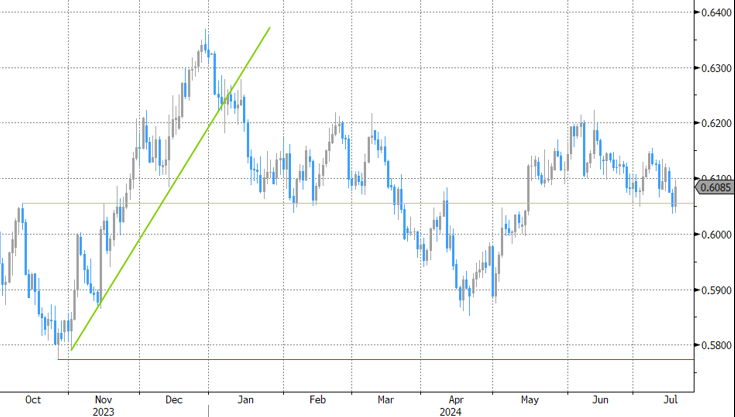
NZD/USD: mixed New Zealand inflation report raises doubts on August RBNZ rate cut. Kiwi dollar rebounds.
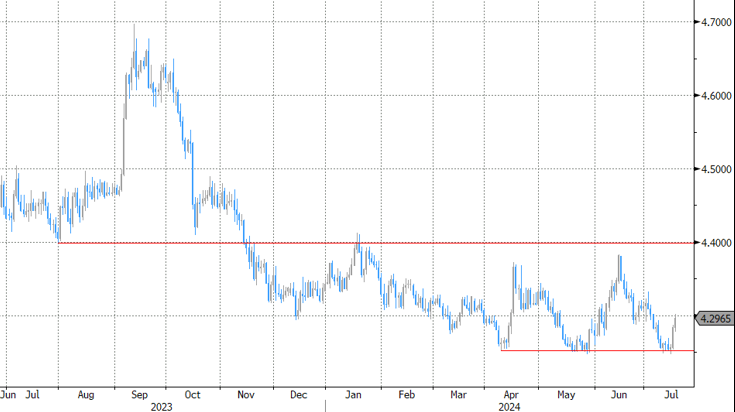
EUR/PLN: zloty underperforms as EUR/PLN 4.25 proves tough support (zloty resistance).
EUR/CHF Technical: Euro Underperformance Over Swiss Franc May Have Resumed
- The recent 4-week rally of EUR/CHF from 19 June has started to show signs of exhaustion.
- The ongoing weakness of the France CAC 40 has triggered a negative feedback loop towards EUR/CHF.
- Watch the 0.9780 key short-term resistance on the EUR/CHF.
The EUR/CHF cross pair has managed to recover its initial losses inflicted from 10 June to 19 June that has been triggered by the political uncertainties from the abrupt French legislation snap election announcement made by French President Macron on 9 June.
It has rallied by 295 pips/3.10% from the 19 June low to hit an intraday high of 0.9774 on 15 July on the onset of the 2nd round of the French legislation election on 7 July which resulted in a hung parliament as neither party (far-right, far-left, and Marcon’s centrist alliance) managed to gain a single majority foothold.
Weakness in the French stock market has stalled the rally in EUR/CHF
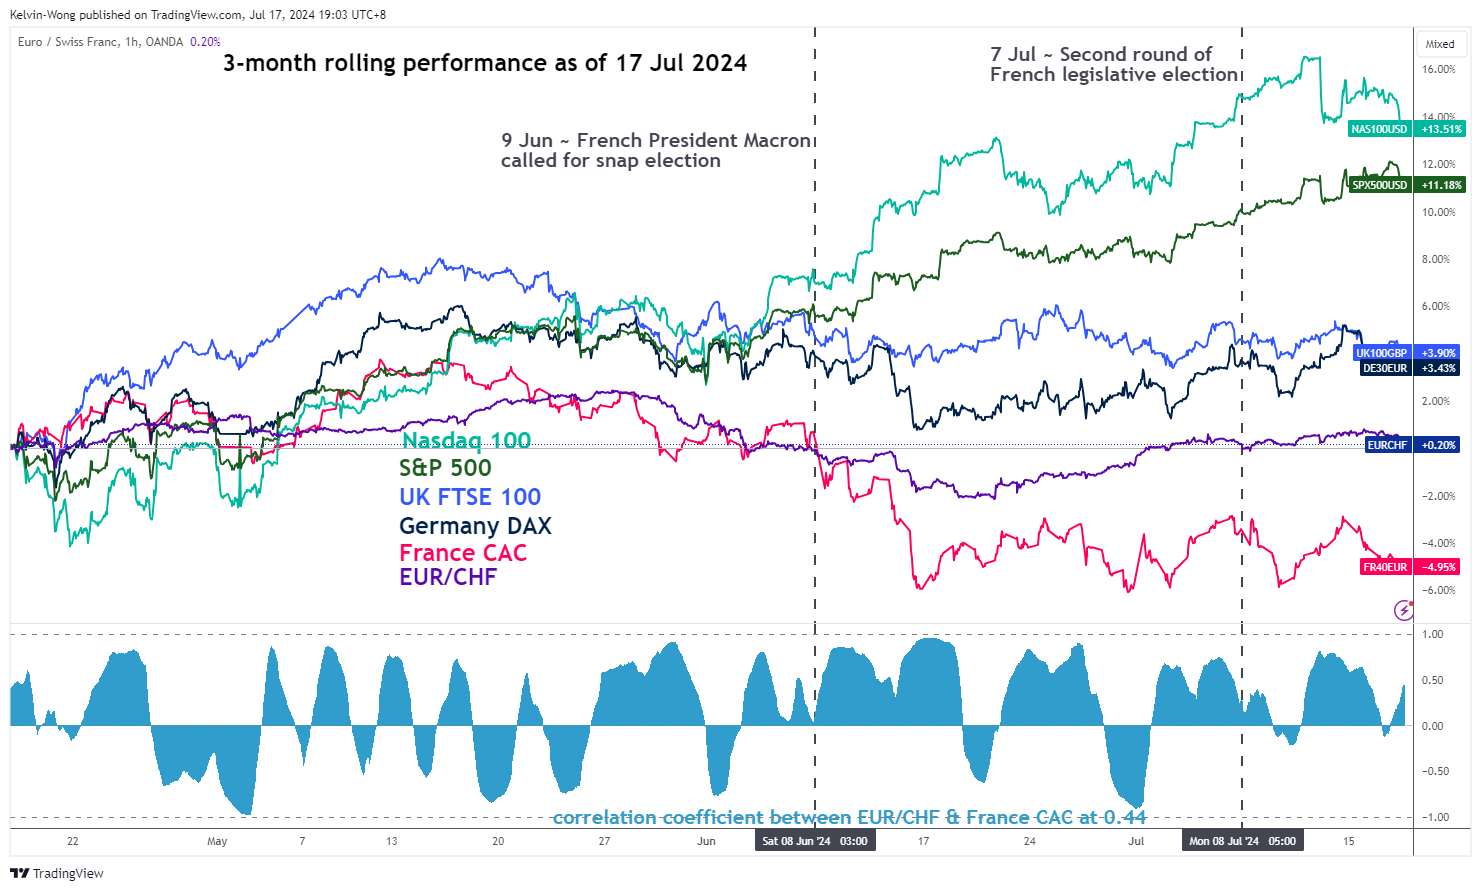
Fig 1: 3-month rolling performance CAC 40, EUR/CHF & other major stock indices (US, Germany, UK) as of 17 July 2024 (Source: TradingView, click to enlarge chart)
Based on a three-month rolling performance time frame, the French benchmark stock index, CAC 40 has continued to languish ex-post 2nd round of the Fench legislation election. It has recorded a loss of -5% at this time of the writing and underperformed against the German DAX (+3.45%), UK FTSE 100 (+3.90%), US S&P 500 (+11.17%), and US Nasdaq 100 (+13.50%) over the same period (see Fig 1).
Interestingly, the current weakness seen in the French CAC 40 seems to have a negative feedback loop cascading effect on the EUR/CHF as its 60-period rolling correlation coefficient has increased significantly to 0.44 from -0.11 seen previously on Tuesday, 16 July.
Bearish momentum condition detected in EUR/CHF
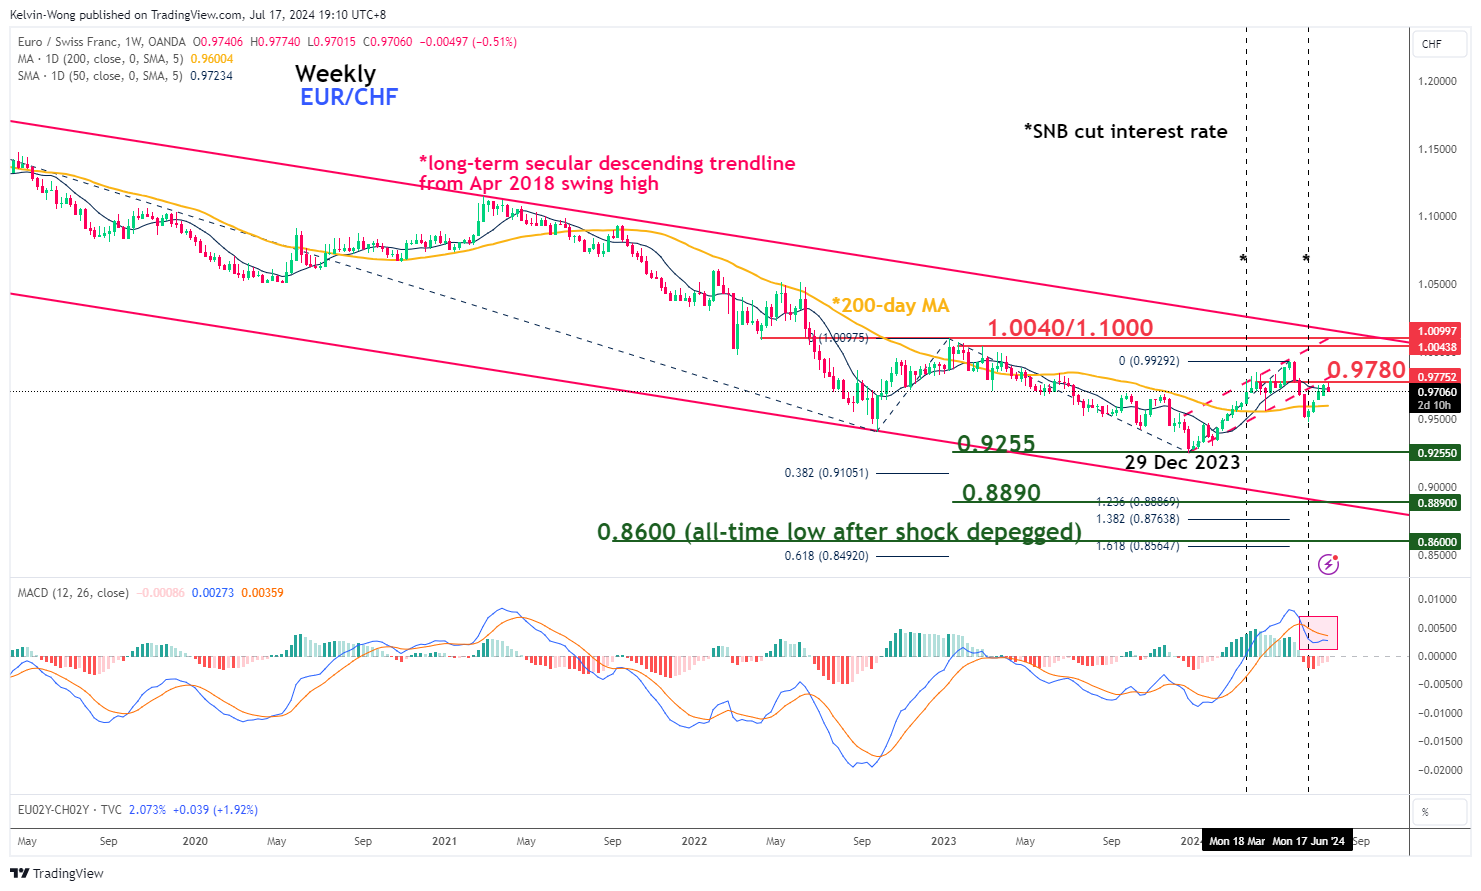
Fig 2: EUR/CHF major trend as of 17 Jul 2024 (Source: TradingView, click to enlarge chart)
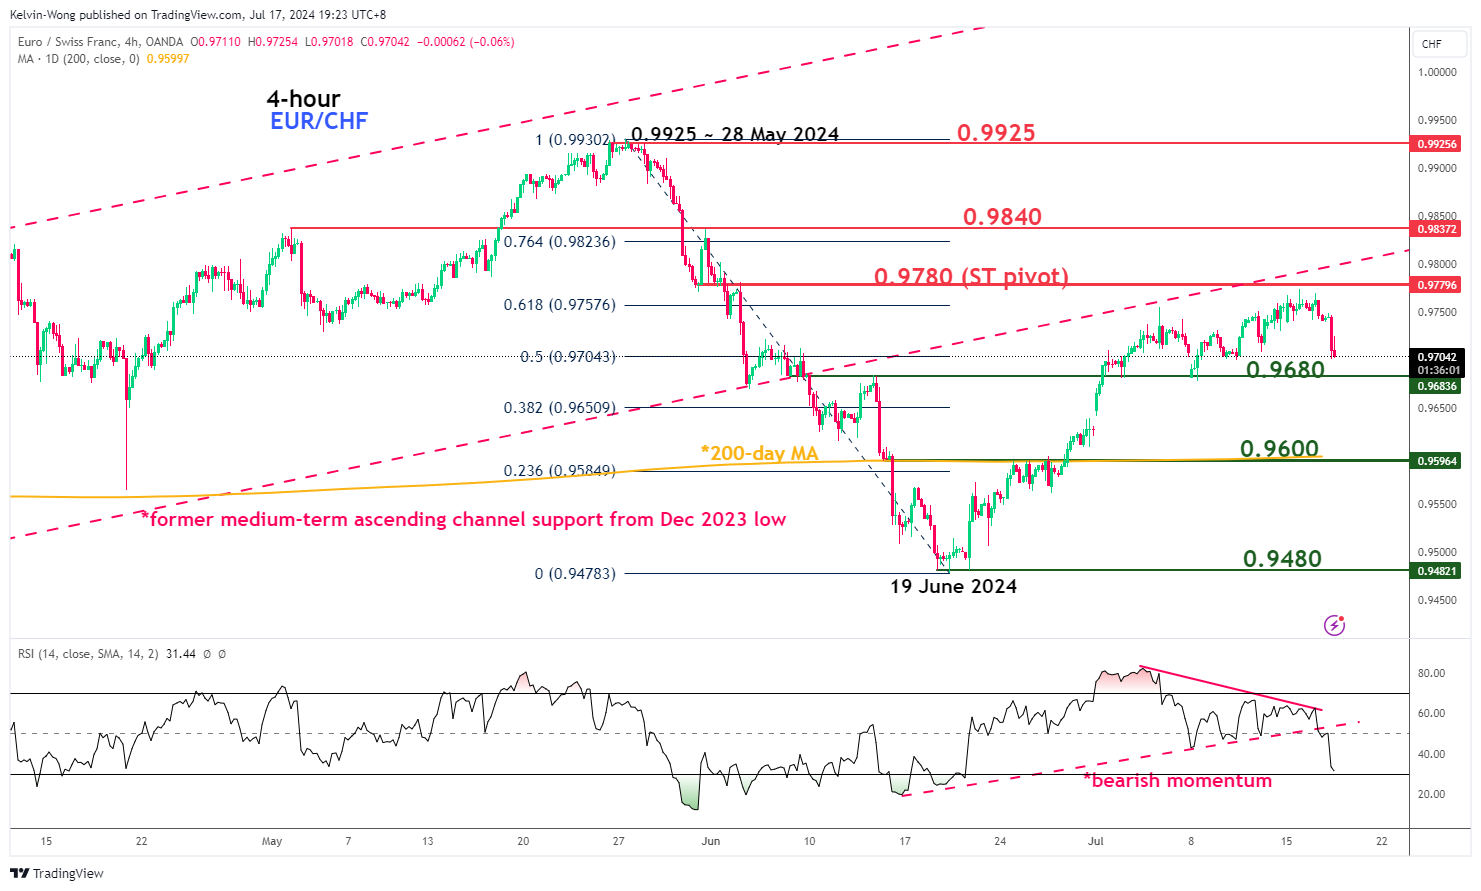
Fig 3: EUR/CHF short-term trend as of 17 Jul 2024 (Source: TradingView, click to enlarge chart)
The prior 4-week rally of EUR/CHF from 19 June to 15 July has stalled at a key resistance area of 0.9780 which confluences with the former medium-term ascending channel support from 29 December 2023 low and the 61.8% Fibonacci retracement of the most recent decline from 28 May 2024 high to 19 June 2024 low.
In addition, the weekly MACD trend indicator and its signal line have continued to inch downward after a bearish crossover signal flashed out on the week of 10 June (see Fig 2).
Also, the shorter-term 4-hour RSI momentum indicator has just staged a bearish momentum breakdown below its former ascending support on Tuesday, 16 June after a prior bearish divergence condition seen at its overbought zone.
These observations suggest that short to medium-term bearish momentum conditions have resurfaced on the EUR/CHF.
If the 0.9780 key short-term pivotal resistance is not surpassed to the upside, and a break below 0.9680 near-term support may see further weakness on the EUR/CHF to expose the next intermediate supports at 0.9600 (also the 200-day moving average) and 0.9480 in the first step (see Fig 3).
On the other hand, a clearance above 0.9780 negates the bullish tone for the next intermediate resistances to come in at 0.9840 and 0.9925.
USD/JPY Mid-Day Outlook
Daily Pivots: (S1) 157.93; (P) 158.39; (R1) 158.88; More...
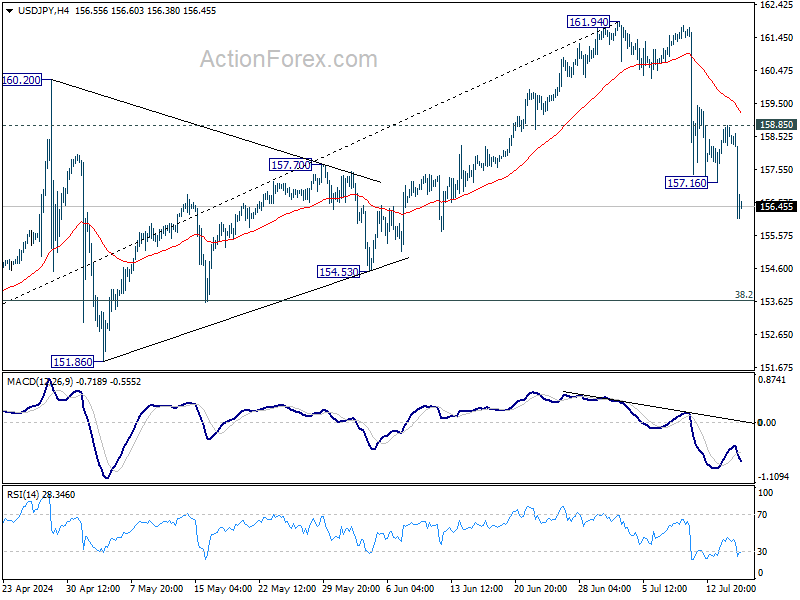
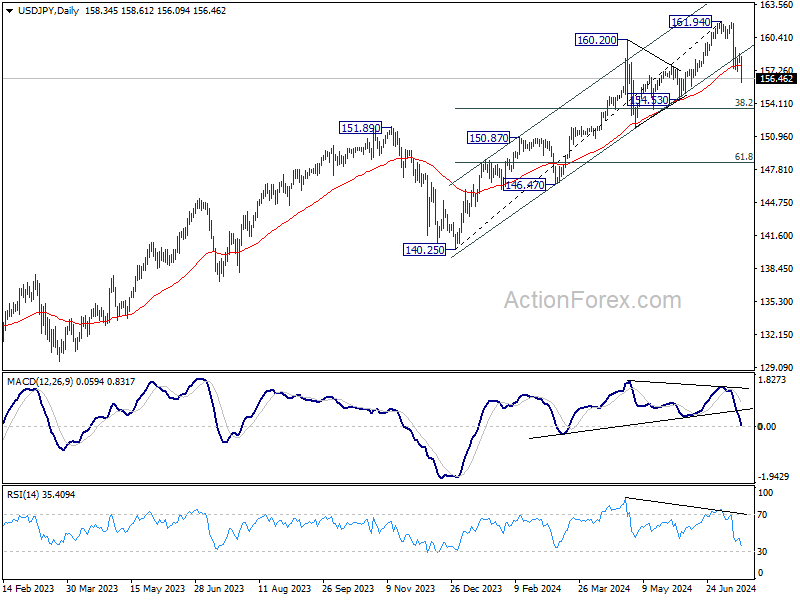
USD/JPY's fall from 161.94 resumed by breaking through 157.16 support and intraday bias is back on the downside. Current decline is seen as correcting whole rally from 140.25. Sustained trading below 55 D EMA (now at 157.72) will bring deeper correction to 38.2% retracement of 140.25 to 161.94 at 163.65. On the upside, above 158.85 resistance will turn bias back to the upside for stronger rebound instead.
In the bigger picture, as long as 151.89 resistance turned support holds, long term up trend could still continue through 161.94 at a later stage. Next target will depend on the depth of the current correction from 161.94. However, sustained break of 151.89 will argue that larger scale correction or trend reversal is underway.
USD/CHF Mid-Day Outlook
Daily Pivots: (S1) 0.8922; (P) 0.8951; (R1) 0.8967; More…
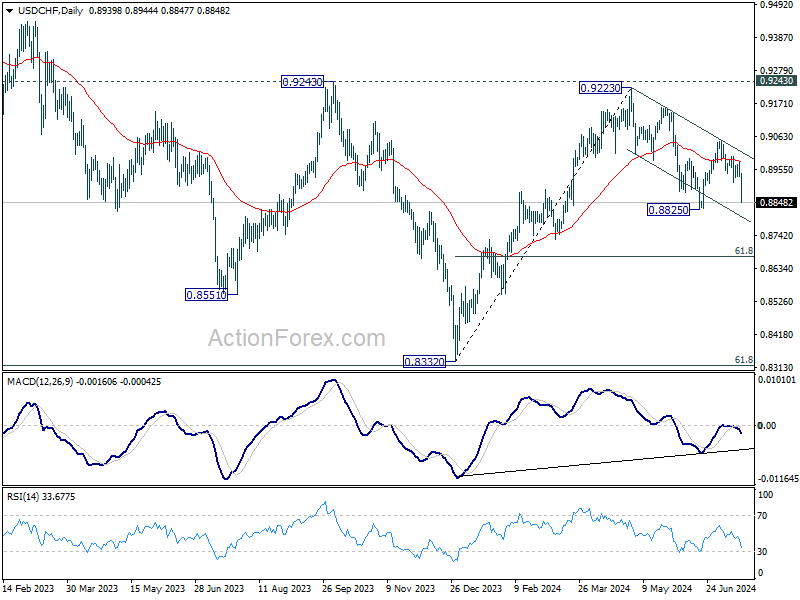
Intraday bias in USD/CHF is back on the downside as fall from 0.9049 resumed through 0.8914 temporary low. Deeper decline is expected to retest 0.8825 support next. Firm break there will resume whole fall from 0.9223 and target 60% retracement of 0.8332 to 0.9223 at 0.8672 next. On the upside, above 0.8914 support turned resistance will turn intraday bias neutral first.
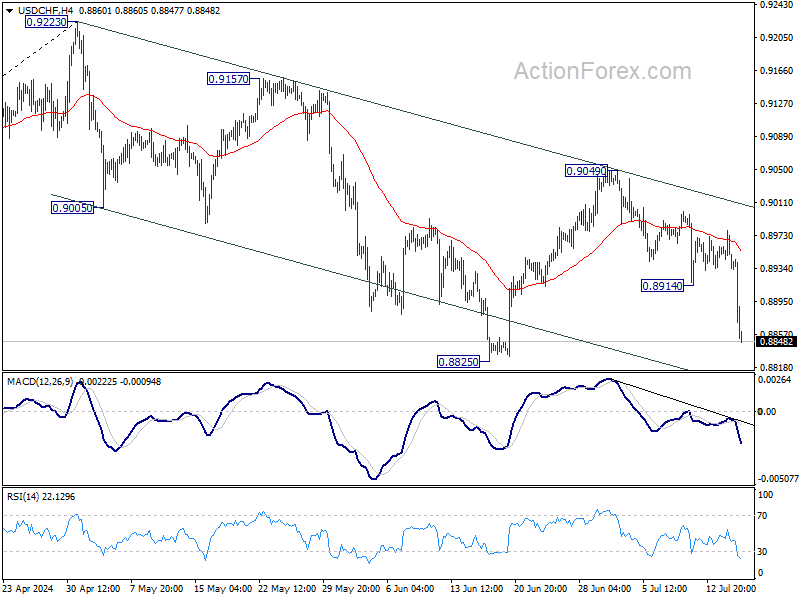
In the bigger picture, with 0.9243 resistance intact, medium term outlook in USD/CHF is neutral at best. For now, more sideway trading is likely between 0.8332/9243. However, firm break of 0.9243 will indicate larger bullish trend reversal.
EUR/USD Mid-Day Outlook
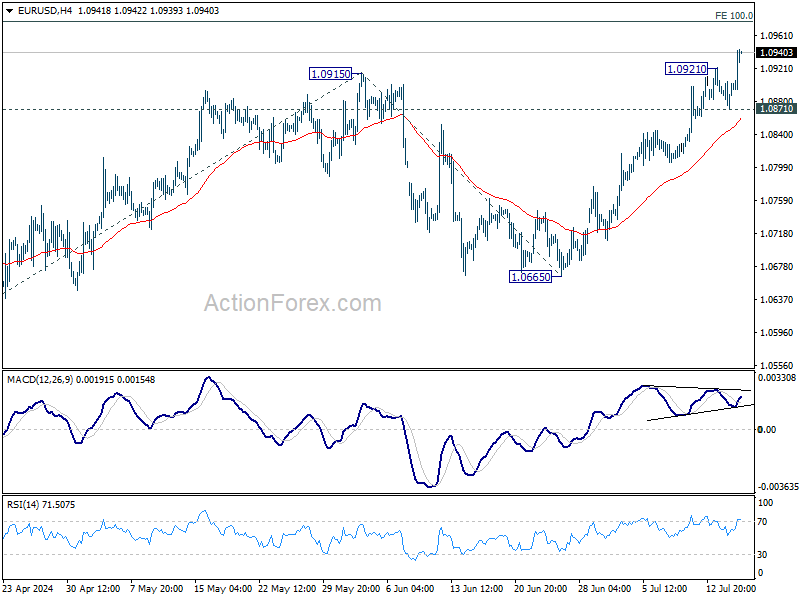
Daily Pivots: (S1) 1.0877; (P) 1.0900; (R1) 1.0916; More....
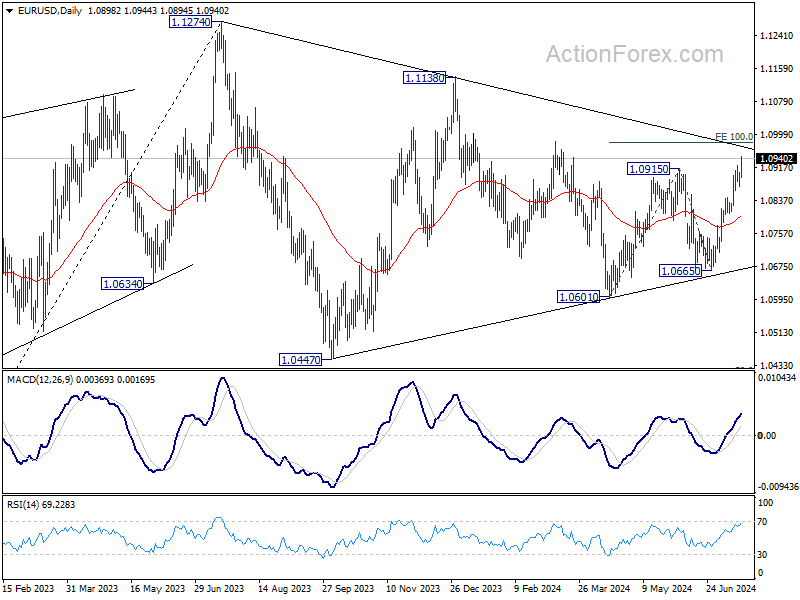
EUR/USD's rally resumed after brief consolidations and intraday bias is back on the upside. Break of 1.0915 resistance should now extend the rise from 1.0601 to 100% projection of 1.0601 to 1.0915 from 1.0665 at 1.0979. On the downside, below 1.0871 minor support will turn intraday bias neutral gain first.
In the bigger picture, price actions from 1.1274 are viewed as a corrective pattern, possibly a triangle, that's still be in progress. Break of 1.1138 resistance will be the first signal that rise from 0.9534 (2022 low) is ready to resume through 1.1274 (2023 high). This will now remain the favored case as long as 1.0601 support holds.
GBP/USD Mid-Day Outlook
Daily Pivots: (S1) 1.2948; (P) 1.2965; (R1) 1.2992; More...
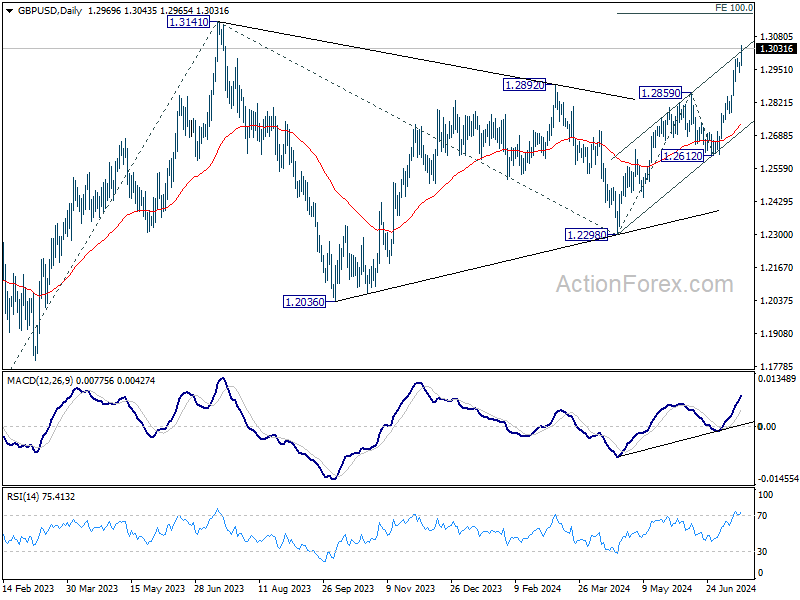
GBP/USD's rally resumed after brief consolidations and intraday bias is back on the upside. Current rise from 1.2298 should target 100% projection of 1.2298 to 1.2859 from 1.2612 at 1.3173, which is slightly above 1.3141 key medium term resistance. On the downside, below 1.2937 minor support will turn intraday bias neutral again first.
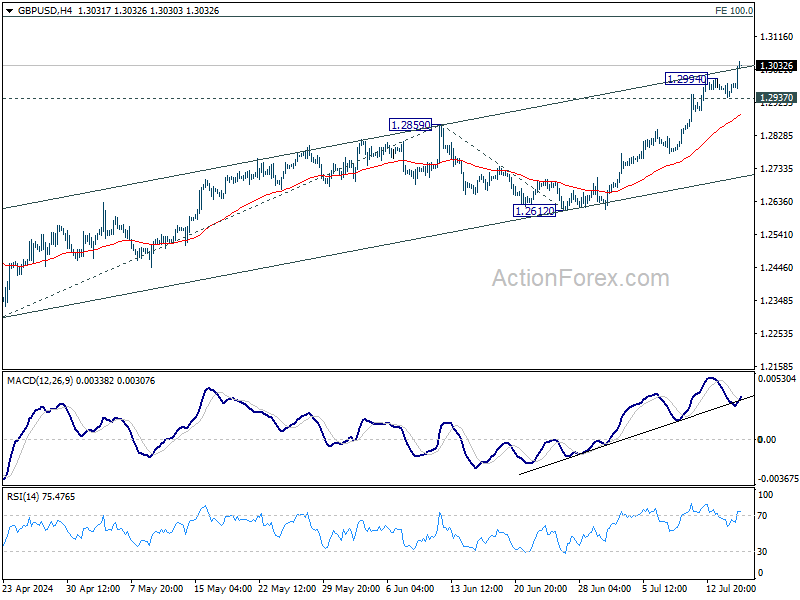
In the bigger picture, corrective pattern from 1.3141 medium term top (2023 high) could have completed with three waves to 1.2298 already. This will now remain the favored case as long as 1.2612 support holds. Firm break of 1.3141 will target 61.8% projection of 1.0351 (2022 low) to 1.3141 from 1.2298 at 1.4022.
Yen Jumps Amid Rumored Intervention; Pound Rises with Fading BoE Rate Cut Hopes
Yen surged significantly against all major currencies during European session, with speculation on whether Japan has intervened again in the markets. Last week, it was rumored that Japanese authorities had spent JPY 3.5 trillion to prop up Yen. Despite this, top officials have been tight-lipped, refusing to confirm any direct actions. Outgoing top currency diplomat Masato Kanda remarked today, "I have no choice but to respond appropriately if there are excessive moves caused by speculators," further fueling speculation without providing concrete details.
Meanwhile, Sterling saw a slightly delayed yet robust reaction to the latest UK CPI data. The inflation figures, including headline, core, and services inflation, did not decline as some hoped. This has led the markets to reduce their bets on a BoE rate cut in August. Even though the headline inflation rate remained at BoE's 2% target, the persistently high services inflation at 5.7% would keep the hawks within the MPC on alert for resurgence of inflationary pressures. Consequently, money markets now see less than 25% chance of an August cut, down from around 50% before the data release.
Overall, in the currency markets, Dollar has been the weakest performer for the day, facing significant selling pressure from both Yen and European majors. Canadian and Australian Dollars also exhibited weakness. Leading the pack is Yen, followed by Pound and Swiss Franc, while Euro and Kiwi find themselves in a middle-ground position.
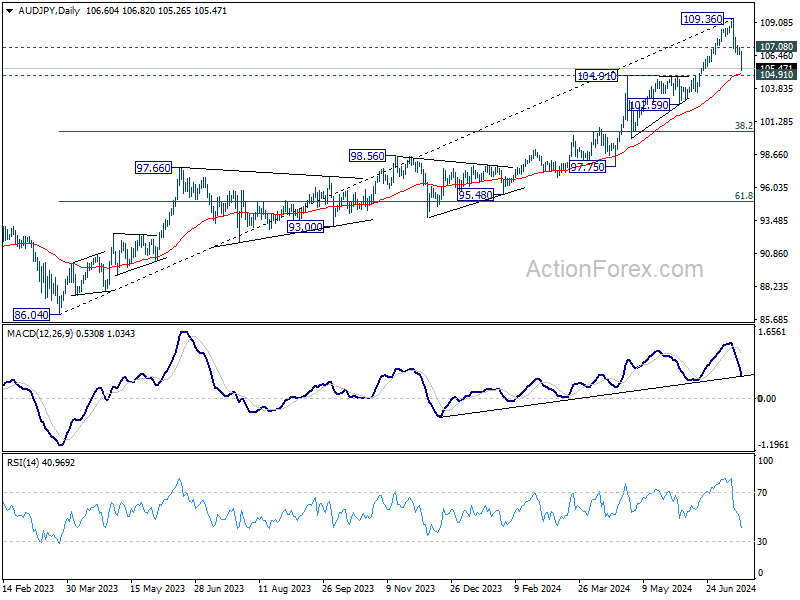
Technically, AUD/JPY dives sharply today and it's now in proximity to a key support zone of 104.91 and 55 D EMA (now at 105.02). Strong bounce from current level, followed break of 107.08 resistance, will argue that the pullback has completed,. That would also keep the medium term up trend intact for another rise through 109.36 at a later stage.
However, decisive break of 104.91 will argue that AUD/JPY is probably already correcting whole rise from 86.04. Australian job data, expected in the upcoming Asian session, could significantly influence the chances of another RBA rate hike and trigger the next market move.
In Europe, at the time of writing, FTSE is up 0.08%. DAX is down -0.48%. CAC is down -0.47%. UK 10-year yield is up 0.0334 at 4.086. Germany 10-year yield is up 0.0115 at 2.441. Earlier in Asia, Nikkei fell -0.43%. Hong Kong HSI rose 0.06%. China Shanghai SSE fell -0.45%. Singapore Strait Times rose 0.05%. Japan 10-year JGB yield rose 0.0078 to 1.032.
Fed's Williams sees positive signs in inflation trend, awaiting more data
New York Fed President John Williams, in an interview with the Wall Street Journal, indicated that recent inflation readings over the past three months are "getting us closer to a disinflationary trend that we're looking for," noting these as "positive signs."
However, Williams emphasized the need for "more data to gain further confidence" that inflation is moving sustainably toward the Fed's 2% goal. He expressed satisfaction with the current policy stance, stating, "I feel like the stance of policy right now is working well."
Williams suggested that if the favorable data trend continues, he would gain "greater confidence that inflation is moving sustainably to 2%."
Eurozone CPI finalized at 2.5% in Jun, core at 2.9%
Eurozone CPI was finalized at 2.5% yoy in June, down from May's 2.6% yoy. CPI core (ex-energy, food, alcohol & tobacco) was finalized at 2.9% yoy, unchanged from prior month's reading. The highest contribution to annual inflation rate came from services (+1.84 percentage points, pp), followed by food, alcohol & tobacco (+0.48 pp), non-energy industrial goods (+0.17 pp) and energy (+0.02 pp).
EU CPI was finalized at 2.6% yoy, down from May's 2.7% yoy. The lowest annual rates were registered in Finland (0.5%), Italy (0.9%) and Lithuania (1.0%). The highest annual rates were recorded in Belgium (5.4%), Romania (5.3%), Spain and Hungary (both 3.6%). Compared with May 2024, annual inflation fell in seventeen Member States, remained stable in one and rose in nine.
UK CPI steady at 2% in Jun, core CPI unchanged at 3.5%
UK CPI was unchanged at 2.0% yoy in June, matched expectations. CPI core (excluding energy, food, alcohol and tobacco) was unchanged at 3.5% yoy, above expectation of 3.4% yoy. CPI goods annual rate fell from -1.3% yoy to 1.4% yoy. CPI services annual rate was unchanged at 5.7% yoy.
For the month, CPI rose 0.1% mom , matched expectations.
New Zealand's CPI slows to 3.3% in Q2, vs exp 3.5%
New Zealand's CPI for Q2 rose by 0.4% qoq, down from previous quarter's 0.6% qoq and missing the expected 0.5% qoq.
Tradeable inflation, which includes goods and services that are subject to international competition, fell by -0.5% qoq, an improvement from previous -0.7% qoq. Conversely, non-tradeable inflation, covering domestic goods and services, rose by 0.9% qoq, down from prior 1.6% qoq.
Over the past 12 months, CPI growth rate slowed from 4.0% yoy to 3.3% yoy, falling short of anticipated 3.5% yoy. This marks the lowest level since Q2 2021 but remains slightly above RBNZ's target band of 1-3%.
Tradeable inflation saw a significant decline from 1.6% yoy to 0.3% yoy, reflecting lower imported inflationary pressures. Non-tradeable inflation also eased, dropping from 5.8% yoy to 5.4% yoy, indicating some cooling in domestic price pressures.
GBP/USD Mid-Day Outlook
Daily Pivots: (S1) 1.2948; (P) 1.2965; (R1) 1.2992; More...
GBP/USD's rally resumed after brief consolidations and intraday bias is back on the upside. Current rise from 1.2298 should target 100% projection of 1.2298 to 1.2859 from 1.2612 at 1.3173, which is slightly above 1.3141 key medium term resistance. On the downside, below 1.2937 minor support will turn intraday bias neutral again first.
In the bigger picture, corrective pattern from 1.3141 medium term top (2023 high) could have completed with three waves to 1.2298 already. This will now remain the favored case as long as 1.2612 support holds. Firm break of 1.3141 will target 61.8% projection of 1.0351 (2022 low) to 1.3141 from 1.2298 at 1.4022.
Economic Indicators Update
| GMT | Ccy | Events | Actual | Forecast | Previous | Revised |
|---|---|---|---|---|---|---|
| 22:45 | NZD | CPI Q/Q Q2 | 0.40% | 0.50% | 0.60% | |
| 22:45 | NZD | CPI Y/Y Q2 | 3.30% | 3.50% | 4.00% | |
| 01:00 | AUD | Westpac Leading Index M/M Jun | 0.00% | 0.00% | ||
| 06:00 | GBP | CPI M/M Jun | 0.10% | 0.10% | 0.30% | |
| 06:00 | GBP | CPI Y/Y Jun | 2.00% | 2.00% | 2.00% | |
| 06:00 | GBP | Core CPI Y/Y Jun | 3.50% | 3.40% | 3.50% | |
| 06:00 | GBP | RPI M/M Jun | 0.20% | 0.20% | 0.40% | |
| 06:00 | GBP | RPI Y/Y Jun | 2.90% | 2.90% | 3.00% | |
| 06:00 | GBP | PPI Input M/M Jun | -0.80% | 0.10% | 0.00% | -0.60% |
| 06:00 | GBP | PPI Input Y/Y Jun | -0.40% | -0.10% | -0.70% | |
| 06:00 | GBP | PPI Output M/M Jun | -0.30% | 0.10% | -0.10% | 0.00% |
| 06:00 | GBP | PPI Output Y/Y Jun | 1.40% | 1.70% | ||
| 06:00 | GBP | PPI Core Output M/M Jun | 0.10% | 0.20% | ||
| 06:00 | GBP | PPI Core Output Y/Y Jun | 1.10% | 1.00% | ||
| 09:00 | EUR | Eurozone CPI Y/Y Jun F | 2.50% | 2.50% | 2.50% | |
| 09:00 | EUR | Eurozone CPI Core Y/Y Jun F | 2.90% | 2.90% | 2.90% | |
| 12:30 | USD | Building Permits Jun | 1.45M | 1.40M | 1.40M | |
| 12:30 | USD | Housing Starts Jun | 1.35M | 1.30M | 1.28M | |
| 13:15 | USD | Industrial Production M/M Jun | 0.30% | 0.90% | ||
| 13:15 | USD | Capacity Utilization Jun | 78.60% | 78.70% | ||
| 14:30 | USD | Crude Oil Inventories | -0.9M | -3.4M | ||
| 18:00 | USD | Beige Book |
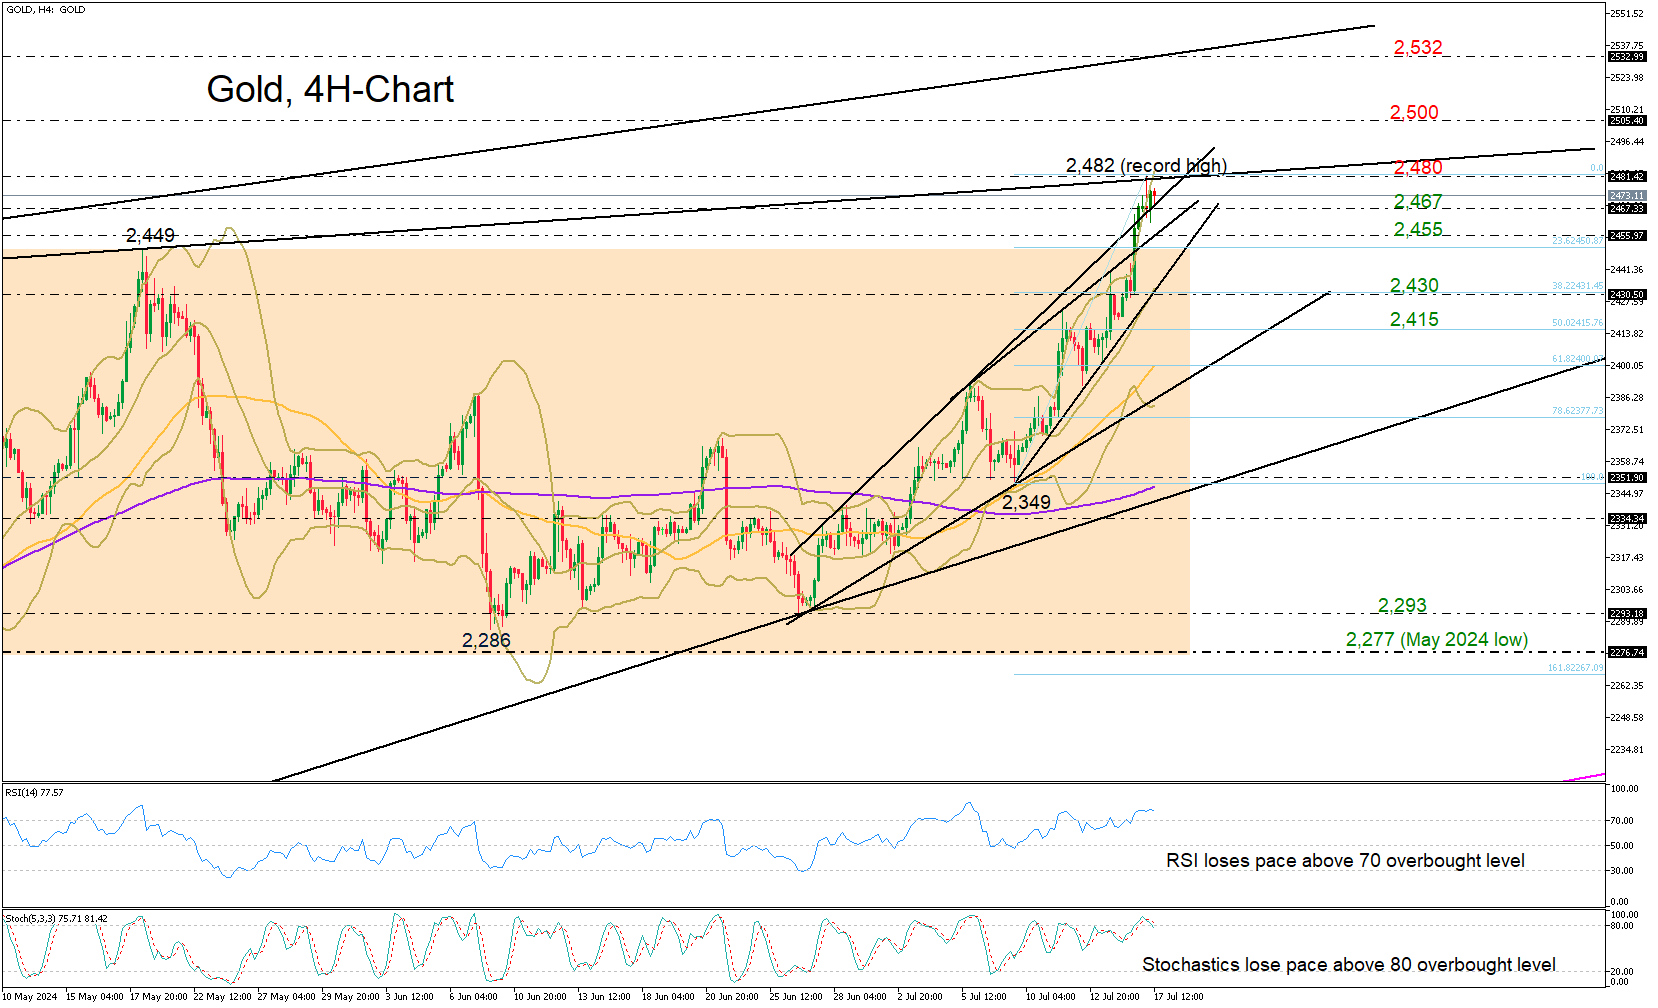
Gold Shines at Fresh All-Time High
- Gold ends sideways trajectory; enters uncharted territory
- Short-term bias positive but overbought signals suggest some caution
- A close above 2,480 might be necessary to boost buying confidence
Gold bulls powered ahead to finally exit the three-month range and chart an all-time high of 2,482 on Wednesday.
The bullish breakout has placed the precious metal back into an uptrend, which may continue to attract buyers in the upcoming sessions. However, caution is necessary as the price has already exceeded the upper Bollinger band, and both the RSI and stochastic oscillator are currently in the overbought zone on the four-hour chart.
Perhaps a close above the ascending line, which connects the April and May highs at 2,480, could be the key for an advance towards the 2,500 psychological level. Further up, the bulls could face another critical battle near the resistance line drawn from August 2022 around 2,532.
Should the price retreat beneath 2,467, initial support could emerge near 2,455. Failure to pivot there could upset traders, motivating a decline towards the 20-period SMA (middle Bollinger band) at 2,430 and back into the previous neutral zone. Note that the 38.2% Fibonacci retracement of the upleg started on July 9 is in the region. Hence, another violation there could activate more selling, likely towards the 50% Fibonacci of 2,415.
Overall, although gold’s positive outlook has returned, traders might wait for a breakthrough above 2,480 to reach the 2,500 milestone.