

Sample Category Title
Gold (XAU/USD) Hits Record High of $2465/oz Despite Positive US Retail Sales Data
- Gold prices reach a new record high of $2465/oz, driven by post-CPI and rate cut optimism.
- Despite a resurgent US Dollar, gold’s upward momentum remains strong, briefly dipping before rallying to new highs.
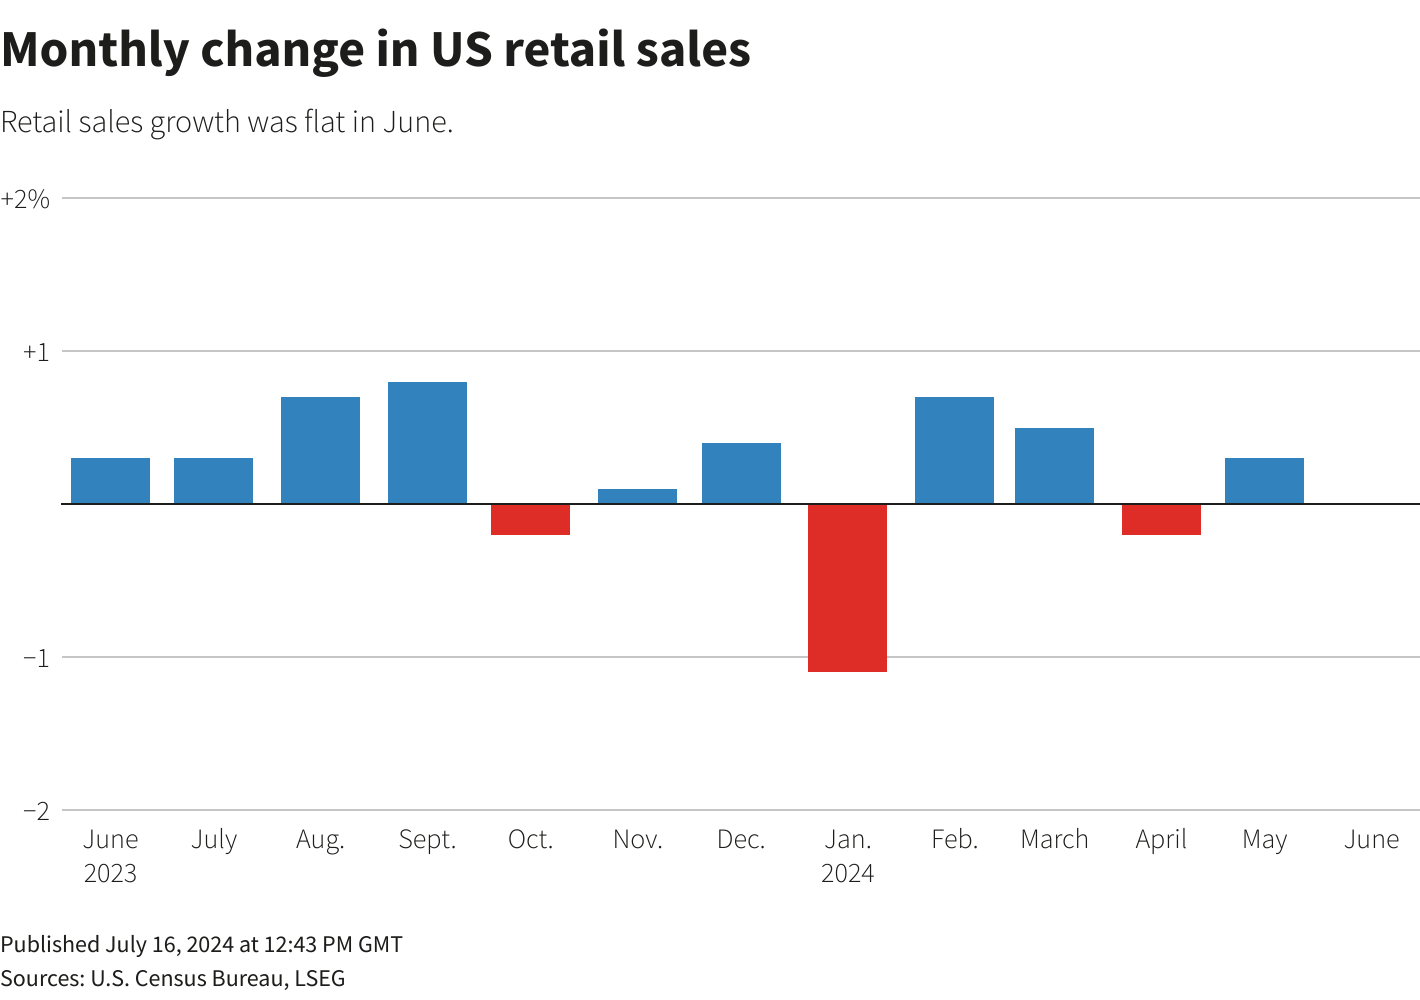
- June’s US retail sales figures and an upward revision of May’s data had minimal impact on gold’s rally and market expectations for Fed rate cuts.
Gold prices continue to ride the wave of post-CPI and rate cut optimism as the precious metal nears its previous all-time high around the $2450/oz mark.
This surge comes despite a resurgent US Dollar index, bolstered by recent events and positive US retail sales data. Initially, the strength in the US Dollar index seemed poised to cap gold prices, but this pressure failed to materialize. Gold briefly dipped to a low of $2429.45 before rallying to fresh daily highs at $2458.05.
June’s US retail sales numbers remained unchanged, but an upward revision of May’s figure to 0.3% temporarily paused gold’s rally. Nonetheless, the report did little to alter market expectations regarding Fed rate cuts, even as the US Dollar gained some strength.
Source: Refinitiv
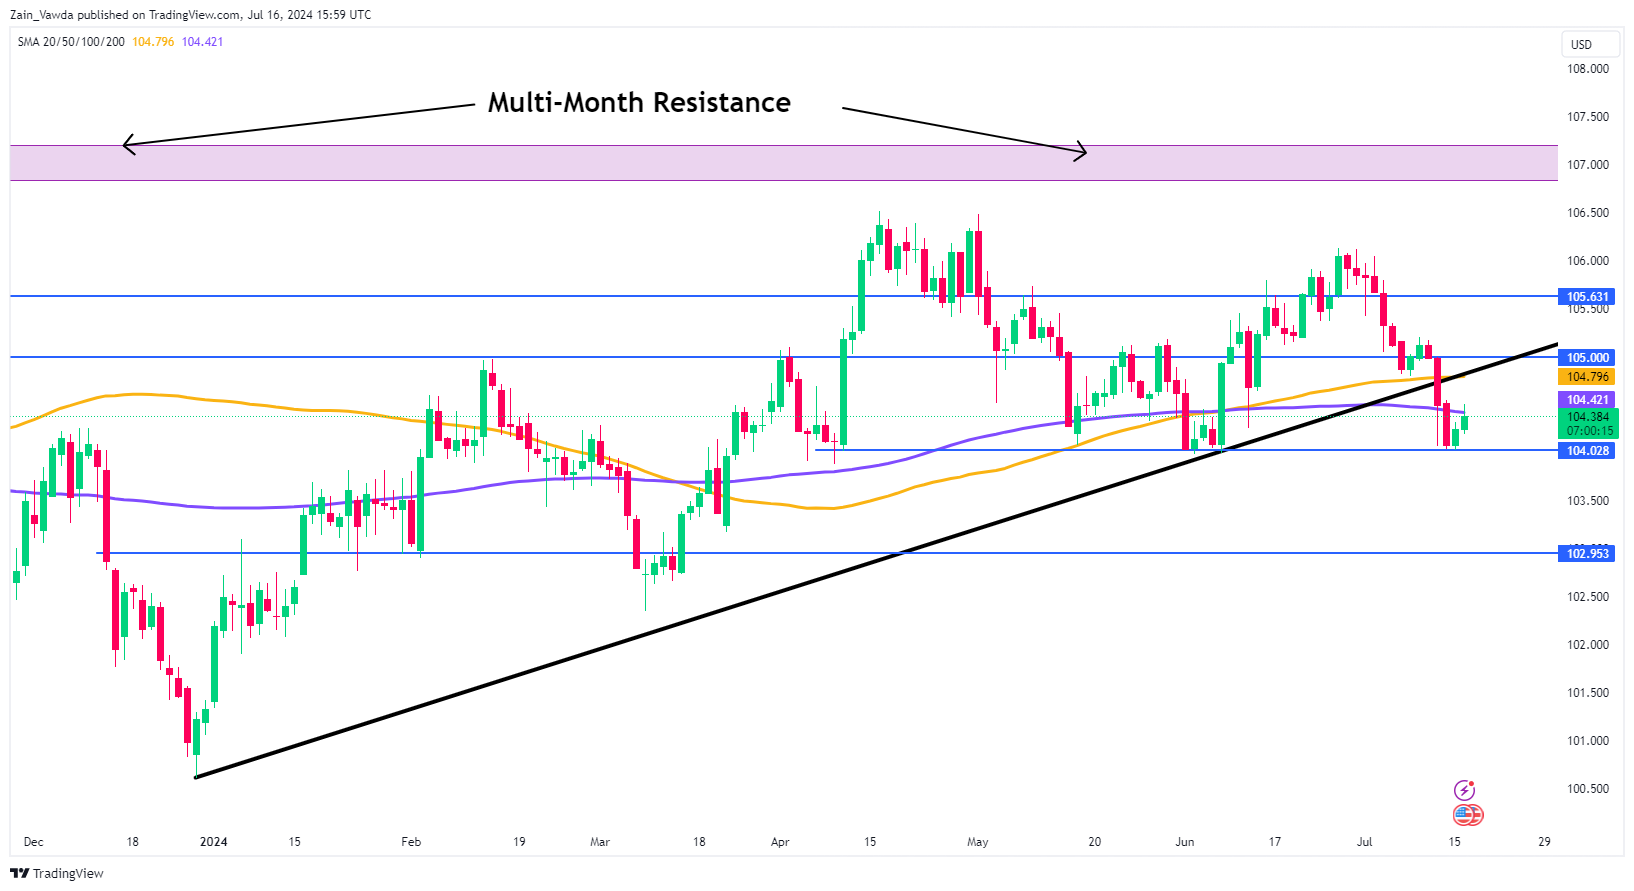
The overall probability of a September rate cut has seen a slight increase, rising from 91.9% to 93.3%. Meanwhile, the DXY has rebounded from support at the 104.00 level but is currently facing resistance at the 200-day moving average, which stands at 104.42.
US Dollar Index Chart, July 16, 2024
Source: TradingView (click to enlarge)
The Week Ahead: Fed Policymakers to Push Back on Rate Cut Bets?
The economic calendar for the upcoming week is light on high-impact US economic data. The main focus will be on Federal Reserve speakers, with several policymakers scheduled to address the public in the coming days.
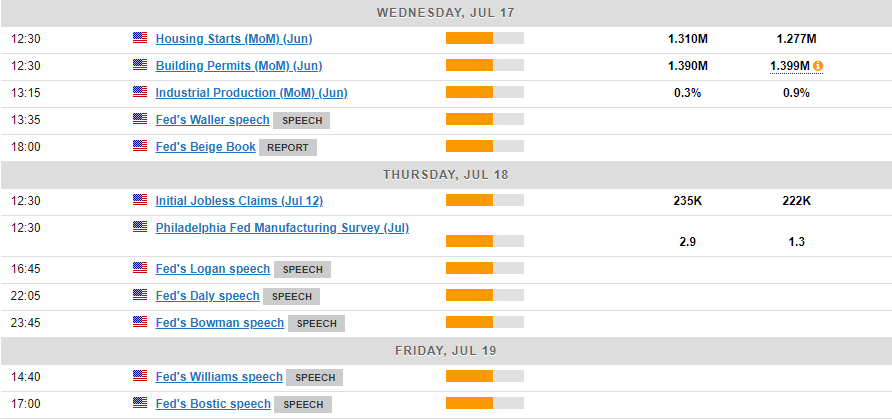
For the US Dollar to sustain its recovery following last week’s selloff, Fed policymakers will need to adopt a distinctly hawkish tone.
In contrast, gold appears to be on an unstoppable upward trajectory. With minimal price action to analyze, it is challenging to predict where this rally might encounter resistance.
Technical Analysis
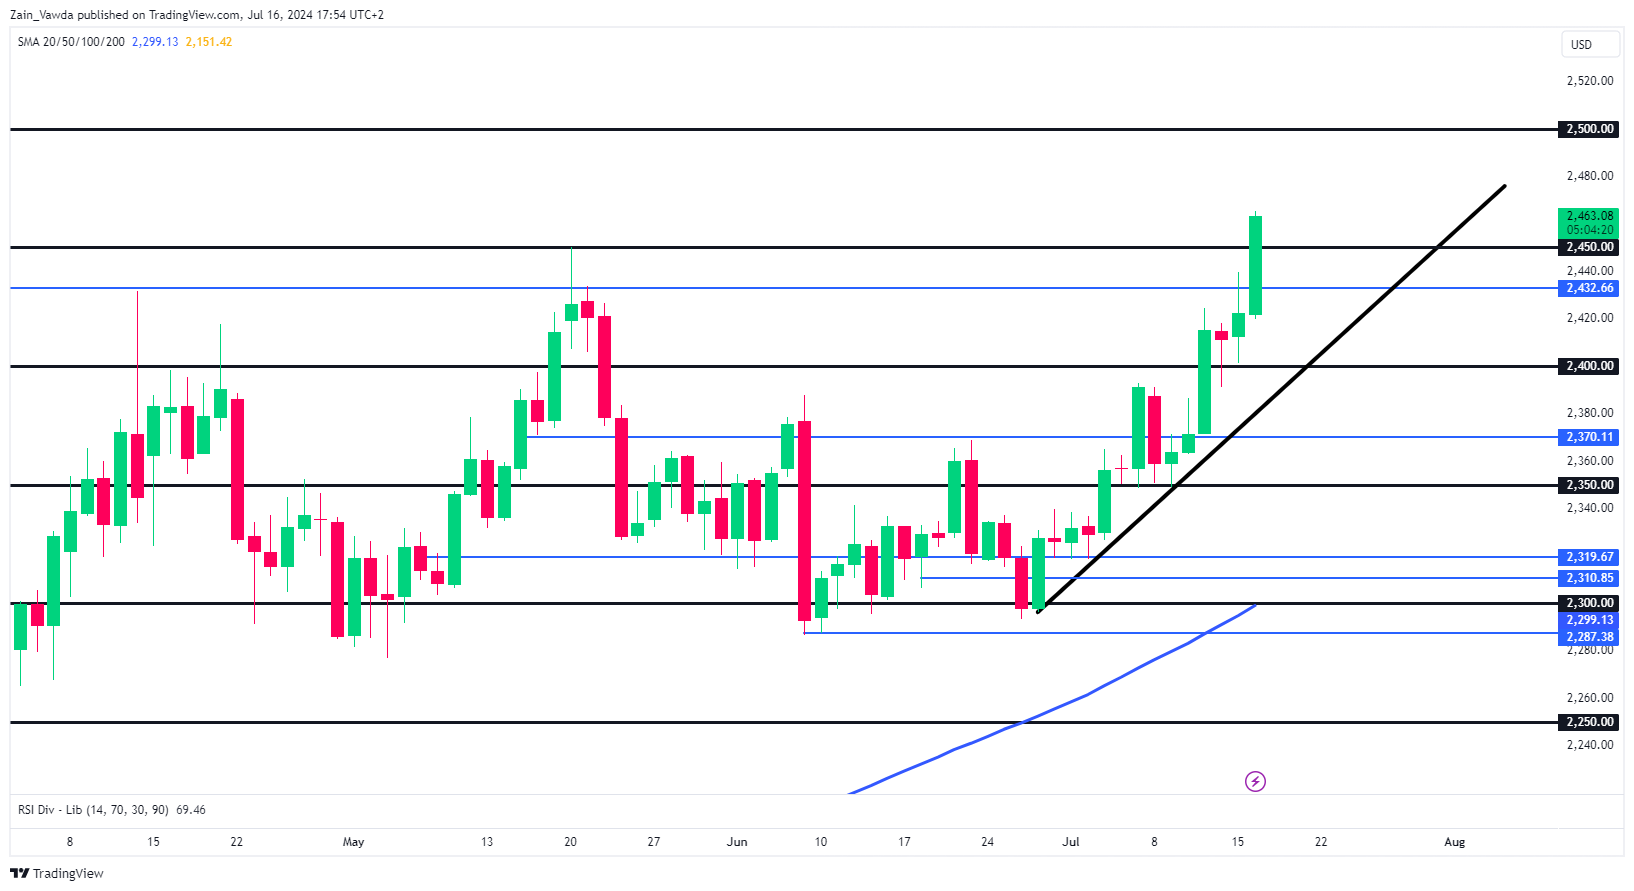
From a technical standpoint, Gold is now in uncharted territory. The break above previous all-time highs at $2450/oz makes that a key level of support.
If the $2450/oz continues to hold then further gains are the most likely outcome. Psychological and round numbers are always key for Gold so keep a watch on $2475 and of course the psychological $2500/oz handles.
Alternatively, a break below $2450 brings $2432 support into focus before the psychological $2400 maybe revisited once more.
Support
- 2450
- 2432
- 2400
Resistance
- 2475
- 2500
XAU/USD Daily Chart, July 16, 2024
Source: TradingView.com (click to enlarge)
EURJPY Wave Analysis
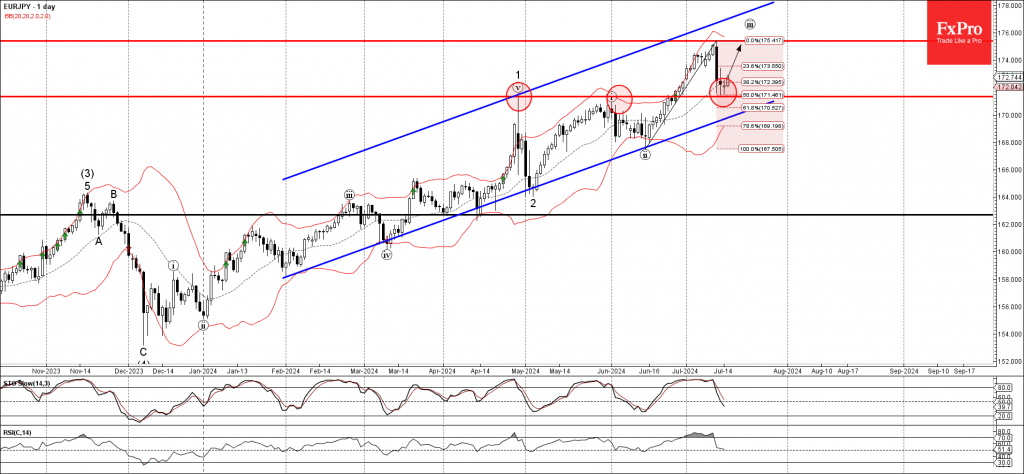
- EURJPY reversed from pivotal support level 171.35
- Likely to rise to resistance level 175.40
EURJPY currency pair recently reversed up from the pivotal support level 171.35, which has been reversing the price from the end of April.
The support level 171.35 was strengthened by the nearby 50 % Fibonacci correction of the previous sharp upward impulse from last month.
Given the strong daily uptrend, EURJPY currency pair can be expected to rise further to the next resistance level 175.40 (which reversed the price earlier this month).
WTI Crude Oil Wave Analysis
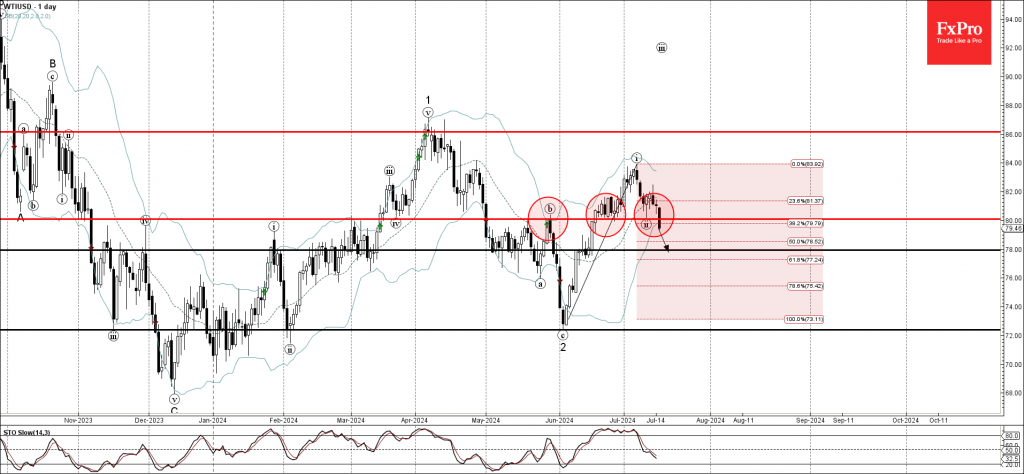
- WTI broke support level 80.00
- Likely to fall to support level 78.00
WTI crude oil just broke the round support level 80.00, former resistance from May, which has been reversing the price from June.
The breakout of the support level 80.00 coincided with the breakout of the 38.2% Fibonacci correction of the previous upward impulse wave i from the start of June.
WTI crude oil can be expected to fall further to the next support level 78.00 (former minor support from the middle of June).
Gold’s Astounding Rally and the Challenges Ahead
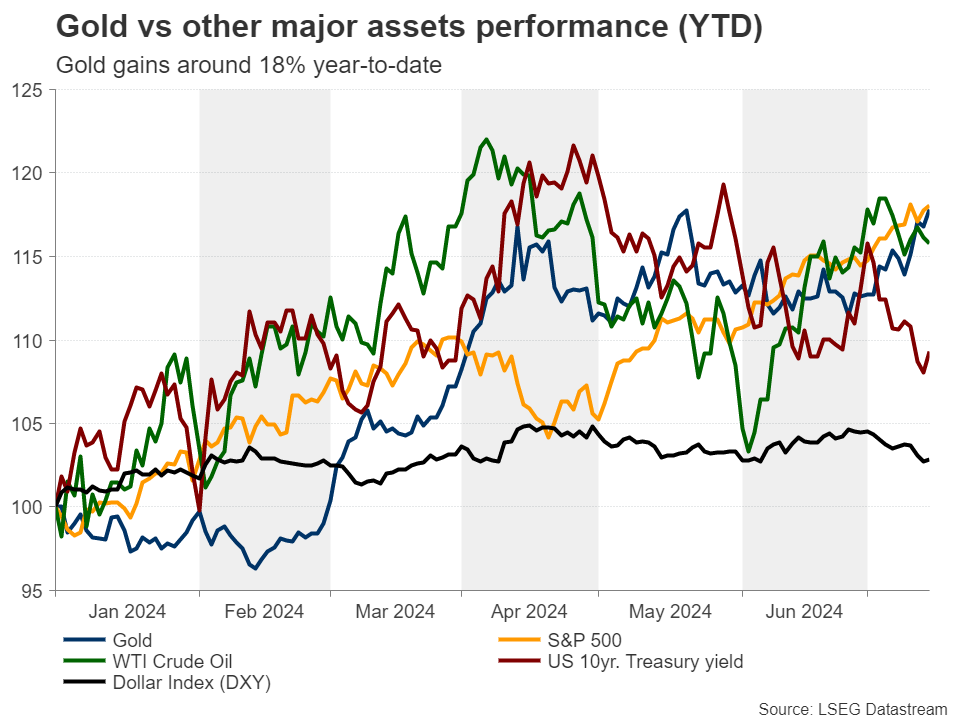
- Gold gains around 18% year-to-date
- But is it time for the uptrend to cool down a bit?
- Even if so, the broader outlook remains positive
Gold shines bright
Gold had a great year-to-date performance, gaining around 18% and hitting a record high of 2450 on May 20. As discussed in previous reports, gold’s uptrend was fueled by geopolitical uncertainty, continued central bank buying and strong consumer demand, especially in China, as well as expectations of lower borrowing costs, at least in most developed nations.
But will those forces remain intact? Will gold extend its prevailing uptrend without looking back, or has the momentum run out of steam?
Overly dovish Fed rate cut bets
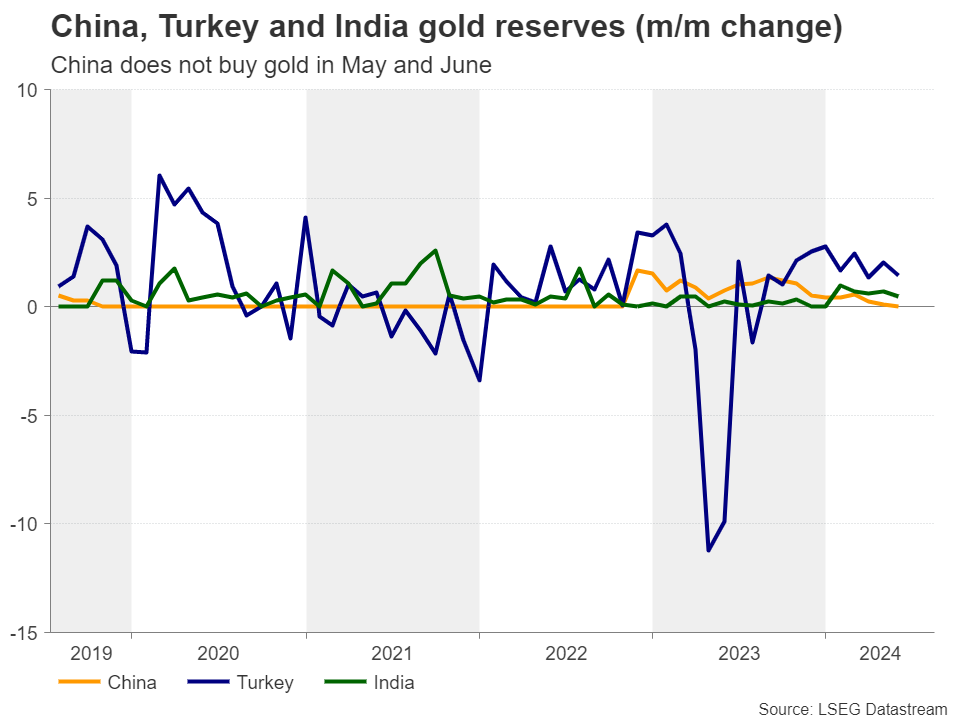
After hitting a fresh record high on May 20 at around 2450, the precious metal pulled back to settle within the sideways range between 2290 and 2390, which contained most of the price action since the beginning of April. Perhaps this was due to the People’s Bank of China not purchasing any gold in May and June.
That said, just last week, the metal found its footing again and emerged above the upper bound of that range as the US CPI data revealed that inflation continued to cool in June. Coming on top of the soft employment data for the month, the CPI numbers cemented expectations of a September quarter-point cut by the Fed, with market participants increasing the basis points expected to be cut by the end of the year to 68. This translates into an around 70% chance for a third 25bps reduction before the turn of the year.
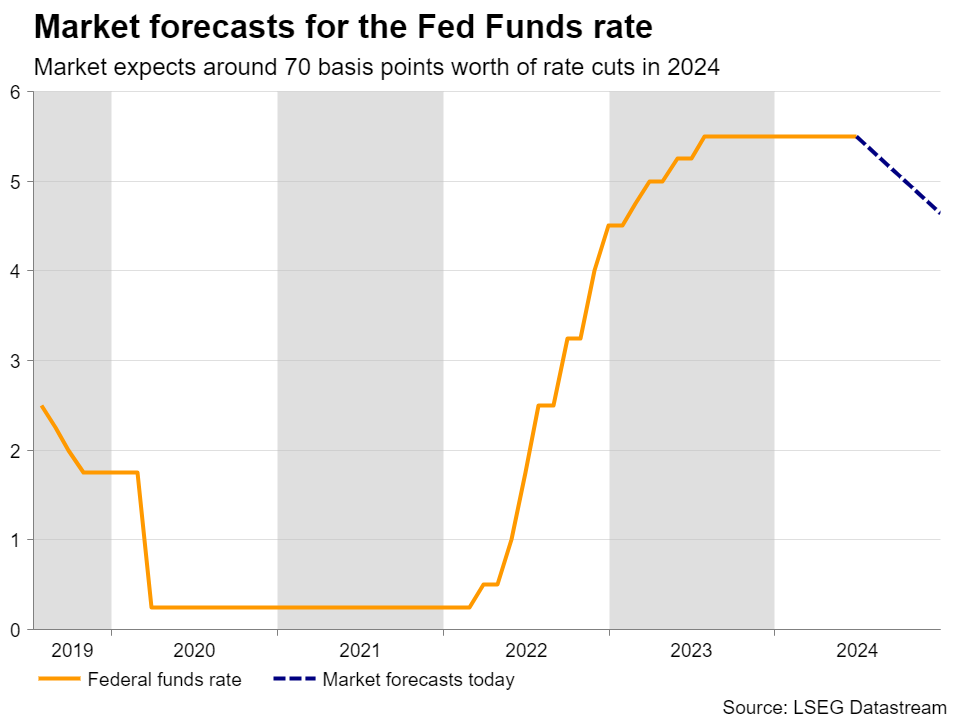
However, betting on a third rate cut this year may not be that realistic. After all, the Fed’s latest dot plot has pointed to just one, while Powell, although confident about the progress of inflation, stressed that they need more evidence before they consider starting to lower rates.
What’s more, following the assassination attempt on US Presidential candidate Trump, the chances of him returning to the oval office may have increased and a Trump presidency may not be rate-cut friendly as his pledges to lower corporate taxes and add tariffs on China could very well prove inflationary.
All in all, incoming data pointing to some stickiness in inflation or better-than-expected economic performance could allow the dollar to rebound, and thereby weigh on gold, as investors reconsider the chance of a third rate cut this year.
Slowing Chinese demand
Besides the pause in PBoC’s purchases and the upside risks in Fed rate cut expectations, what could also weigh on the precious metal’s momentum in the short term may be more progress in the Israel-Hamas ceasefire talks and the slowdown in retail demand in China.
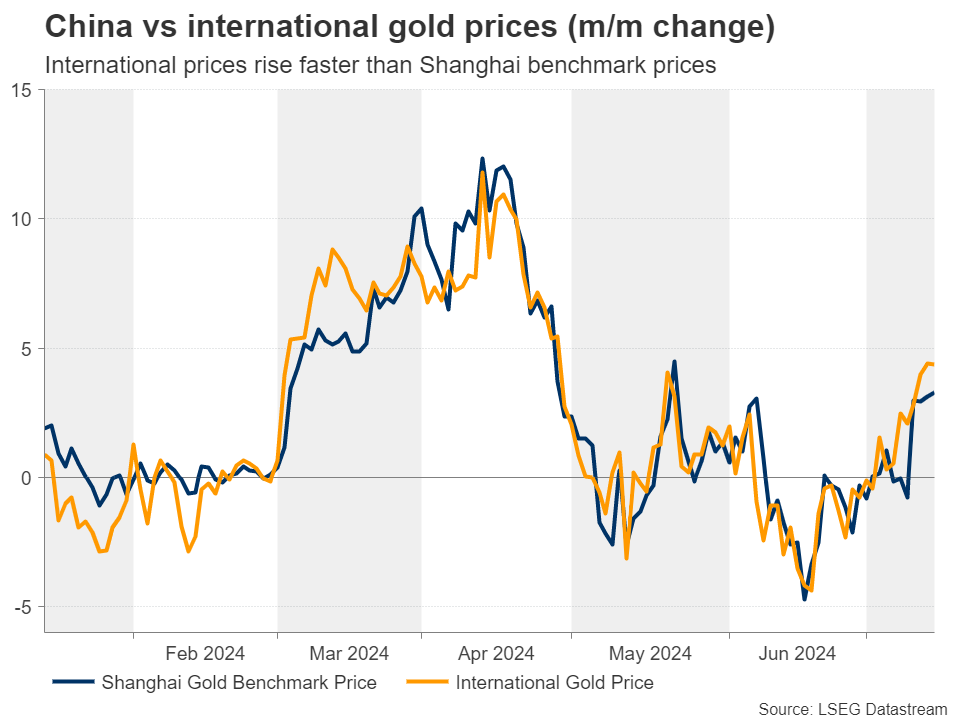
In the absence of any other investment vehicle to profit from, during the last couple of years, Chinese retailers rushed into gold, and this was evident by the acceleration in Chinese prices compared to international prices. However, lately, international prices have been rising faster than the Shanghai benchmark prices, implying a slowdown in Chinese demand.
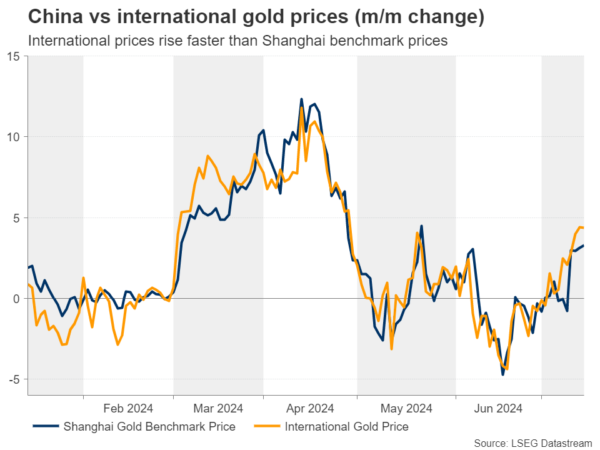 Any correction may be short-lived
Having said that though, any potential correction due to the aforementioned risks is likely to prove limited and short lived. As it was highlighted several times in previous reports, delayed rate cuts may not be much of a concern for gold investors as their horizons are likely longer than those of forex traders. The fact that the Fed is seen beginning an easing cycle soon may be more than enough as it keeps the upside potential in Treasury yields limited.
Moreover, the PBoC may reaccelerate its purchases over the next few months leading up to the US elections in November, as a Trump victory carries the risk of worsening US-China relations. Thus, Chinese policymakers may continue eliminating their dollar dependency to minimize the economic damage in case the US decides to weaponize its own currency.
As far as retail demand is concerned, with the Chinese stock market pulling back again lately and cryptos banned in the world’s second largest economy, many investors may soon decide to return to the precious metal.
A still-bullish technical picture
From a technical perspective, gold reclaimed its shine after the lower-than-expected US CPI data, breaking above the key resistance (now turned into support) barrier of $2,390.
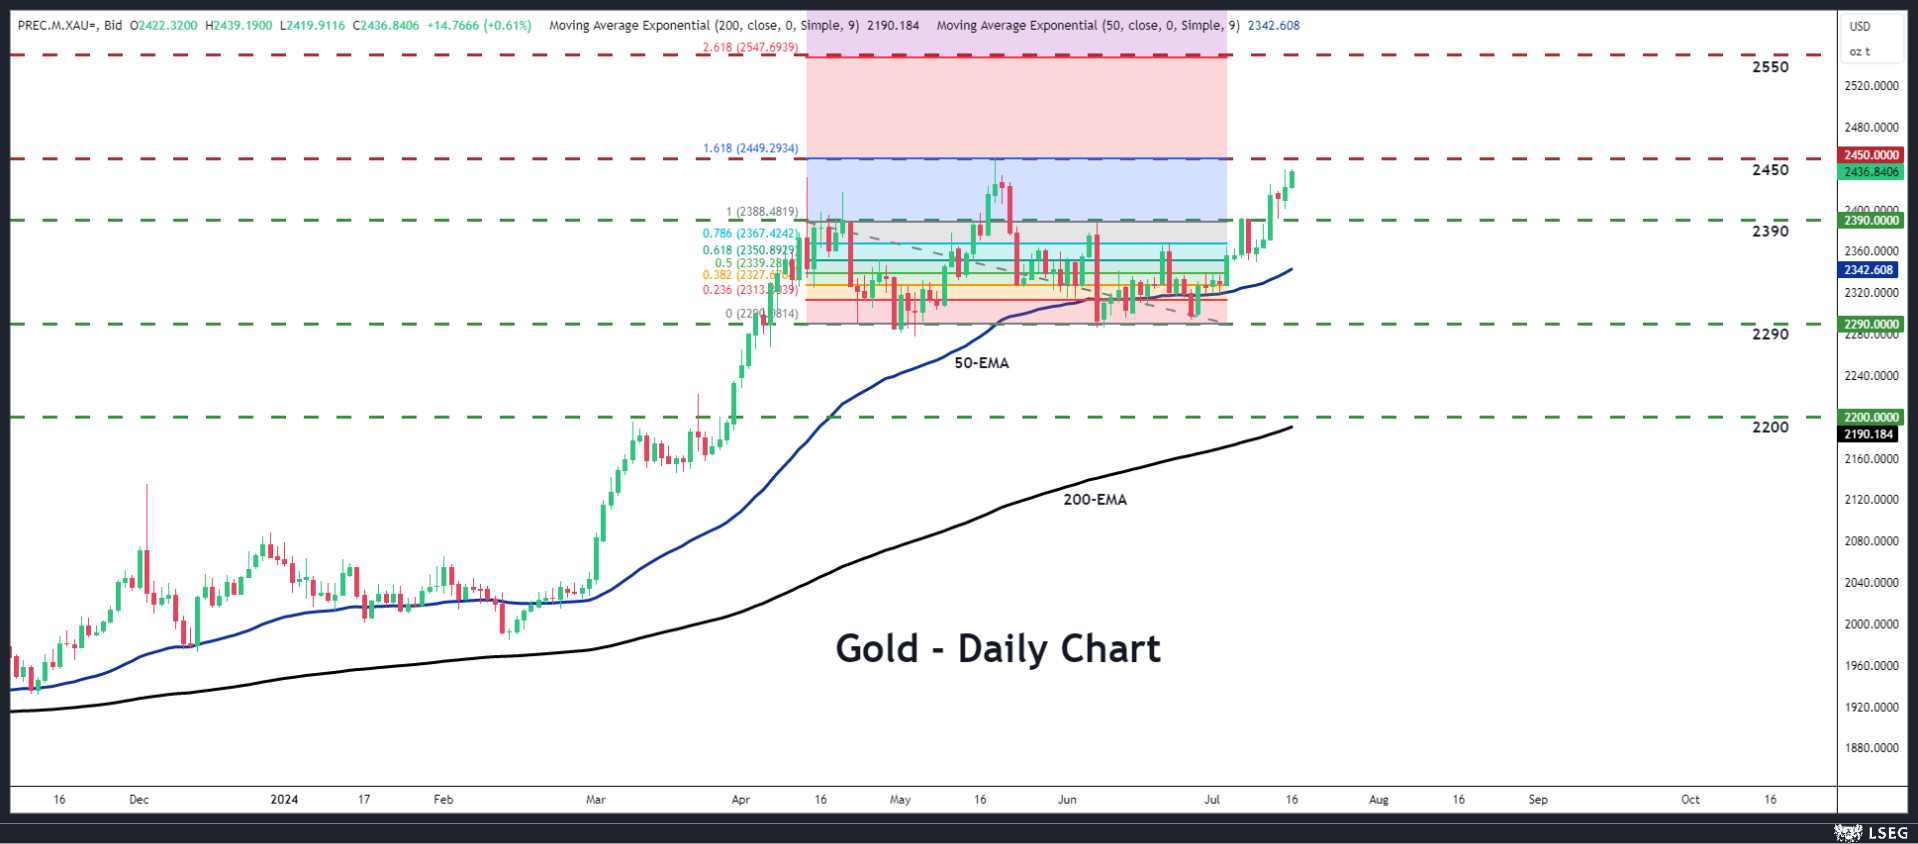
Now, the metal seems to be headed towards its all-time high of $2,450, but even if the bulls overtake that zone soon, a retreat could still be possible. After all this was the case during the last couple of times the metal hit records. Having said all that though, any retreat could stay limited above the key area of $2,390, from where the bulls may jump back into the action.
ECB Could Disappoint Expectations for a Dovish Shift
- ECB meets with near zero chances for a rate cut
- ECB members continue to disagree about the rates outlook
- A dovish shift looks unlikely as the focus rests with the Fed
- Euro showing unexpected strength despite political unrest
ECB meets but all eyes remain on the US
The ECB is preparing for the last meeting before the summer lull with developments elsewhere making President Lagarde’s job even more challenging. While the world is still digesting last week’s weaker US CPI report, the weekend’s attack on US presidential candidate Donald Trump and the collapse of the rumoured Israeli-Hamas truce, ECB members are scheduled to debate on the progress made since the June 6 gathering.
Euro area economy is suffering from political unrest
Since early June, the euro area economy appears to be losing momentum. The most recent set of PMI surveys along with the German IFO and ZEW surveys confirm this situation as the economy appears to have been burdened by the latest political developments in the two eurozone heavyweights, Germany and France. The former’s outlook is clouded by the budget shenanigans with the next federal election just 14 months away, while the latter continue the search for a new prime minister, with a caretaker government in place at the moment to ensure the smooth hosting of the Summer Olympics.
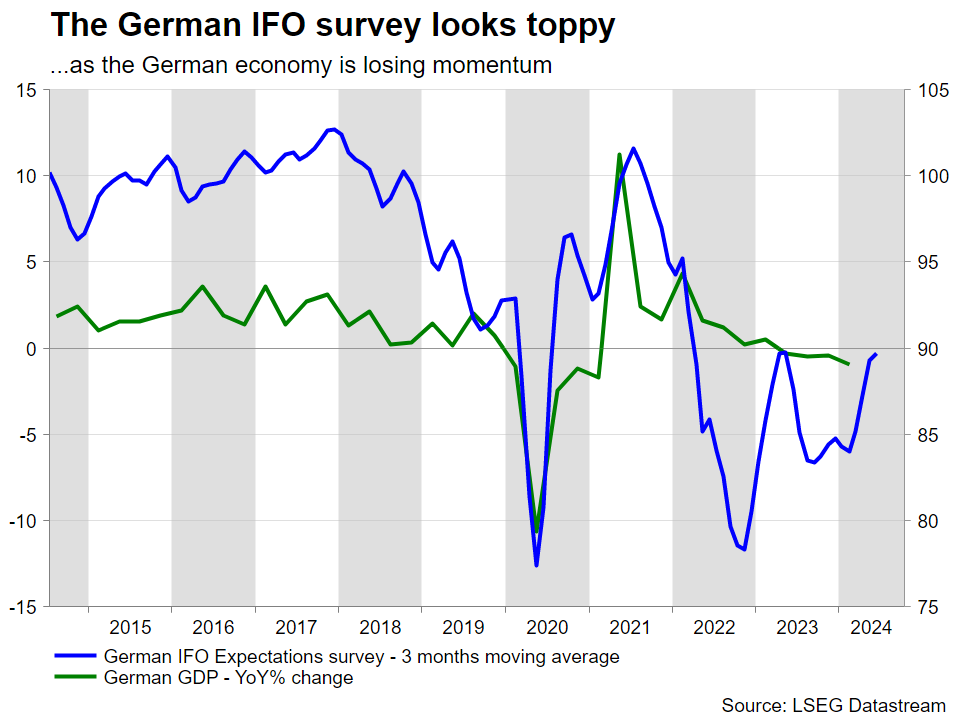
Economy is weaker but Lagarde’s main problem is the ECB hawks
Despite the continued stickiness in inflation, based on the recent data prints, a July rate cut would have been the baseline scenario for this meeting, if the ECB hadn’t rushed into cutting in June. However, President Lagarde was probably too eager to start easing the ECB’s monetary policy stance and she possibly mishandled the June rate decision. The hawks were forced to agree to a 25bps rate cut to save ECB’s face, but they continue to feel betrayed.
The minutes from the June gathering were quite telling about the behind-the-door discussions. As a result, the bar for another rate cut has increased substantially since then. ECB hawks are looking for stronger evidence that inflation will converge to the 2% target by 2025, especially as wage growth remains potent. Until their confidence about the inflation outlook increases considerably, they are unlikely to support any rate moves.
What does this mean for Thursday's meeting?
The market does not expect a surprise interest rate change on Thursday. It is probably too early for another rate cut, considering the volatile conditions both in the euro area and abroad, with the ECB doves possibly deciding to shift their focus to September. However, with the market pricing in an 80% probability for a September rate cut, could Thursday’s meeting lay the groundwork for such a move?
This looks somewhat unlikely at this stage. At the scheduled press conference, President Lagarde could emphasize the loss of economic momentum, but the stickiness in inflation, especially in the services sector, the strong wage growth and the external environment would probably stop her from making a dovish shift. For the sake of cohesion within the Governing Council, Lagarde might deem it necessary to strike a more balanced approach at the press conference.
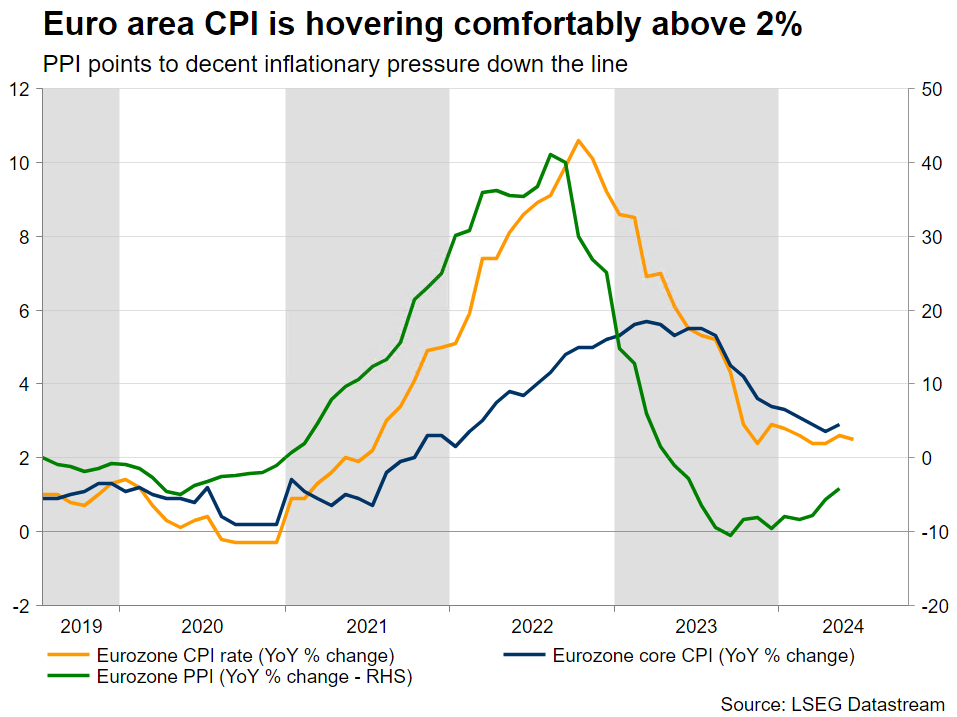
More importantly, ECB hawks have been quite clear that they will not tolerate any pre-commitment talk and that the ECB should be truly data dependent. This sounds sensible considering the next ECB meeting will come in two months, on September 12, and by then the Fed’s rate cut intentions would probably be much clearer.
Could the euro benefit from the lack of a dovish shift?
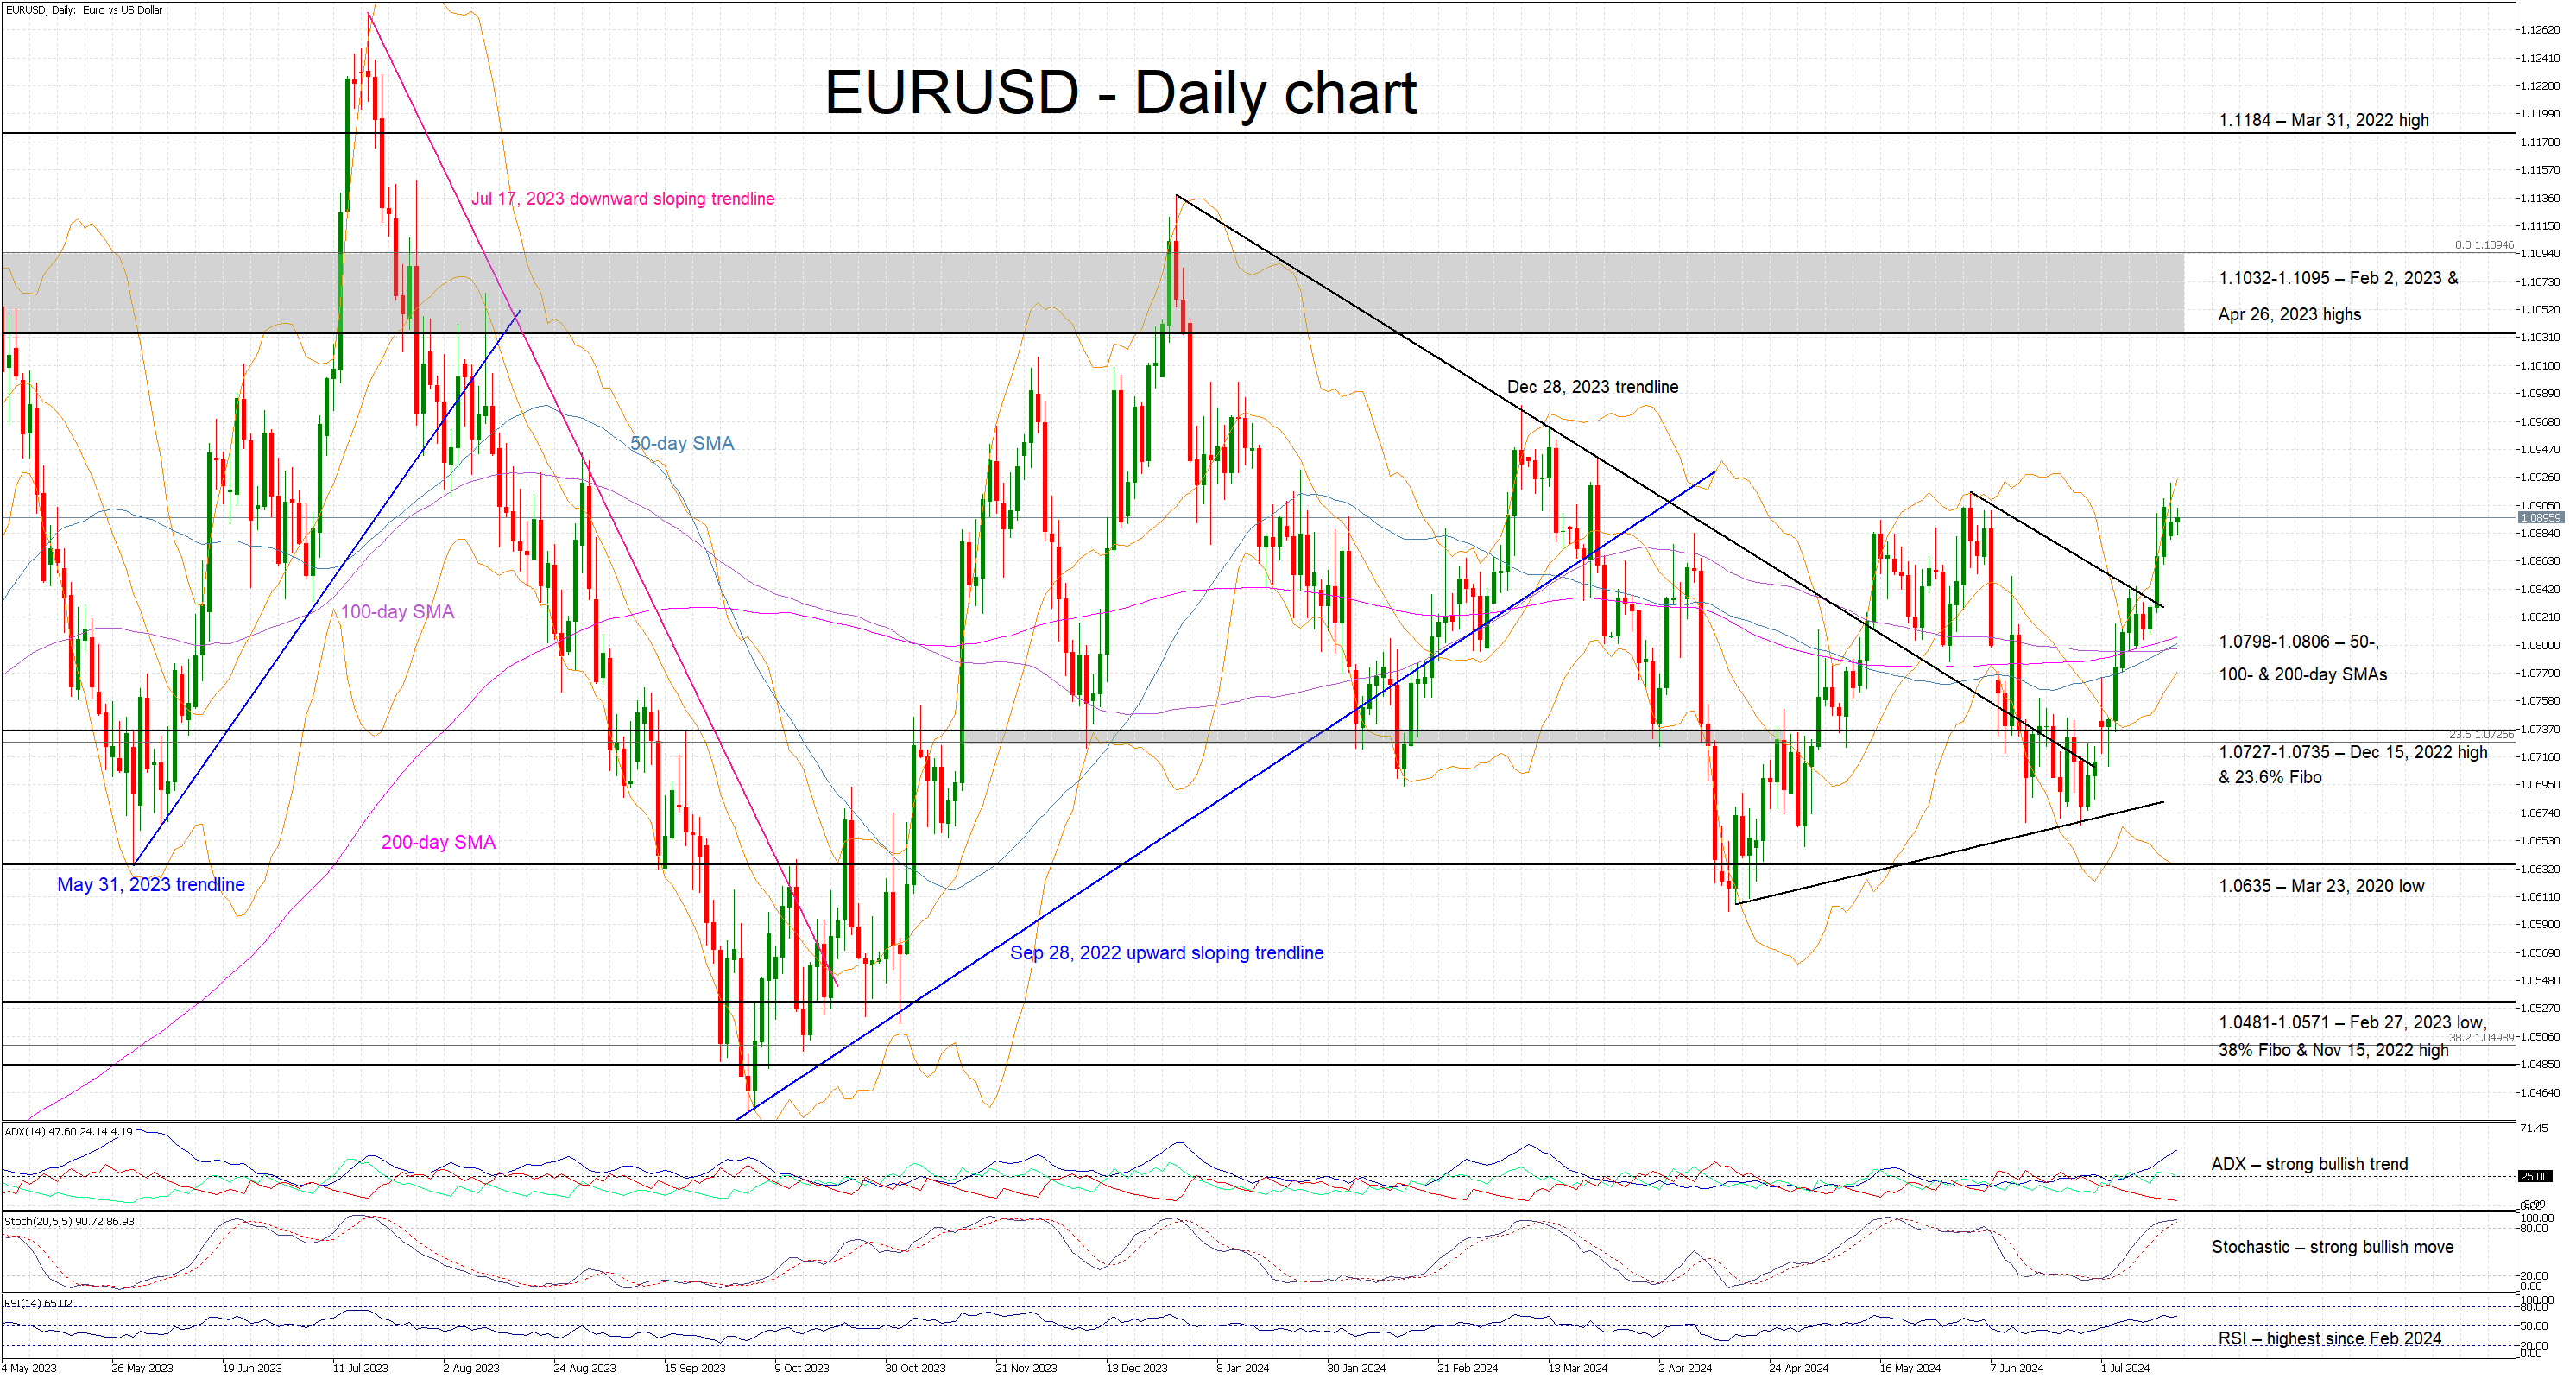
The euro has taken advantage of the widespread US dollar weakness, which has been suffering due to the increased chances for a September rate cut, erasing the recent correction and now testing the early June highs. Technically, the continued convergence of the simple moving averages points to higher volatility going forward, which could be triggered by Thursday’s ECB meeting.
Since the market is fixated on a September ECB rate cut, a dovish shift on Thursday could play into its hand and hence cause euro/dollar to surrender part of its recent gains. Interestingly, a hawkish show on Thursday could largely be ignored as the market will probably see this response as a strategic move from President Lagarde to please the hawks, and not a realistic shift to a more hawkish stance.
USD/CAD Steady After Canadian CPI, US Retail Sales
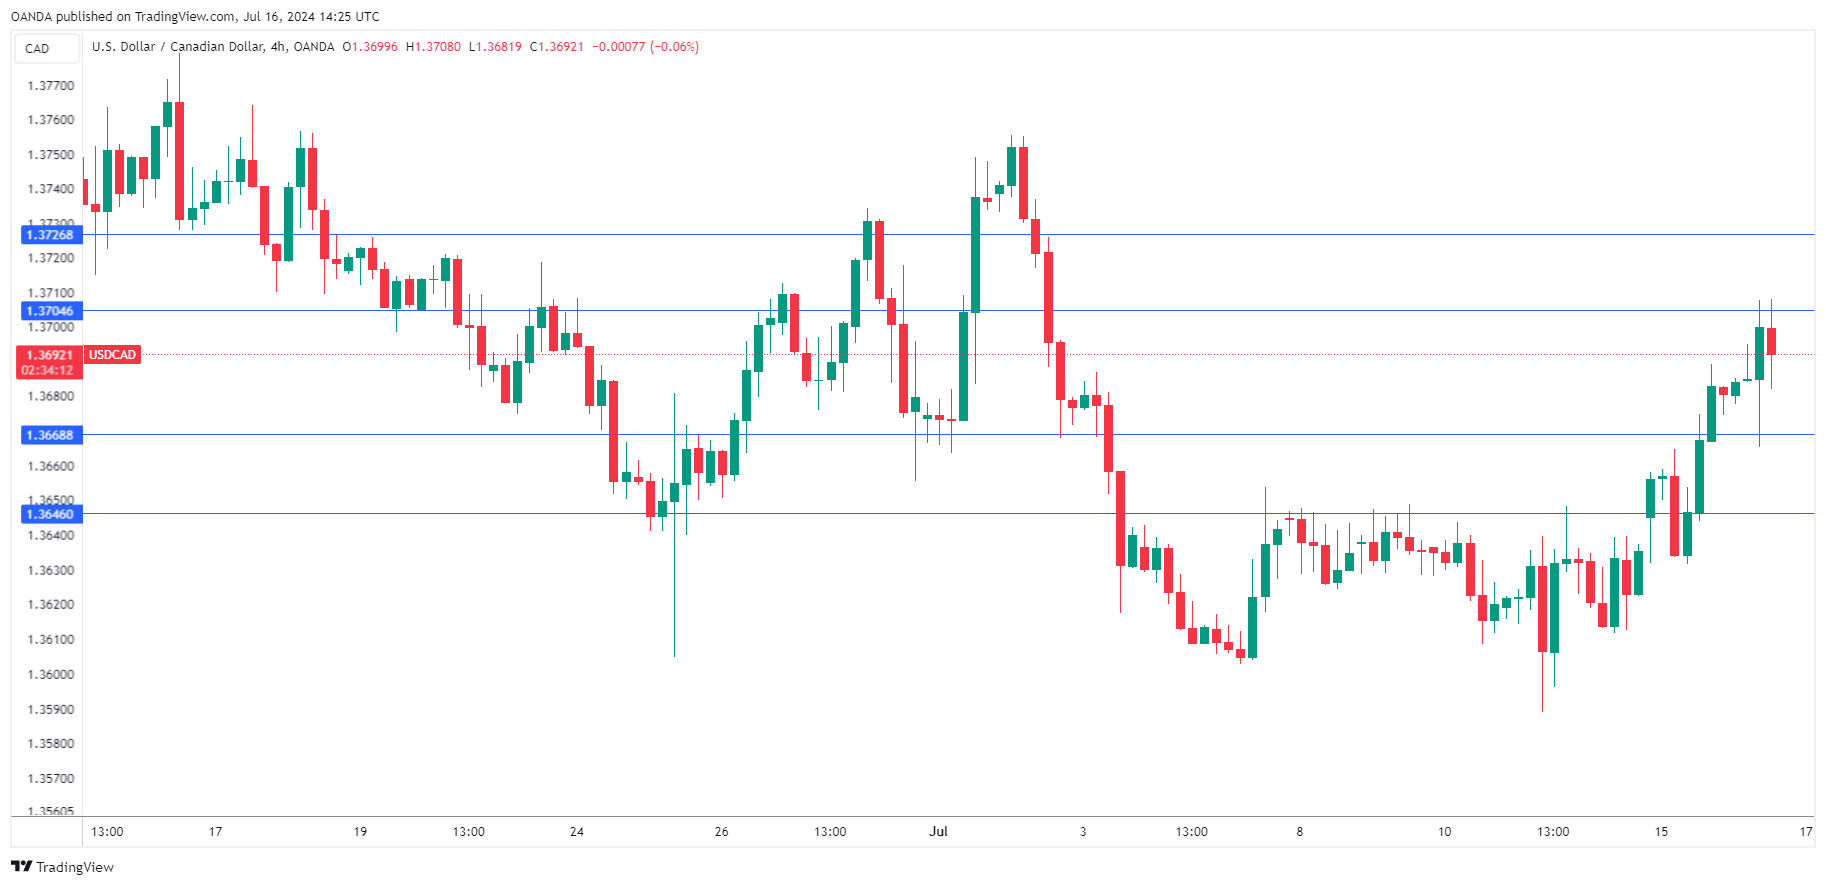
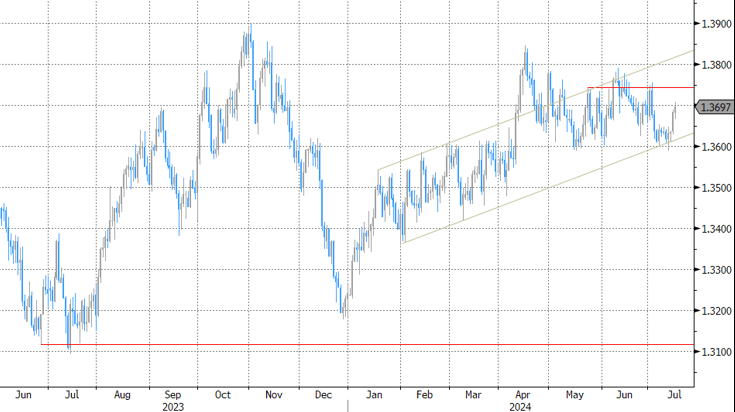
The Canadian dollar is showing limited movement on Tuesday. In the North American session, USD/CAD is trading at 1.3687, up 0.03% on the day at the time of writing.
Canada’s CPI lower than expected
Canada followed the US and posted a better-than-expected inflation report for June. The annual inflation rate fell to 2.7% in June, down from 2.9% in May and below the market estimate of 2.9%. This matched the three-year low in April. Gasoline prices fell sharply while food prices rose. Monthly, CPI declined in June by 0.1%, down from 0% in May and below the market estimate of 0.1%. This was the first decline since December 2023. Interestingly, the US also posted a 0.1% decline in the June CPI report.
Core inflation, which didn’t benefit from the sharp decrease in energy prices, ticked higher to 1.9% y/y, up from 1.8% in May and above the forecast of 1.6%. Monthly, core inflation declined by 0.1%, sharply lower than the 0.6% gain a month earlier and below the forecast of 0.4%.
The Bank of Canada will be pleased with the inflation report, as headline inflation declined and core inflation remains below the 2% target. The central bank meets on July 24 and the markets have raised the odds of a rate cut at that meeting to 88%, up from 82% before the inflation release. Canada releases retail sales on Friday, the last critical data prior to the rate decision.
US retail sales softer than expected
US retail sales dipped to 2.3% y/y in June, down from 2.6% in May but higher than the forecast of 2.1%. Monthly, retail sales were unchanged in June, down from a revised 0.3% in May and matching the market estimate. This was the second time in three months that retail sales were unchanged, pointing to weakness in consumer spending.
USD/CAD Technical
- USD/CAD tested resistance at 1.3704 earlier. Above, there is resistance at 1.3726
- There is support at 1.3668 and 1.3646
Sunset Market Commentary
Markets
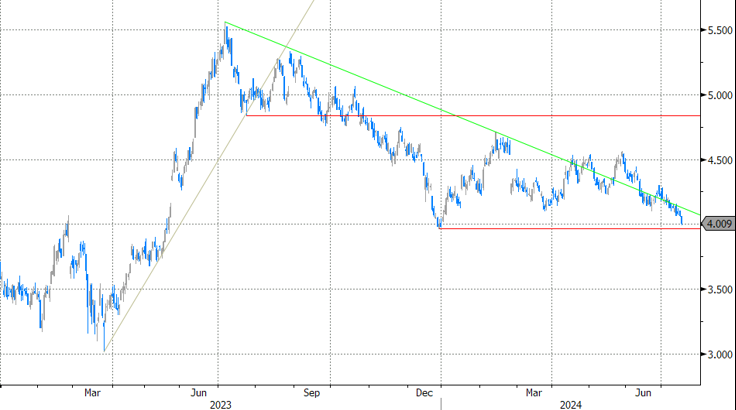
Global core bonds gained some ground going into today’s main dish, US retail sales. UK gilts slightly outperformed Bunds and Treasuries as markets gear for tomorrow’s June CPI numbers. A further easing on all accounts is expected but the sub 2% drop in the headline reading, if it were to materialize, will probably grab most of the headlines as paving the way for a first Bank of England cut in August. Money markets give it a 50% probability currently and have a total of 50 bps cut priced in for all of 2024. Front end yields slipped the most (up to 7 bps) with the UK 2-yr yield testing the 4% reference for the first time this year. German and US yields eased between 5 and 6.5 bps across the curve with the latter undoing part of yesterday’s “Trump steepening”. Focus in Europe went to the ECB’s quarterly lending survey (down below). Currency markets barely budged.
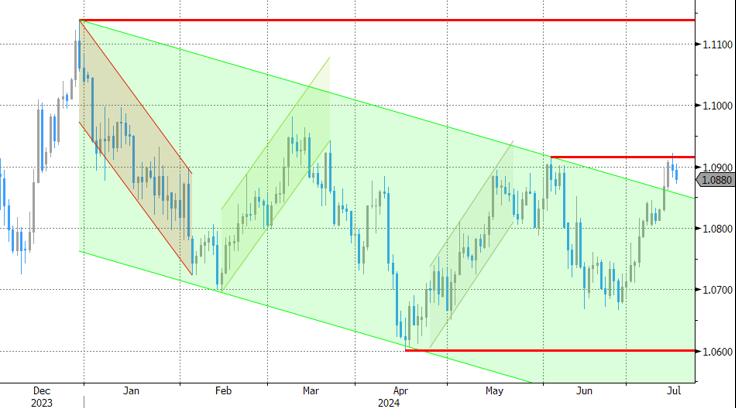
Enter retail sales. June turnover after an upwardly revised May came on the much stronger side of expectations with the headline number being flat compared to the estimated 0.3% m/m decline. Core gauges ranged from +0.4% for the series excluding autos (vs +0.1% expected) to +0.9% for the control group (ex. food, gas, building materials and car dealers, +0.2% expected). The latter is used in the calculation of private consumption for GDP. Sales rose in most categories but two components acted as a strong drag. Motor vehicles & parts tanked 2% m/m while gasoline stations’ sales dropped no less than 3%. Today’s data snaps a streak of below-consensus outcomes that included US ISM’s, payrolls and CPI. But even as the front of the US curve erased all previous gains, money market expectations for the Fed changed little. Yields at longer maturities pared losses to 4 bps. The dollar in printing its biggest intraday move strengthened against the euro to EUR/USD 1.0874. USD/JPY edged towards 158.73 and cable (GBP/USD) eased further from the highest level in a year around 1.30.
In news after the US retail sales, the IMF in an update to its World Economic Outlook raised 2024 growth forecasts for China (5%), India (7%) and marginally for the euro area (0.9%) while slightly adjusting the US (2.6%) downwards. Projections for most major economies in 2025 were left unchanged with China (+0.4 ppt to 4.5%) being a noticeable exception. The IMF also issued a warning on inflation. It said that stubborn wage-driven service prices are hampering the disinflation process, creating upside risks and the prospect of “higher-for-even-longer interest rates”. New forecasts show global inflation is unlikely to return to 2% until the end of next year.
News & Views
The ECB quarterly bank lending survey (BLS) showed a very small further tightening of credit standards for loans or credit lines to corporates in Q2 (net percentage of banks of 3%). Banks’ risk tolerance was the main driver. They expect a further moderate tightening in Q3 2024 (5%). Firms’ net demand for loans declined further (-7%), although by substantially less than in Q1 (-28%). Banks expect a first net increase in demand for loans since Q3 2022 in the next quarter. Credit standards for loans to households for house purchases showed a moderate further net easing (-6%; mainly because of competition) while those for consumer credit pointed to a moderate further net tightening (+6%; driven by risk perceptions). Banks expect credit standards to remain broadly unchanged in both loan categories in Q3 2024. Net demand for both housing loans and consumer credit increased for the first time since 2022 (respectively +16%, improving housing market prospects & +13%, spending on durables and consumer confidence). A further improvement is expected for Q3, especially for housing loans.
Canadian headline inflation fell by 0.1% on a monthly basis in June, coming off a 0.6% M/M increase in May and beating +0.1% M/M consensus. Main downward contributors were travel tours, gasoline, clothing and passenger vehicle prices. Core inflation (ex food and energy) was flat on the month. CPI rose 2.7% Y/Y, down from 2.9% in May, matching the slowest pace since March 2021, largely the result of a slower rise in gasoline prices. Lower prices for durable goods (-1.8% Y/Y) also contributed. The Bank of Canada’s preferred core gauges (median & trimmed mean) respectively slowed from 2.7% Y/Y to 2.6% and stabilized at 2.9% Y/Y. Canadian sovereign bond yields follow today’s global move down with the belly of the curve outperforming (-5 bps). The Loonie loses out against a stronger dollar with USD/CAD reclaiming 1.37. Today’s inflation print and yesterday’s BoC business outlook suggest that the Bank of Canada could cut its policy rate a second time at next week’s policy meeting.
Graphs
USD/CAD tests 1.37 big figure after CPI miss paves the way for a second BoC rate cut next week
UK 2-yr yield flirts with 4% barrier for the first time this year going into tomorrow’s (<2%?!) CPI release
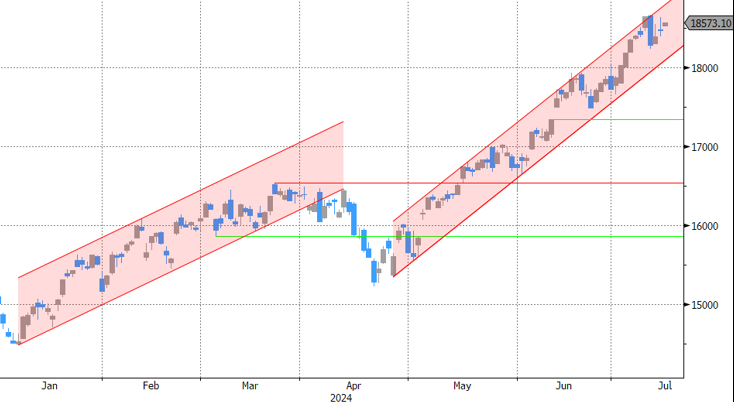
Nasdaq nicely developing within the upward trend. Last week Thursday’s slip-up all but erased
EUR/USD: failed test of 1.09 yesterday meets with follow-through return action in wake of consensus-topping retail sales
Kiwi Coming into Strong Support Ahead of Inflation Data
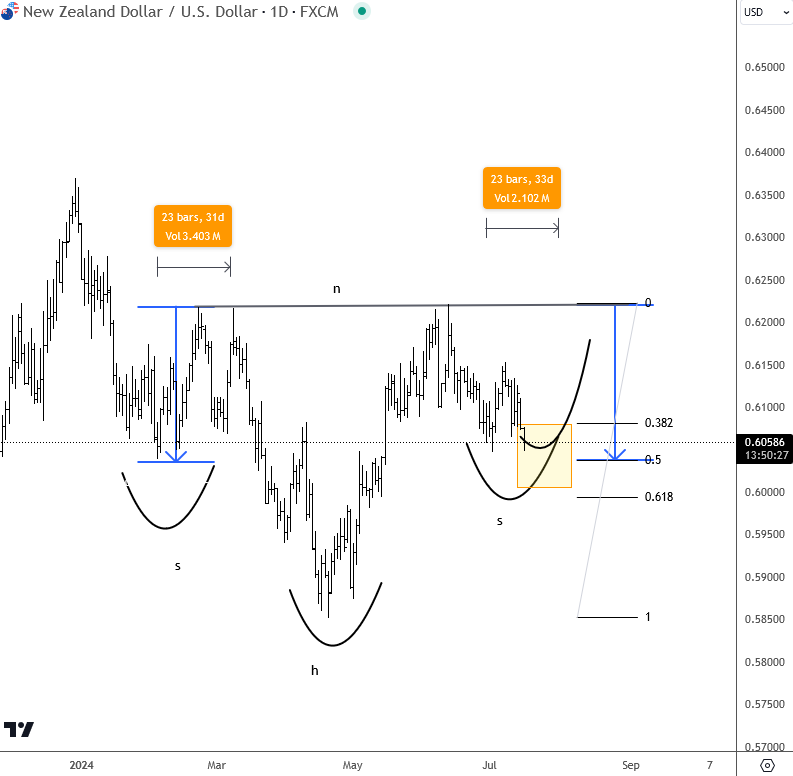
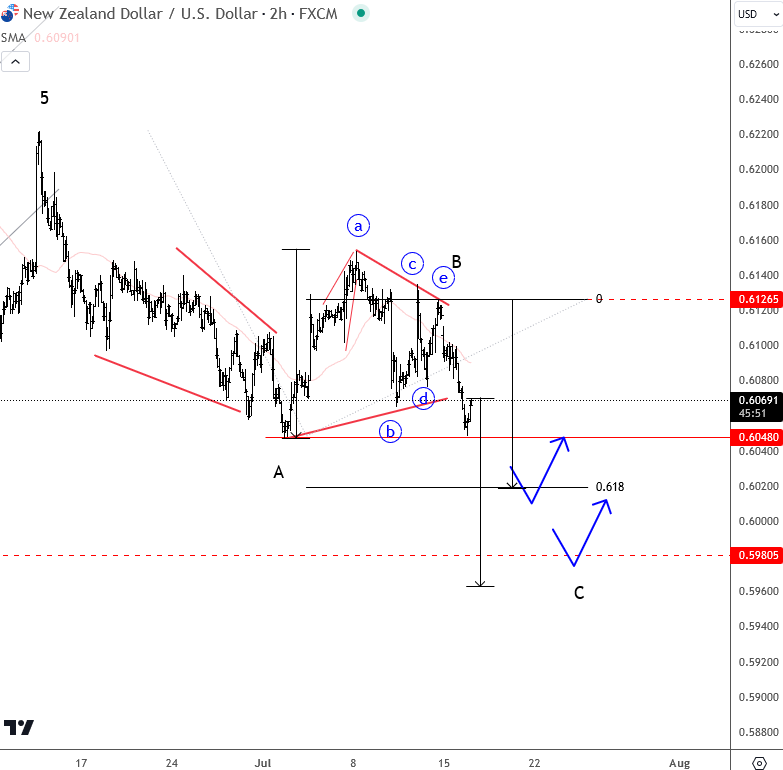
NZDUSD is coming out of consolidation, suggesting that the price action since the start of July was a triangle in wave B. Therefore, the whole retracement from June 12th is much more complex and deeper but still has a corrective shape. It looks like we are just breaking down into wave C, which has key support levels at 0.6020, with the second at 0.5980 area, which can be a very important swing zone going into the inflation report from New Zealand later today. Not only Elliott Wave structure, but also H&S pattern shows potential bullish formation, if we see support soon for right shoulder.
Canadian Inflation Eases, But Details a Mixed Bag
Headline CPI inflation decelerated in June to 2.7% year-on-year (y/y), right on consensus expectations and below last month's 2.9% y/y print.
The deceleration was led by gasoline prices, which dropped 3.1% month-on-month (m/m), compared to the +5.6% m/m gain last month. This follows OPEC+'s announcement of the phase out of prior production cuts.
Lower prices for durable goods (-1.8% y/y) also lent a hand, driven by price declines for passenger vehicles (-0.4% y/y). The Statcan note called out the "reduction in prices for used vehicles (-4.5%) amid improved inventory levels compared with a year ago."
However, services inflation edged higher to 4.8% y/y (from 4.6% y/y in May). This was driven by still high shelter inflation (+6.2% y/y), which has been led by an 8.8% y/y increase in rent and a 22.3% y/y increase in mortgage interest costs.
The average of the Bank of Canada's preferred "core" inflation measures held steady at 2.8% y/y in June. On a three-month annualized basis, the average moved to 2.9% in June from 2.5% in May.
Key Implications
Today's CPI report was a bit of a mixed bag. While headline inflation got back on track in June, the three-month annualized pace of core inflation has now been rising for three straight months. This infers that the annual pace of inflation should remain in the upper end of the BoC's 1% to 3% range over the coming months. This has been propelled, not just by shelter prices, but also by price gains in "nice-to-haves" like the cost of dining out, health spending, and household operations.
The BoC is set to make a rate announcement next week and today's report has increased odds of back-to-back rate cuts. Recent data have supported a cut, with the job market loosening and wage gains decelerating from elevated levels. From our view, the story hasn't changed. The BoC is in a cutting cycle. Whether or not it follows through with a slightly quicker pace of cuts next week, Canadians should expect rates to be steadily reduced over the rest of this year and next.