

Sample Category Title
EUR/AUD Daily Outlook
Daily Pivots: (S1) 1.6129; (P) 1.6164; (R1) 1.6219; More...
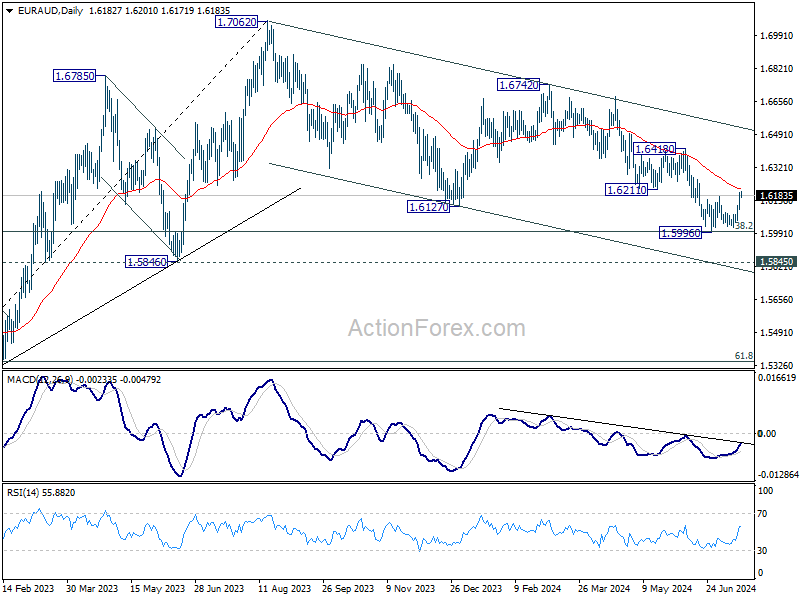
EUR/AUD is staying below 1.6211 support turned resistance despite current strong rebound. Intraday bias remains neutral and further decline is still in favor. On the downside, break of 1.5996 will resume larger fall to 1.5846 support next. However, firm break of 1.6211 will argue that larger corrective fall might have completed, and turn bias back to the upside for 1.6418 resistance next.
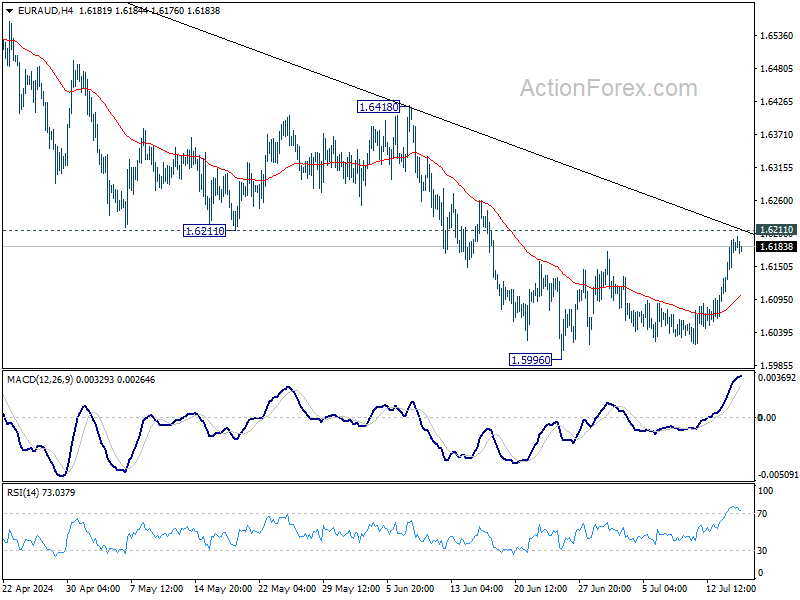
In the bigger picture, fall from 1.7062 medium term top is seen as a correction to the up trend from 1.4281 (2022 low) only. Strong support is still expected between 1.5846 and 38.2% retracement of 1.4281 to 1.7062 at 1.6000 to bring rebound. Break of 1.6418 resistance will argue that the correction has completed.
EUR/CHF Daily Outlook
Daily Pivots: (S1) 0.9732; (P) 0.9751; (R1) 0.9760; More....
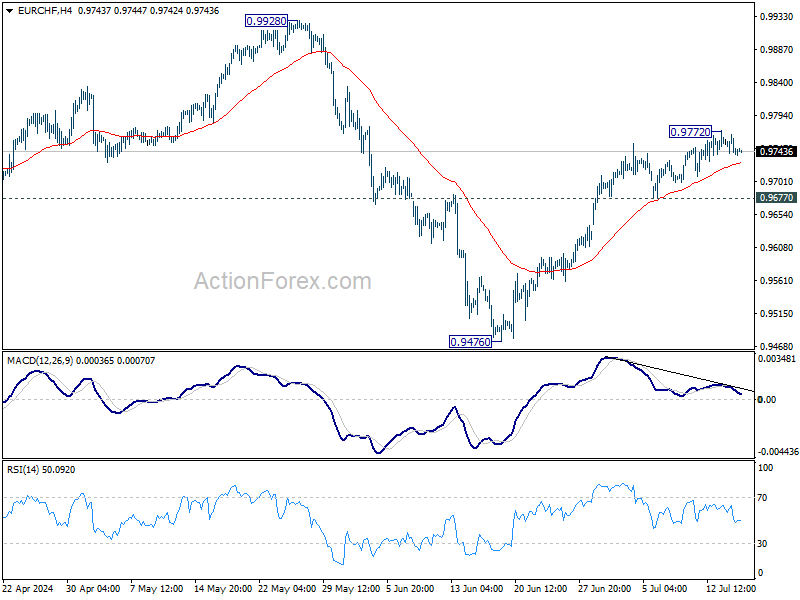
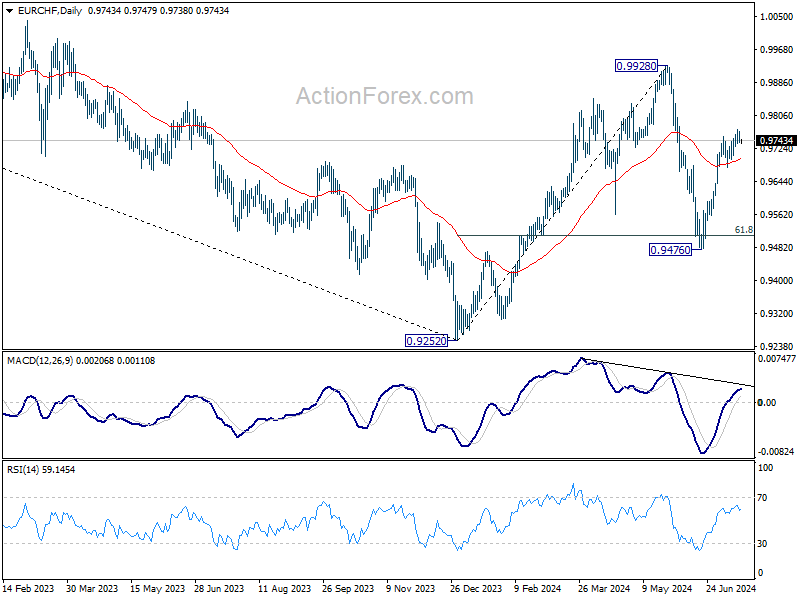
Intraday bias in EUR/CHF is turned neutral first as it's losing upside momentum as seen in 4H MACD. Further rise would remain in favor as long as 0.9677 support holds. Above 0.9772 temporary top will resume the rally from 0.9476 to retest 0.9928 high. However, break of 0.9677 will turn bias to the downside for deeper pullback.
In the bigger picture, rebound from 0.9252 medium term bottom might not be completed yet. But even in case of resumption, strong resistance could emerge from 1.0095 to limit upside. Medium term outlook will be neutral at best as long as 1.0094 structural resistance holds. Meanwhile, break of 0.9476 will bring retest of 0.9252 low.
Platinum (PL) Looking to Extend Higher
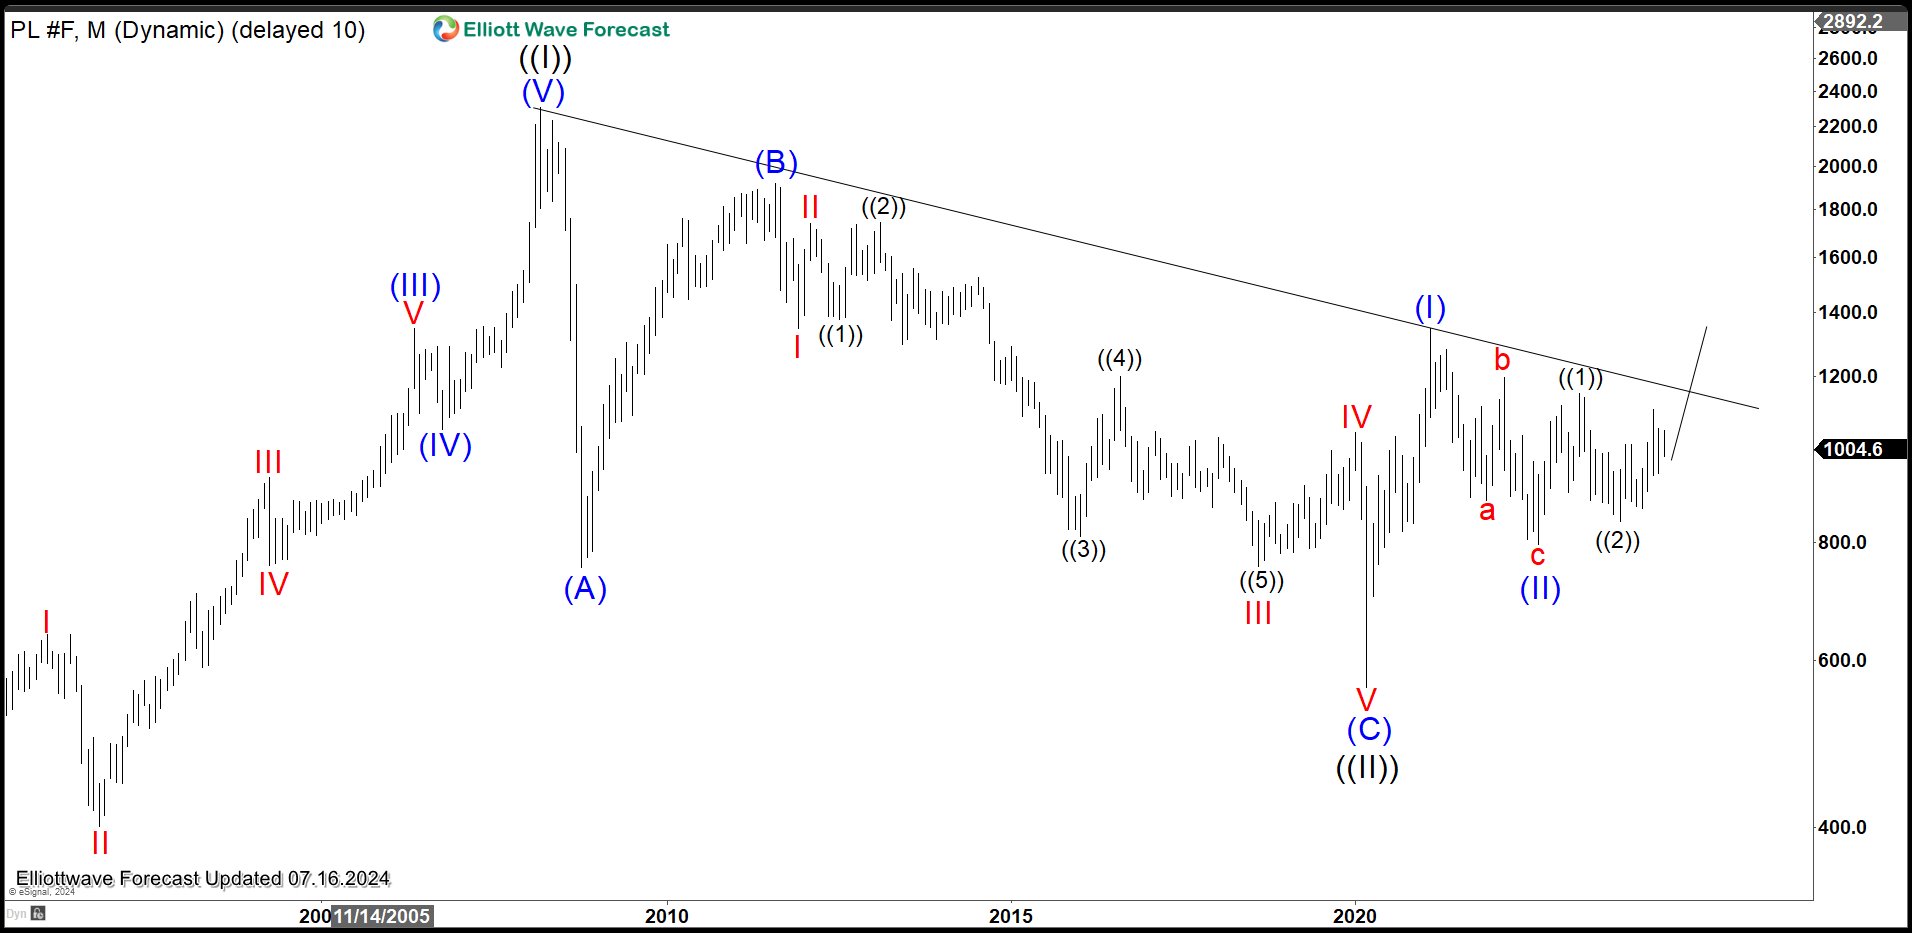
Platinum (PL) is still looking to resume the next bullish cycle. The metal still needs to break above 1348.2 to confirm that the next leg higher has started. Below we updated the Monthly and Daily Elliott Wave chart for the metal.
Platinum (PL) Monthly Elliott Wave Chart
Monthly chart of Platinum above shows Grand Cycle wave ((II)) correction ended at 562. The metal has turned higher in wave ((III)) with subdivision as a nesting impulse. Up from wave ((II)), Wave (I) of ((III)) ended at 1348.2. Pullback in wave (II) of ((III)) ended at 802.1 and the metal has traded sideways since then. Up from wave (II), wave ((1)) ended at at 1148.9. Pullback in wave ((2)) completed at 843.1. While dips stay above 843.1, the metal can see further upside.
Platinum (PL) Daily Elliott Wave Chart
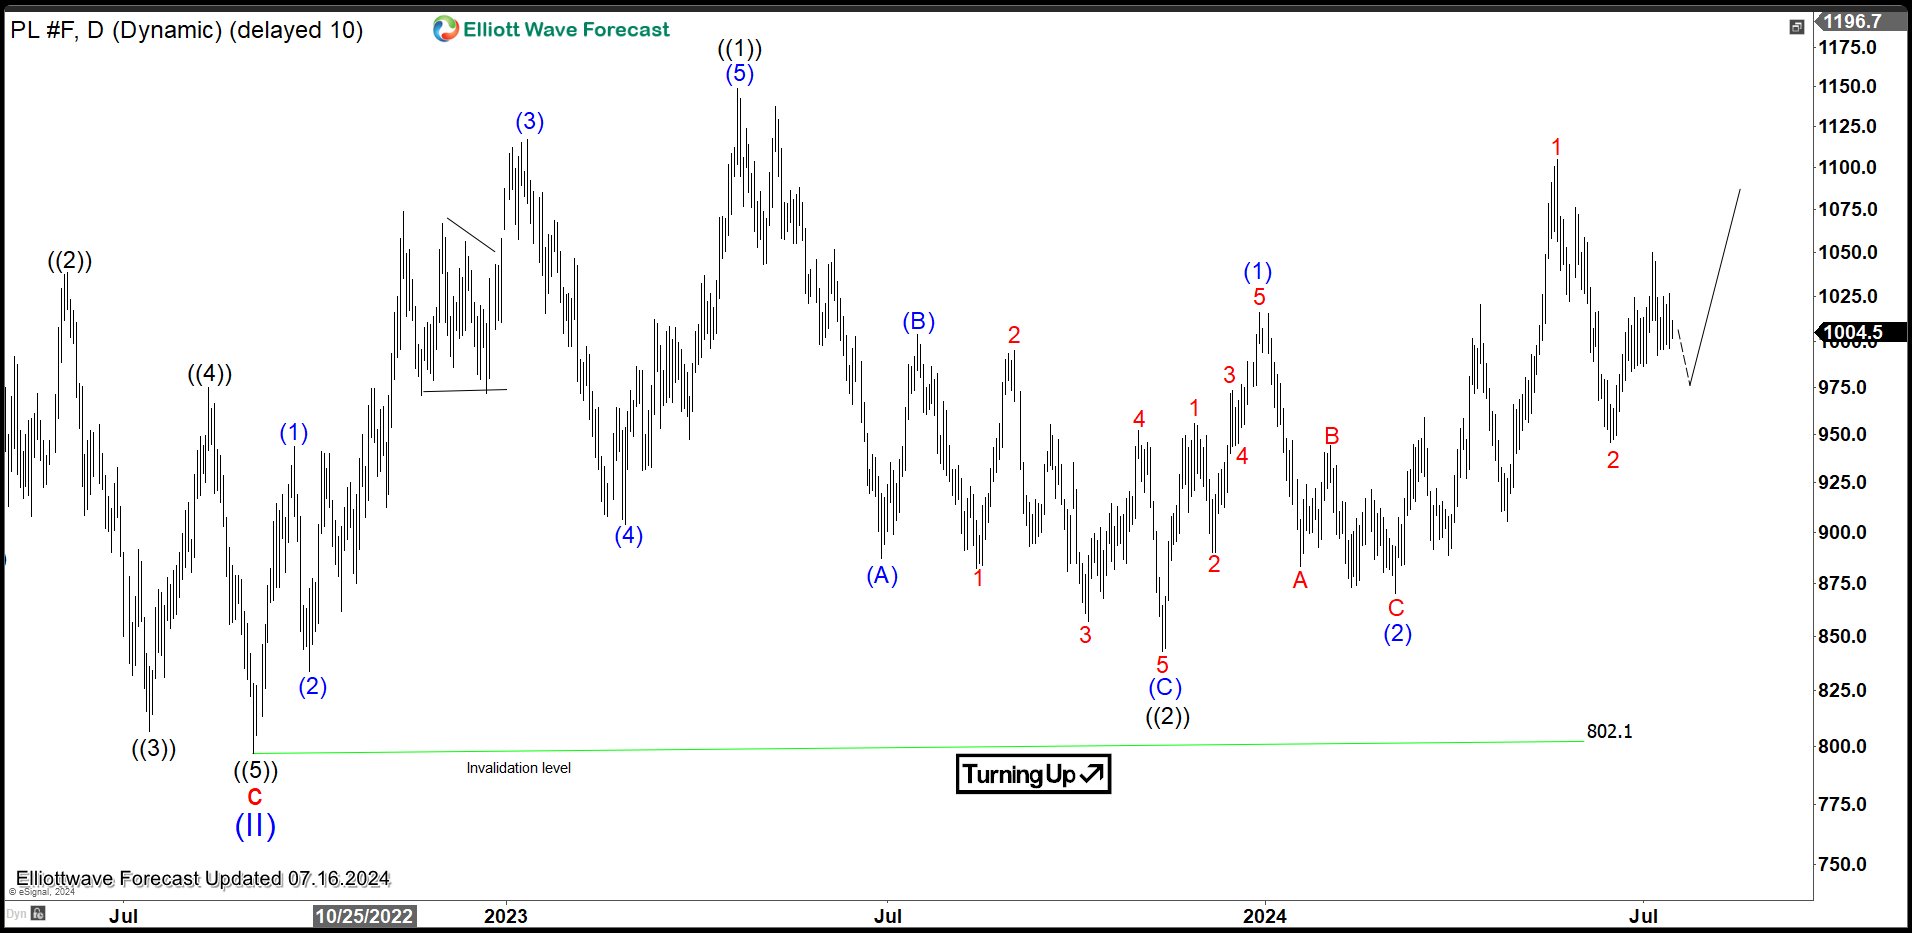
Daily chart of Platinum above shows that pullback in wave (II) ended at 802.1. Up from there, wave ((1)) ended at 1148.9 and pullback in wave ((2)) ended at 843.1. The metal then nested higher with wave (1) ended at 1016 and wave (2) ended at 870.1. Up from there, wave 1 ended at 1105 and dips in wave 2 ended at 945.7. Near term while above 802.1, expect the metal to extend higher.
Elliott Wave Intraday: Gold (XAUUSD) Breaks to New All-Time High
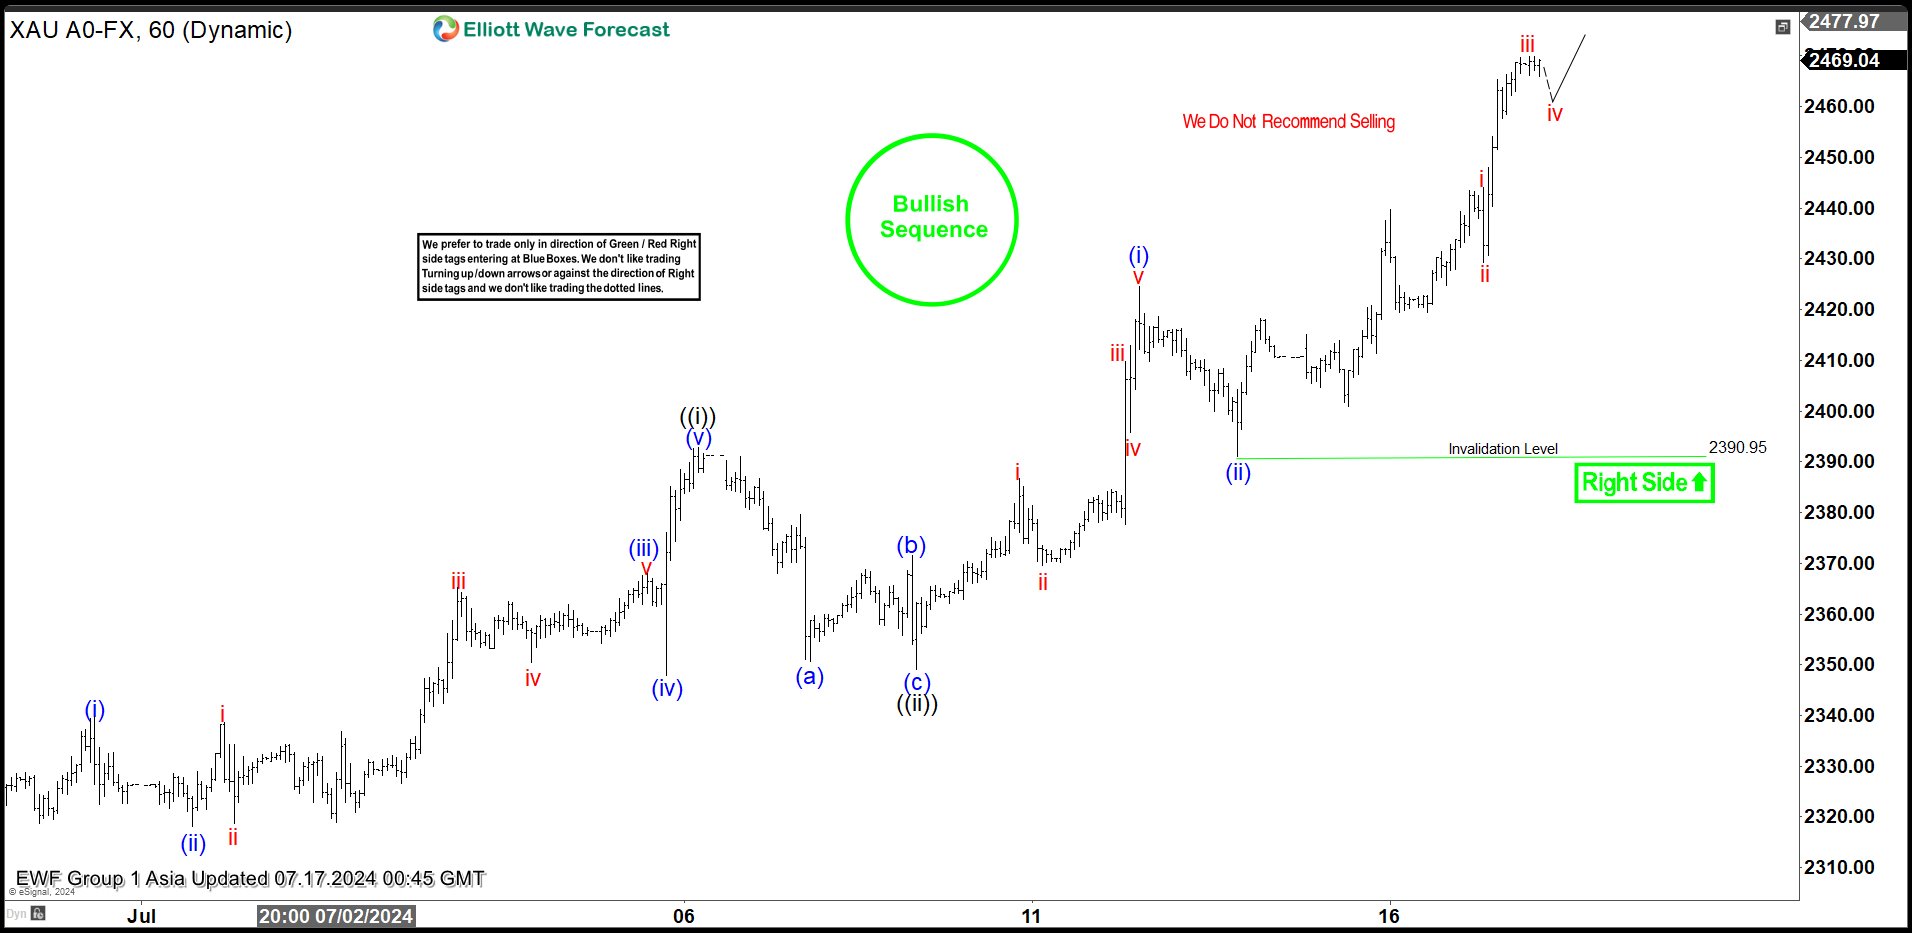
Gold (XAUUSD) has made a new all-time high which confirms the right side remains bullish in the near future. Cycle from 6.7.2024 low is currently in progress as a 5 waves impulse. Up from 6.7.2024 low, wave 1 ended at 2368.74 and pullback in wave 2 ended at 2293.46. Up from there, wave (i) ended at 2339.79 and dips in wave (ii) ended at 2318.10. Wave (iii) higher ended at 2368.06 and pullback in wave (iv) ended at 2347.79. Wave (v) higher ended at 2392.91 which completed wave ((i)) in higher degree as 1 hour chart below shows. Pullback in wave ((ii)) unfolded as a zigzag where wave (a) ended at 2350.7 and wave (b) ended at 2371.49. Wave (c) lower ended at 2349.1 which completed wave ((ii)) in higher degree.
The metal has extended higher in wave ((iii)). Up from wave ((ii)), wave (i) ended at 2424.55 and pullback in wave (ii) ended at 2390.95. Expect the metal to extend higher two more times to end wave v of (iii), then it should pullback in wave (iv) to correct cycle from 7.12.2024 low before turning higher again in wave (v) of ((iii)). Near term, as far as pivot at 2390.95 low stays intact, expect dips to find support in 3, 7, or 11 swing for further upside.
Gold (XAUUSD) 60 Minutes Elliott Wave Chart
XAUUSD Elliott Wave Video
https://www.youtube.com/watch?v=lL25oIxokMg
RBNZ to Deliver Some Pre-Xmas Cheer in November
- Today's CPI showed some welcome reduction in headline inflation.
- Services sector inflation is easing only gradually.
- Recent activity data has suggested recessionary conditions for a few months now.
- The RBNZ indicated an openness to tempering the restrictiveness of conditions in July – today's data gives them room to act on that strategy.
- We now see inflation is likely below 3% in Q3 and the path towards 2% seems more assured.
- Around a 30% chance of an earlier easing at the RBNZ's in October Review now exists.
- The tone of the RBNZ August Statement, labour market, QSBO and GDP data due in coming months will be key in determining how live October is.
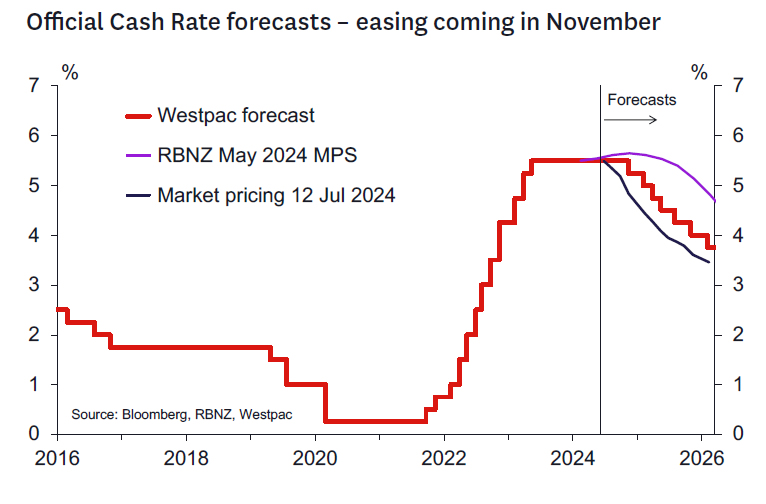
- We expect an initial 100 points of easing by mid-2025 in 25 basis point increments consistent with "tempering" restrictiveness.
- We continue to see a terminal OCR of 3.75 percent but will reach that point by early 2026 now.
The new OCR view.
We now expect the RBNZ to cut the OCR by 25 bp at the November Monetary Policy Statement. Thereafter we expect 25 bp cuts at each of the first three meetings of 2025 (February, April, and May) which will take the OCR to 4.5% by mid-2025. Thereafter we think the RBNZ will take a more cautious data dependent approach and reduce the OCR in 25 bp increments at the August and November 2025 Monetary Policy Statements bringing the OCR to 4% by end 2025. We see a final easing to 3.75% in early 2026 where we see the terminal rate.
This profile brings forward our previous OCR profile by around 6 months.
Rationale.
The RBNZ indicated in the July Review, unexpectedly, a willingness to consider "tapering" the degree of policy restriction. As we indicated in our review note, we thought the RBNZ's marked change in tone reflected the much weaker data flow seen in the last few months as well as greater confidence that inflation will be under 3% by "the second half of the year".
Today's CPI data was a key part of the case for bringing forward OCR cuts from our longstanding view that easing would begin in February 2025 as explained in our recent note. As is noted below, todays CPI seems to vindicate the RBNZ's view that inflation will soon be below 3%, giving them room to dial back restriction.
Additionally, we think the RBNZ will be revising down its near-term economic view. We see what now look like significant downside risks to our -0.2% Q2 GDP forecast given weak PMI data. Recent labour market indicators suggest upside risks to the unemployment rate (Westpac employment confidence, QSBO and weekly filled jobs). Its plausible the RBNZ is considering upgrading its unemployment rate forecasts again after a year or so of reducing them.
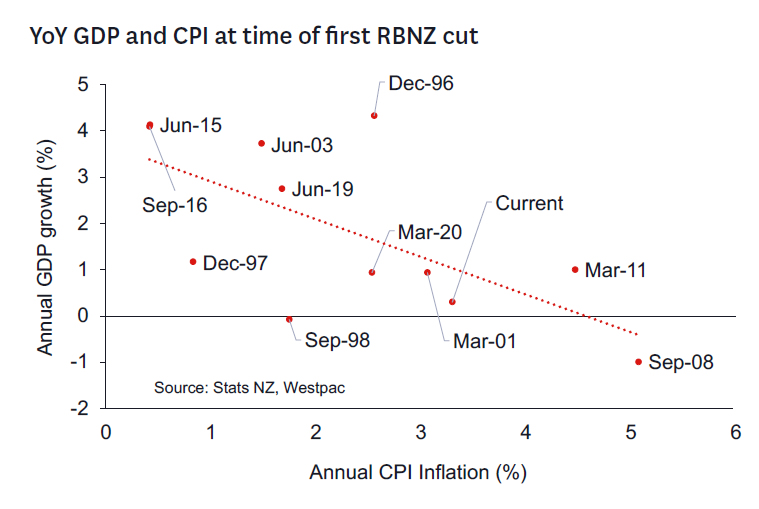
This lower inflation/growth combination looks consistent with some past episodes where the RBNZ has begun easing even while inflation was outside of the target range. These have been episodes where growth was weak and hence there was confidence that inflation would trend significantly lower given time and the usual lags. We think that the RBNZ is close to meeting this threshold now.
Risks and key immediate factors to focus on.
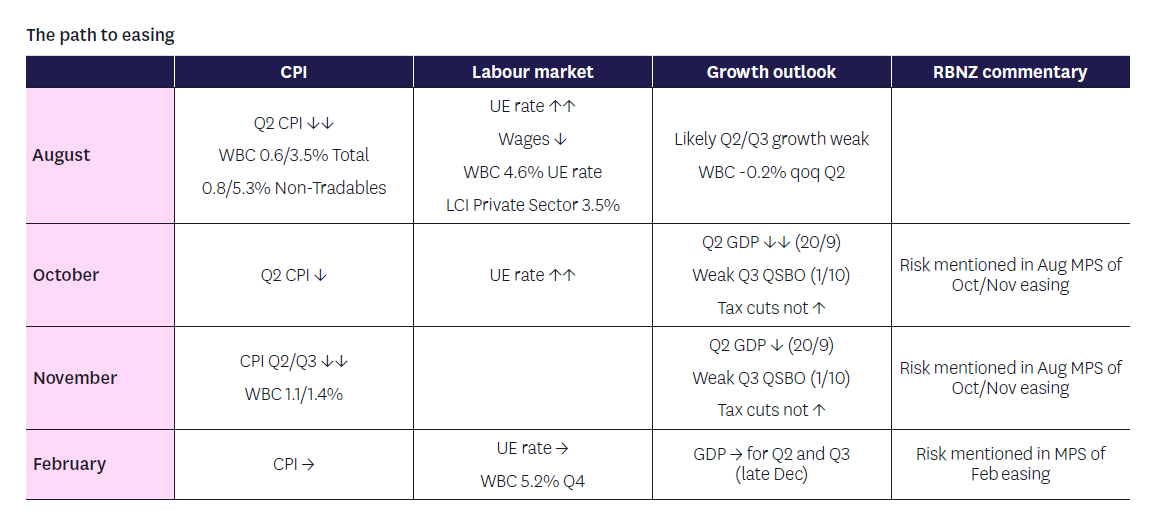
Our note last week describing the path to the first RBNZ easing still represents our view on the key factors to consider. Key will be the RBNZ's revised forecasts at the upcoming Monetary Policy Statement on 14 August. We would expect these forecasts to show a significant downgrade in inflation and OCR forecasts. In the case of the OCR we expect something closer to the scenario they presented in May 2023. This implied a probability of an easing in October and a very likely easing at the November Statement.
The table below summarizes some of the key factors to watch in the event the RBNZ eases sooner than November. The upcoming labour market will be of key focus as will emerging growth indicators and Q2 GDP. We think the RBNZ will be very data driven in terms of the timing of the first cut.
NZ First Impressions: Consumers Price Index, June quarter 2024.
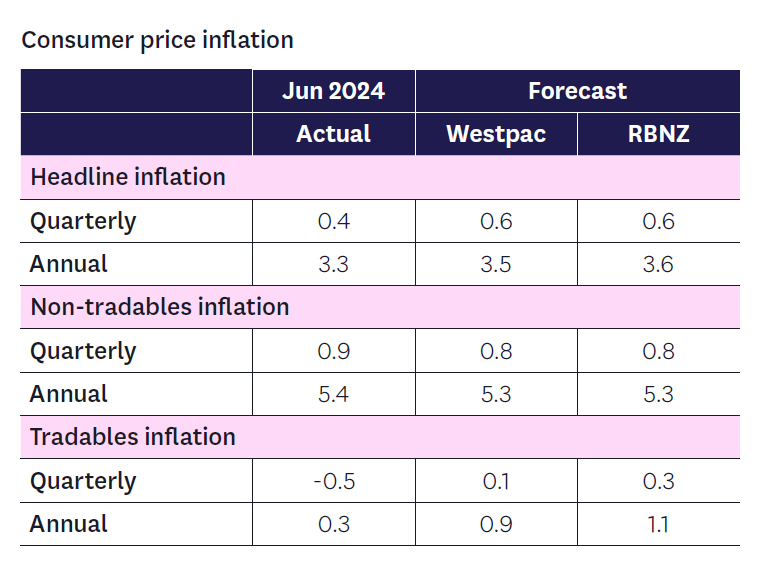
Inflation was lower than expected in the June quarter, with consumer prices rising by 0.4%. That saw the annual inflation rate slowing to 3.3%.
Discussion.
- Consumer prices rose 0.4% in the June quarter. That saw the annual inflation rate slowing to 3.4% (down from 4.0% in the year the March).
- The June quarter inflation result was below our forecast and the RBNZ's last published forecast.
- Underlying the June quarter rise in prices were higher rents, as well as continued increases in insurance premiums and increases in road user charges. On the downside, we saw lower prices in areas related to travel, like airfares and accommodation. There were also lower prices for furnishings and video games.
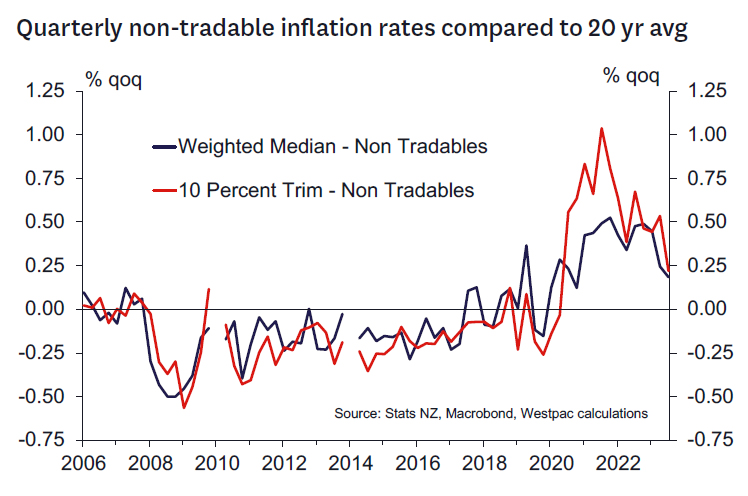
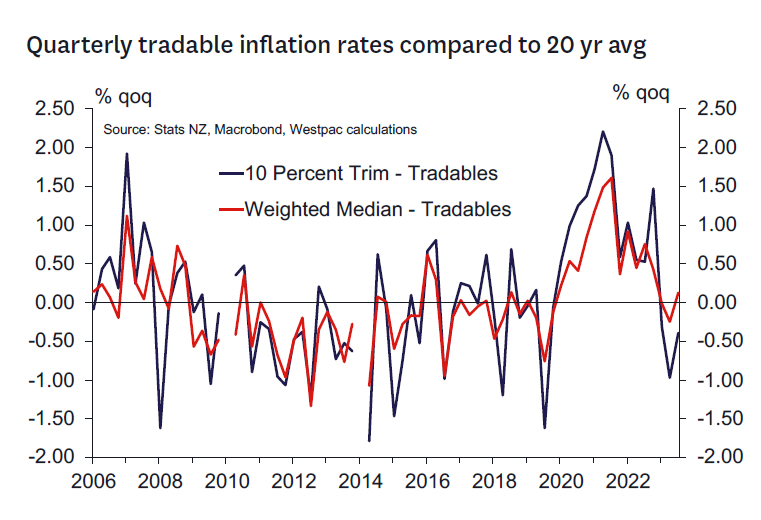
- The key takeout was in the breakdown of tradables (imported prices) and non-tradables (largely domestic services). Tradables inflation is dropping back (-0.5% qtr / +0.3% yr) and was much weaker than we or the RBNZ had anticipated. That's consistent with weak household spending and is likely to continue.
- However, domestic inflation continues to be sticky. Non-tradables prices were up 0.9% in the June quarter (+5.4% yr). That result was exaggerated by a large increase in road user changes. However, the underlying detail point to lingering domestic inflation pressures. In part that's due to continued increases in insurance costs, as well as items like energy prices. But domestic price pressures remain widespread – prices for domestic services more generally are continuing to rise at a solid pace.
- Core inflation measures (which track the underlying trend in inflation) illustrated the dichotomy in the economy. Overall core inflation measures have dropped back from over 4% to around 3.5% (for example, inflation excluding food and energy has slowed to 3.4% this quarter). However, while measure of tradables inflation have fallen to low levels, measures of domestic inflation are still falling gradually and continue to run at rates of over 5%.
In the detail.
- Insurance costs (3% of the CPI, included in the 'Miscellaneous goods and services' group) were the largest contributor to inflation in the June quarter, rising by 3.1%.
- Rents were up 1.2% in the June quarter, and are up 4.8% over the past year.
- There was also a 0.9% rise in the cost of purchasing a new home (aka. construction costs). That was rise was stronger than we've seen in recent quarters and came despite a slowdown in construction activity. It will be worth watching to see if this strength continues.
- Household energy costs (3% of the CPI) rose 4% this quarter, underpinned by the increases in electricity costs.
- On the downside, passenger transport costs (3% of the CPI) fell 3% in the June quarter, with seasonal drops in both domestic and international airfares. Similarly, prices in the recreational and culture group (10% of the CPI) were down 4.5%, mainly as a result of lower holiday accommodation costs.
- We also saw softness in prices for imported items like furnishings.
Australia’s Westpac leading index ticks up to -0.13%, below trend growth persists
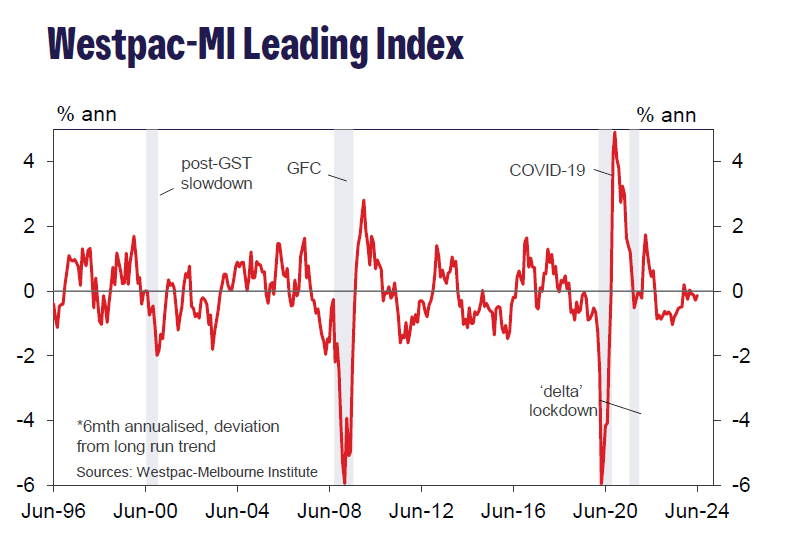
Australia's Westpac leading index saw a slight improvement, rising from -0.28% to -0.13% in June. Despite this uptick, economic activity is expected to remain below trend until early 2025.
Westpac said while growth is expected to pick up slightly in the latter half of 2024 and into early 2025, it will still be modest, at an annual pace of 2.2%, and is about flat in per capita terms.
New Zealand’s CPI slows to 3.3% in Q2, vs exp 3.5%
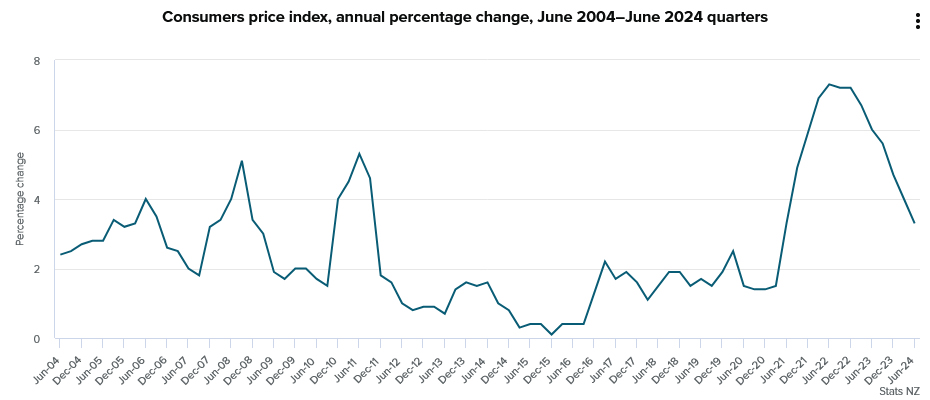
New Zealand's CPI for Q2 rose by 0.4% qoq, down from previous quarter's 0.6% qoq and missing the expected 0.5% qoq.
Tradeable inflation, which includes goods and services that are subject to international competition, fell by -0.5% qoq, an improvement from previous -0.7% qoq. Conversely, non-tradeable inflation, covering domestic goods and services, rose by 0.9% qoq, down from prior 1.6% qoq.
Over the past 12 months, CPI growth rate slowed from 4.0% yoy to 3.3% yoy, falling short of anticipated 3.5% yoy. This marks the lowest level since Q2 2021 but remains slightly above RBNZ's target band of 1-3%.
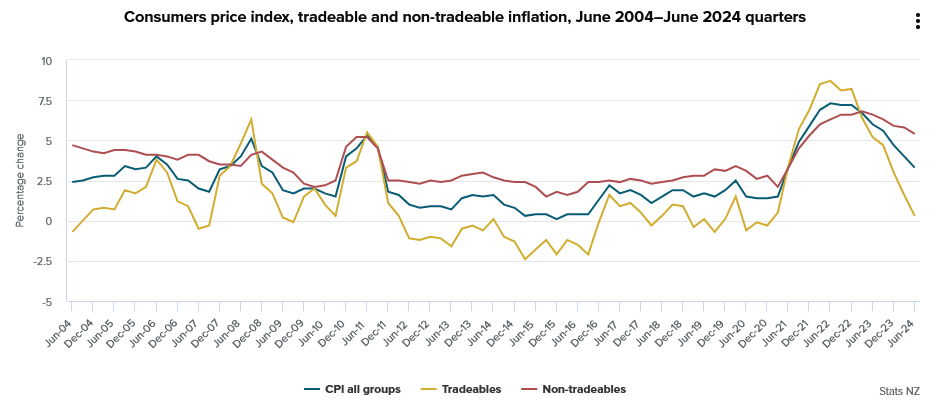
Tradeable inflation saw a significant decline from 1.6% yoy to 0.3% yoy, reflecting lower imported inflationary pressures. Non-tradeable inflation also eased, dropping from 5.8% yoy to 5.4% yoy, indicating some cooling in domestic price pressures.
IMF’s Gourinchas suggests Fed can wait before cutting rates
IMF chief economist Pierre-Olivier Gourinchas stated in a Reuters interview that Fed can afford to "wait a little bit" before lowering interest rates. He expected that one Fed rate cut is likely this year but refrained from specifying the timing.
Gourinchas noted that the IMF expects US inflation to reach Fed's 2% target in the first half of 2025, ahead of Fed's internal projection of 2026. This suggests that there would not be an "extended period" before rate cuts become appropriate.
Bitcoin Faces $66K Challenge: Can the Bull Run Continue?
Key Highlights
- Bitcoin price rallied above the $62,000 and $64,500 resistance levels.
- BTC is trading above a key bullish trend line with support at $61,550 on the 4-hour chart.
- Gold bulls are eyeing more upsides above the $2,480 level.
- USD/JPY is consolidating losses above the 157.50 support.
Bitcoin Price Technical Analysis
Bitcoin price started a steady increase after it cleared the $60,000 hurdle. BTC/USD broke a few important resistances near the $63,000 level to enter a positive zone.
Looking at the 4-hour chart, the price settled well above the $64,000 zone, the 100 simple moving average (red, 4 hours), and the 200 simple moving average (green, 4 hours). The bulls even pushed the price toward the $66,000 resistance zone.
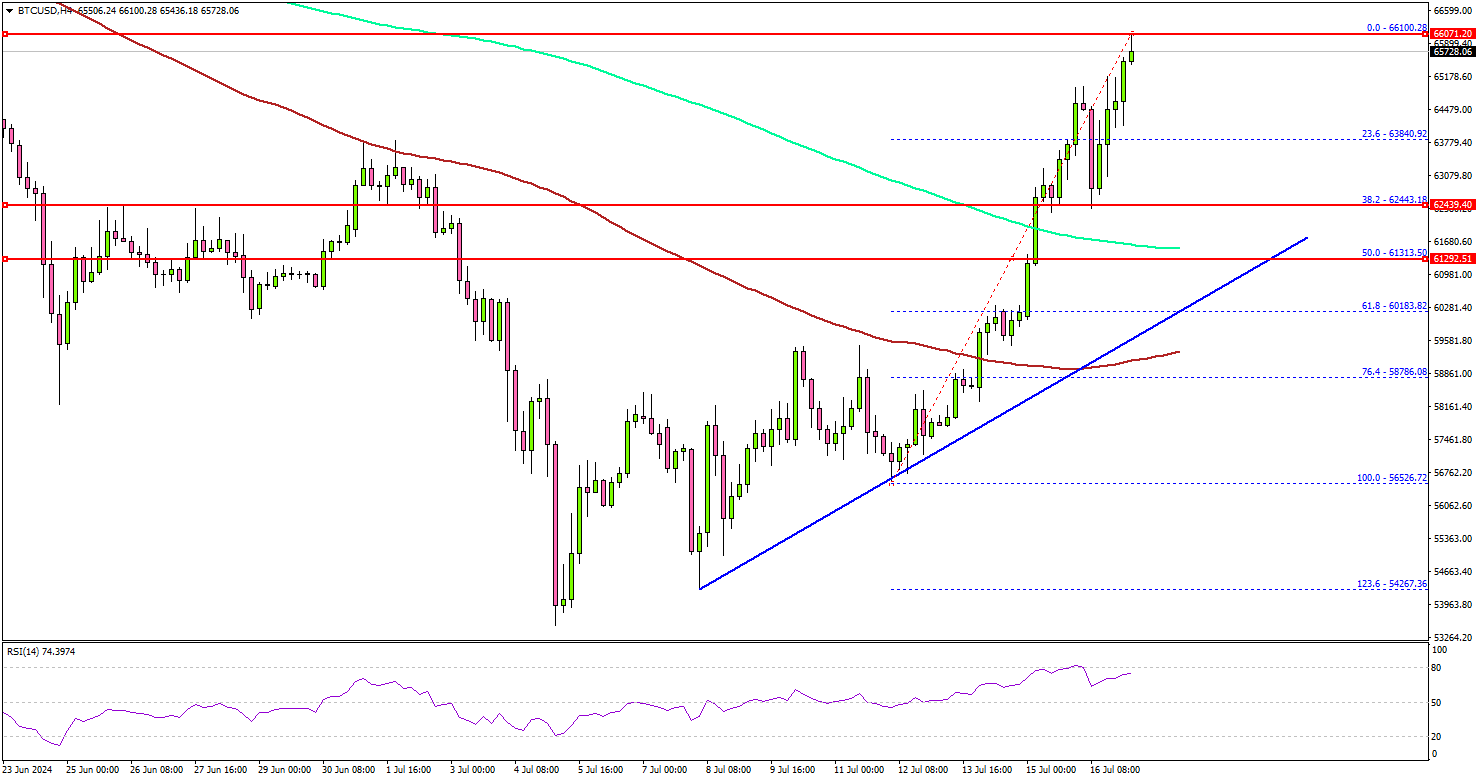
The price is now consolidating gains and facing heavy resistance near the $66,000 zone. A successful close above $66,000 might start another steady increase. In the stated case, the price may perhaps rise toward the $67,500 level.
Conversely, Bitcoin might start a downside correction. Immediate support is near the $62,400 level and the 200 simple moving average (green, 4 hours). The next key support sits at $61,500. There is also a key bullish trend line forming with support at $61,550 on the 4-hour chart.
A downside break below the trend line might send Bitcoin toward the 100 simple moving average (red, 4 hours) at $59,000. Any more losses might send the price toward the $58,000 support zone.
Looking at Gold, the bulls seem to be in action and they might soon aim for more gains above the $2,480 resistance level.
Today’s Economic Releases
- US Housing Starts for June 2024 (MoM) – Forecast 1.310M, versus 1.277M previous.
- US Building Permits for June 2024 (MoM) – Forecast 1.390M, versus 1.399M previous.
- US Industrial Production for June 2024 (MoM) – Forecast 0.3%, versus 0.9% previous.
Fed’s Kugler signals rate cuts later this year amid continued disinflation
In a speech overnight, Fed Governor Adriana Kugler noted that despite "a few bumps" earlier in the year, inflation has "continued to trend down" across "all price categories."
She mentioned that supply and demand are "gradually coming into better balance," with supply bottlenecks easing and demand moderating due to high interest rates and the depletion of households' excess savings.
Kugler also pointed out that the labor market has seen "substantial rebalancing," with nominal wage growth moderating. This trend suggests that inflation will continue moving toward Fed's 2% target.
Kugler indicated that if economic conditions continue to evolve favorably, with more rapid disinflation and resilient employment, "it will be appropriate to begin easing monetary policy later this year." However, she stressed that her approach will remain data-dependent.
She added that if the labor market cools too much and unemployment rises due to layoffs, it might be necessary to cut rates "sooner rather than later." On the other hand, if data do not confirm that inflation is moving sustainably toward 2%, it may be appropriate to "hold rates steady for a little longer."