
Sample Category Title
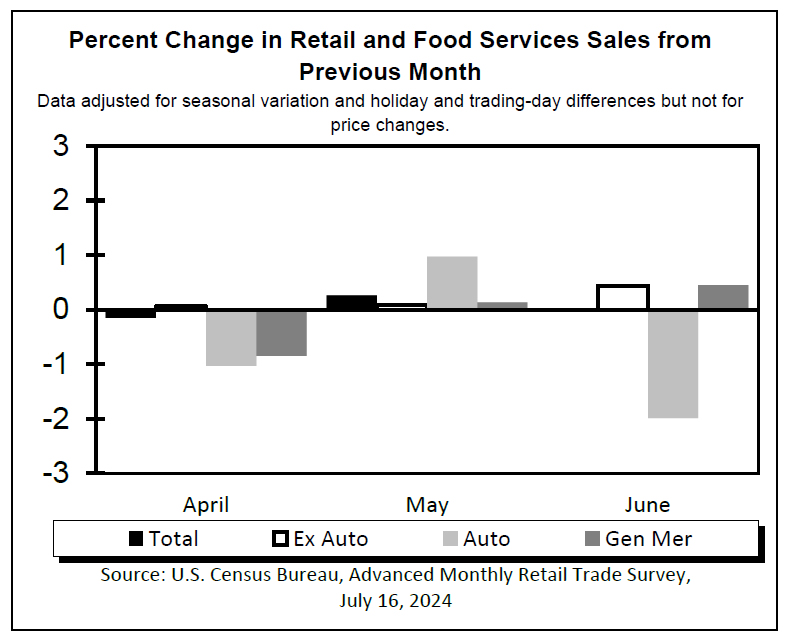
U.S. Headline Retail Sales Flat in June, But Core Accelerated
Retail sales was virtually unchanged month-over-month in June. Despite this, the reading was still higher than the consensus forecast calling for a decrease of -0.3%. Additionally, May's figure was revised upwards to a 0.3% monthly gain (previously 0.1%).
Trade in the auto sector was down -2.0% m/m, as the increase at automotive parts and accessory stores (1.0%) was wholly offset by the decline at motor vehicle dealers (-2.3%).
Sales at gasoline stations fell a sizeable -3.0% m/m, extending last month's -2.1% m/m decline and reflects the continued pullback in gas prices. The building materials and equipment category rose by 1.4% m/m.
Sales in the retail sales "control group", which excludes the volatile components above (autos, building materials and gas) and is used to estimate personal consumption expenditures (PCE), rose 0.9% on the month after rising by 0.4% m/m in May.
Among the control group, the largest positive contributions came from non-store retailers (1.9%% m/m), health and personal care stores (0.9%) and clothing and accessory stores (0.6% m/m).
The only control-group category to decline was sporting goods and hobby stores (-0.1% m/m).
Food services & drinking places – the only services category in the retail sales report –rose 0.3%. May's data was also revised to growth of 0.4% (reported as a -0.4% m/m decline previously).
Key Implications
Retail sales have had a rather tepid showing for much of the second quarter and today's outturn added to the lackluster performance. The data adds to the growing evidence that households aren't quite as impervious to higher interest rates and prices as earlier spending might have suggested. With recent data showing that labor market conditions continue to cool, prospects for a rebound are limited. All said, retail sales did stage a modest rebound in the second quarter, up 2.2% q/q (annualized) from a -0.8% (annualized) decline last quarter.
And the consistent data continues to roll in. Fed members have stressed data dependence in their quest to bring inflation to heel without triggering an economic slump. Today's report showing waning consumer spending adds to the recent employment and inflation numbers in that train of data. In Fed Chair Powell’s first remarks since the inflation report, he noted that the central bank will not wait for inflation to hit 2% before cutting rates. While he might not have been intending to make any signals about when the Fed might start to cut rates, market players have nonetheless parsed his words for any hints of when one might be forthcoming. So far, bets are rising for a September cut.
Dollar Gains After Retail Sales Boost; Gold Nears New Record
Dollar bounces higher in early US session, buoyed by stronger-than-expected retail sales data. This resilience in consumer spending comes despite the persistent high inflation and elevated interest rates. The robust retail sales figures lend support to Fed's soft landing scenario, where the economy slows down without falling into a recession. However, there are concerns that such strong consumer demand might impede the ongoing disinflation process, which is crucial for Fed to consider lowering interest rates in the future.
Conversely, Loonie, is facing some pressure following weaker-than-expected inflation data, especially in core measures. Despite this, Loonie is holding up relatively well against most other currencies. The markets are likely to take some time to fully digest the implications of the latest inflation readings and their impact on BoC's rate decision next week.
Currently, Dollar stands as the strongest performer of the day, followed by Euro and Loonie. Aussie is the worst performer, lagging even behind Yen, with Kiwi trailing closely. Sterling and Swiss franc are positioned in the middle of the performance spectrum.
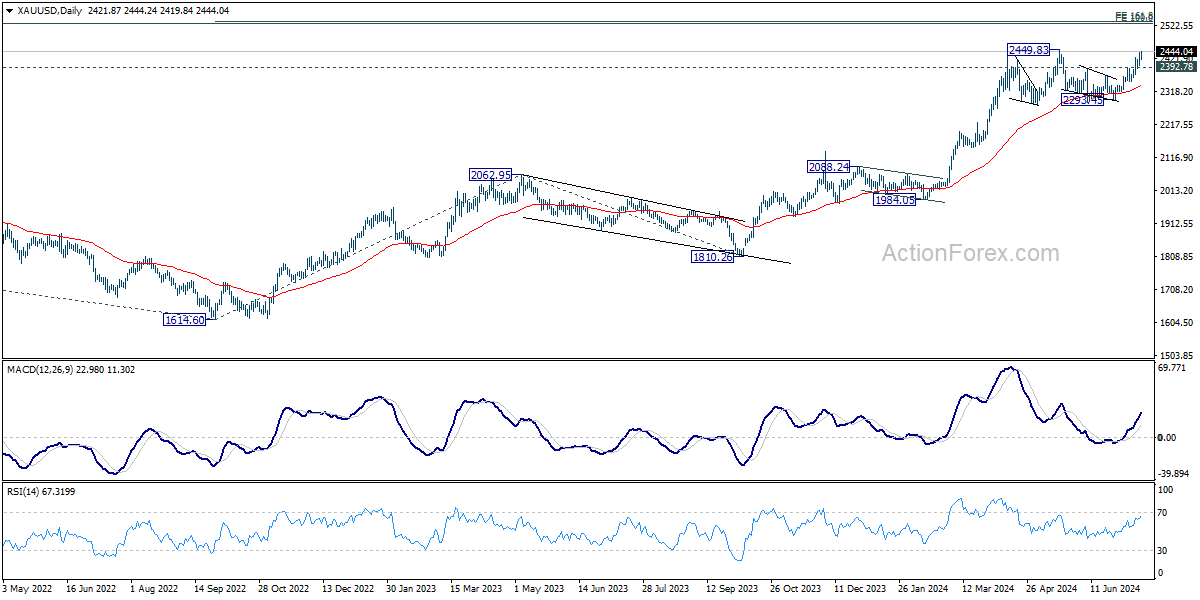
Technically, Gold is on the verge of making new record high. Decisive break of 2449.83 will resume larger up trend. Next target is 161.8% projection of 1614.60 to 2062.95 from 1810.26 at 2535.96. However, break of 2392.78 support will indicate rejection by 2449.83 and extend the medium term consolidation pattern with another fall.
In Europe, at the time of writing, FTSE is down -0.56%. DAX is down -0.51%. CAC is down -0.77%. UK 10-year yield is down -0.0289 at 4.075. Germany 10-year yield is down -0.034 at 2.442. Earlier in Asia, Nikkei rose 0.20%. Hong Kong HSI fell -1.60%. China Shanghai SSE rose 0.08%. Singapore Strait Times fell -0.34%. Japan 10-year JGB yield fell -0.0259 to 1.024.
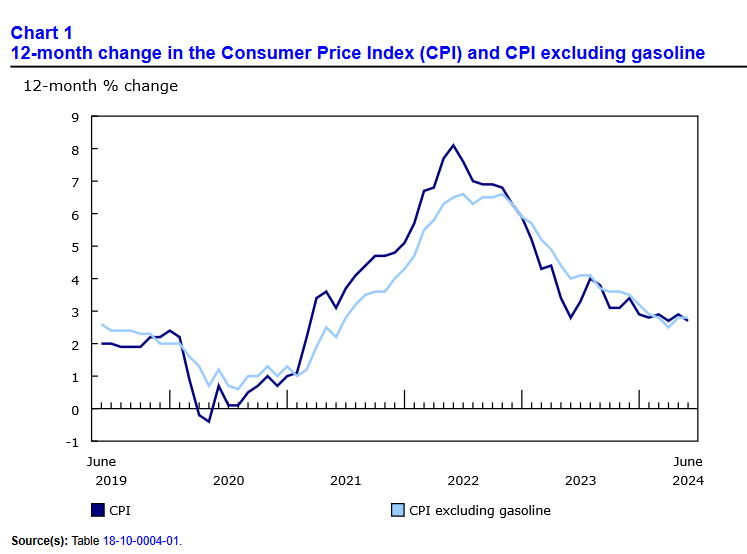
Canada CPI slows to 2.7% yoy in June, down-0.1% mom
Canada's CPI slowed from 2.9% yoy to 2.7% yoy in May. The deceleration was largely the result of slower year-over-year growth in gasoline prices, which rose 0.4% in June following a 5.6% increase in May. Excluding gasoline, the CPI rose 2.8% yoy.
Looking at the core measures, CPI median fell from 2.7% yoy to 2.6% yoy. CPI trimmed was unchanged at 2.9% yoy. CPI common slowed from 2.4% yoy to 2.3% yoy.
On a monthly basis, CPI fell -0.1% mom in June, following a 0.6% mom increase in May. The monthly decrease was driven by lower prices for travel tours (-11.1%) and gasoline (-3.1%).
US retail sales steady in Jun, ex-auto sales up 0.4% mom
US retail sales was steady mom at USD 704.3B in June, above expectation of -0.20% mom. Ex-auto sales rose 0.4% mom to USD 573.6B, above expectation of 0.1% mom. Ex-gasoline sales rose 0.2% mom to USD 652.4B. Ex-auto and gasoline sales rose 0.8% mom to USD 507.1B.
Total sales for the April through June period were up 2.5% from the same period a year ago.
German ZEW falls to 41.8, first decline in a year
Germany ZEW Economic Sentiment fell from 47.5 to 41.8 in July, below expectation of 44.3. That's also the first decline in a year since July 2023. Current Situation Index rose from -73.8 to -68.9, above expectation of -73.0.
Eurozone ZEW Economic Sentiment fell from 51.3 to 43.7, below expectation of 50.2. Current Situation Index rose 2.5 pt to -36.1.
"The economic outlook is worsening. For the first time in a year, economic expectations for Germany are falling. The fact that German exports decreased more than expected in May, the political uncertainty in France and the lack of clarity regarding the future monetary policy by the ECB have contributed to this development," comments ZEW President Professor Achim Wambach.
Eurozone goods exports fall -0.5% yoy in May, imports down -6.4% yoy
Eurozone goods exports fell -0.5% yoy to EUR 241.5B in May. Goods imports fell -6.4% yoy to EUR 227.6B. Trade balance showed a EUR 13.9B surplus. Intra-Eurozone trade fell -5.6% yoy to EUR 216.0B.
In seasonally adjusted term, goods exports fell -2.6% mom to EUR 237.4B. Goods imports fell -0.1% mom to EUR 225.1B. Trade balance recorded EUR 12.3B surplus, smaller than expectation of EUR 20.3B. Intra-Eurozone trade fell -2.8% mom to EUR 210.4B.
EUR/USD Mid-Day Outlook
Daily Pivots: (S1) 1.0877; (P) 1.0900; (R1) 1.0916; More....
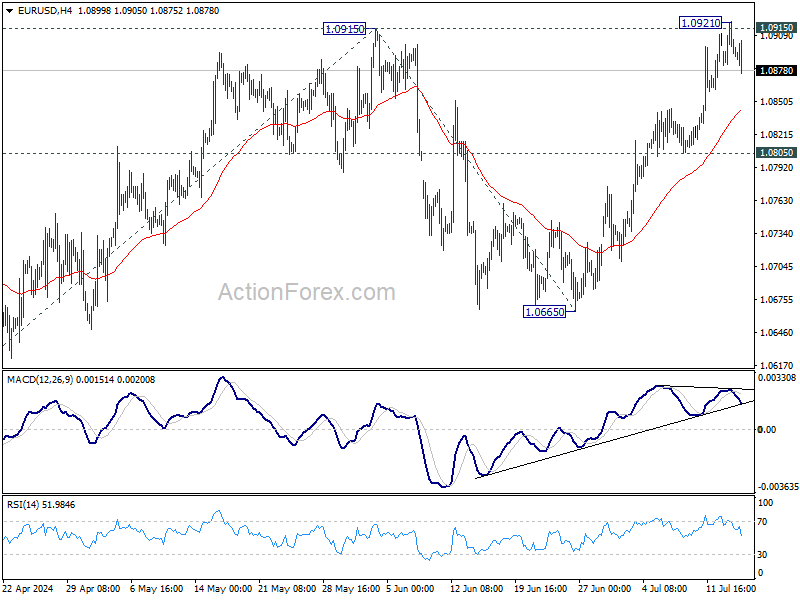
EUR/USD's retreat from 1.0921 extends lower today but stays well above 1.0805 support so far. Intraday bias remains neutral first. Some more consolidations would be seen but further rally is in favor. Firm break of 1.0915/21 will will resume whole rise from 1.0601 to 100% projection of 1.0601 to 1.0915 from 1.0665 at 1.0979. However, break of 1.0805 will turn bias back to the downside for deeper pullback.
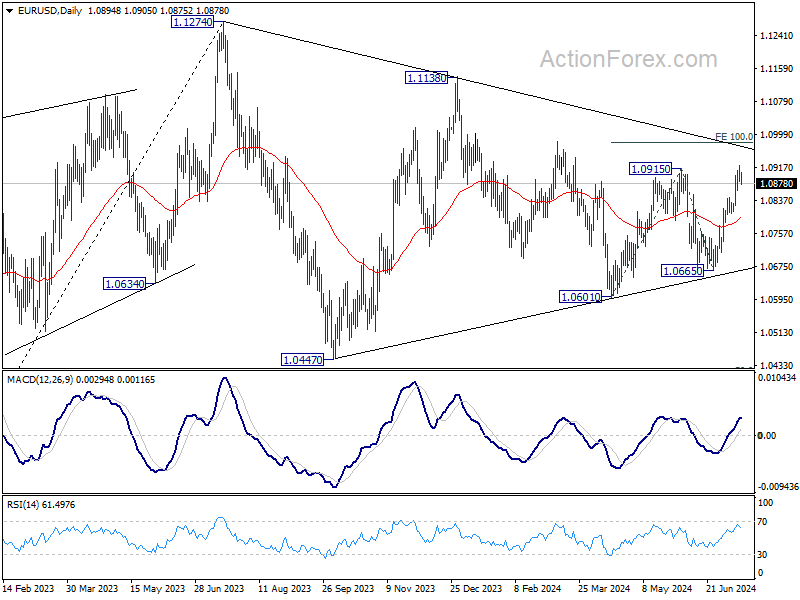
In the bigger picture, price actions from 1.1274 are viewed as a corrective pattern, possibly a triangle, that's still be in progress. Break of 1.1138 resistance will be the first signal that rise from 0.9534 (2022 low) is ready to resume through 1.1274 (2023 high). This will now remain the favored case as long as 1.0601 support holds.
Economic Indicators Update
| GMT | Ccy | Events | Actual | Forecast | Previous | Revised |
|---|---|---|---|---|---|---|
| 04:30 | JPY | Tertiary Industry Index M/M May | -0.40% | 0.20% | 1.90% | 2.20% |
| 09:00 | EUR | Eurozone Trade Balance (EUR) May | 12.3B | 20.3B | 19.4B | |
| 09:00 | EUR | Germany ZEW Economic Sentiment Jul | 41.8 | 44.3 | 47.5 | |
| 09:00 | EUR | Germany ZEW Current Situation Jul | -68.9 | -73 | -73.8 | |
| 09:00 | EUR | Eurozone ZEW Economic Sentiment Jul | 43.7 | 50.2 | 51.3 | |
| 12:15 | CAD | Housing Starts Y/Y Jun | 242K | 259K | 265K | |
| 12:30 | CAD | CPI M/M Jun | -0.10% | 0.10% | 0.60% | |
| 12:30 | CAD | CPI Y/Y Jun | 2.70% | 2.90% | ||
| 12:30 | CAD | CPI Median Y/Y Jun | 2.60% | 2.70% | 2.80% | 2.70% |
| 12:30 | CAD | CPI Trimmed Y/Y Jun | 2.90% | 2.80% | 2.90% | |
| 12:30 | CAD | CPI Common Y/Y Jun | 2.30% | 2.40% | 2.40% | |
| 12:30 | USD | Retail Sales M/M Jun | 0.00% | -0.20% | 0.10% | |
| 12:30 | USD | Retail Sales ex Autos M/M Jun | 0.40% | 0.10% | -0.10% | |
| 12:30 | USD | Import Price Index M/M Jun | 0.00% | 0.20% | -0.40% | |
| 14:00 | USD | Business Inventories May | 0.30% | 0.30% | ||
| 14:00 | USD | NAHB Housing Market Index Jul | 44 | 43 |
USD/JPY Mid-Day Outlook
Daily Pivots: (S1) 157.32; (P) 157.88; (R1) 158.57; More...
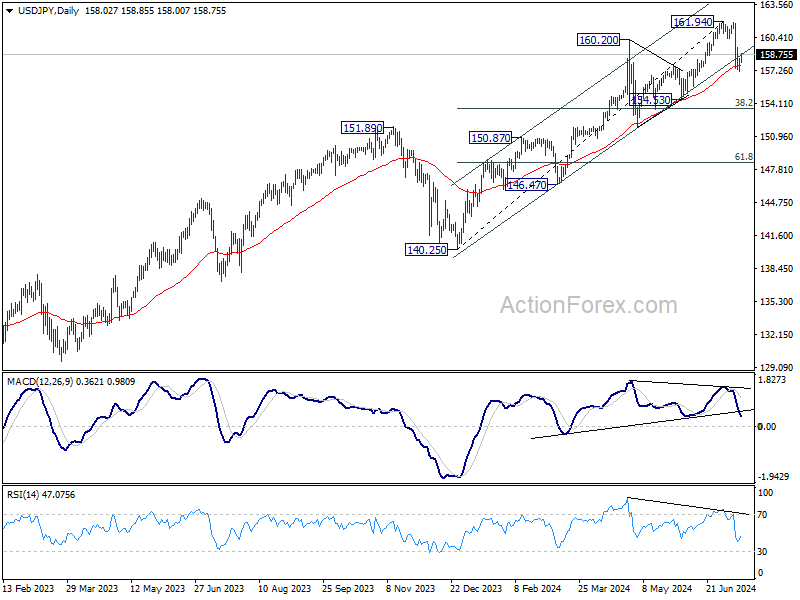
Intraday bias in USD/JPY remains neutral for consolidations above 157.61. On the downside, break of 157.16 and sustained trading below 55 D EMA (now at 157.72) will bring deeper correction to 38.2% retracement of 140.25 to 161.94 at 163.65. But strong support should be seen there to bring rebound. Meanwhile, break of 159.44 minor resistance will turn bias back to the upside for stronger rebound towards 161.94 high.
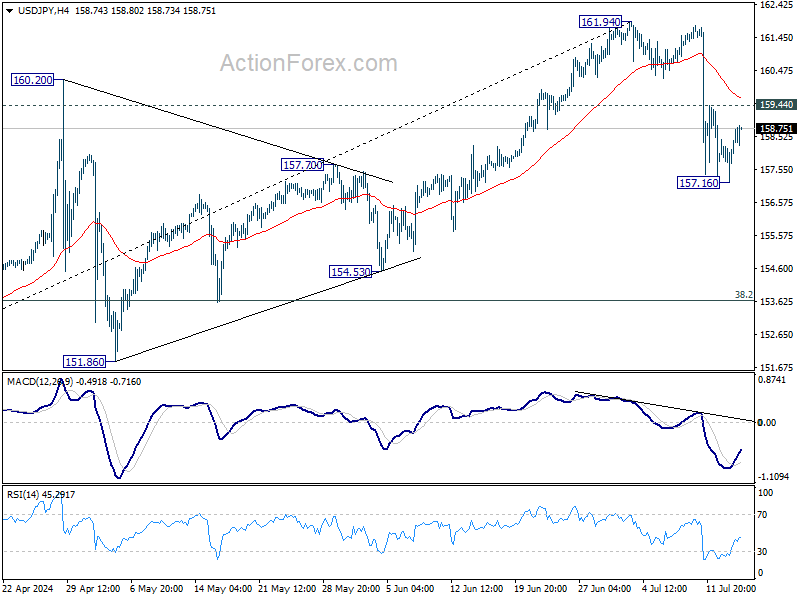
In the bigger picture, as long as 151.89 resistance turned support holds, long term up trend could still continue through 161.94 at a later stage. Next target will depend on the depth of the current correction from 161.94. However, sustained break of 151.89 will argue that larger scale correction or trend reversal is underway.
USD/CHF Mid-Day Outlook
Daily Pivots: (S1) 0.8937; (P) 0.8955; (R1) 0.8975; More…
Intraday bias in USD/CHF stays neutral first. Another fall is mildly in favor with 0.9000 resistance intact. Below 0.8914 will bring retest of 0.8825 low. However, break of 0.9000 will turn bias back to the upside for 0.9049 resistance instead.

In the bigger picture, with 0.9243 resistance intact, medium term outlook in USD/CHF is neutral at best. For now, more sideway trading is likely between 0.8332/9243. However, firm break of 0.9243 will indicate larger bullish trend reversal.

GBP/USD Mid-Day Outlook
Daily Pivots: (S1) 1.2955; (P) 1.2975; (R1) 1.2988; More...
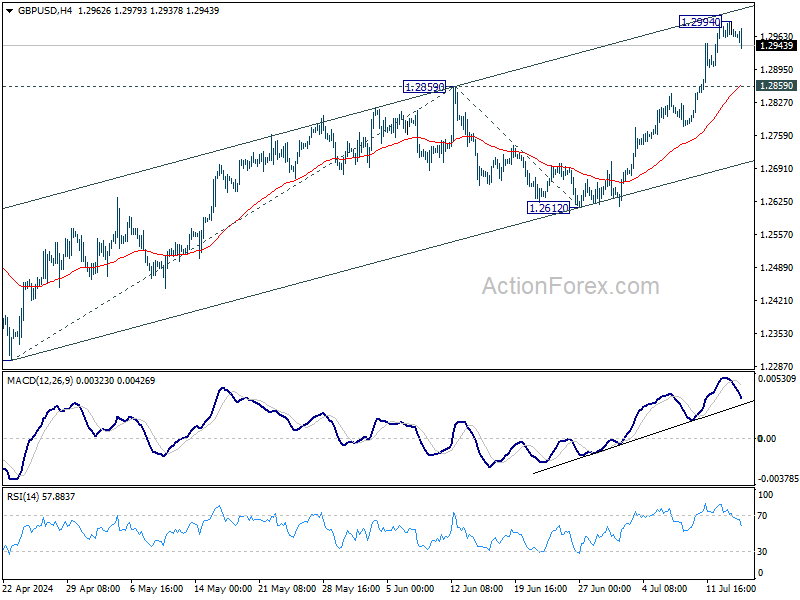
Intraday bias in GBP/USD remains neutral for consolidations below 1.2994 temporary top. But further rally is expected as long as 1.2859 resistance turned support holds. Above 1.2994 will resume the rally from 1.2298 and target 100% projection of 1.2298 to 1.2859 from 1.2612 at 1.3173, which is slightly above 1.3141 key medium term resistance. However, break of 1.2859 will turn bias to the downside for deeper pullback.
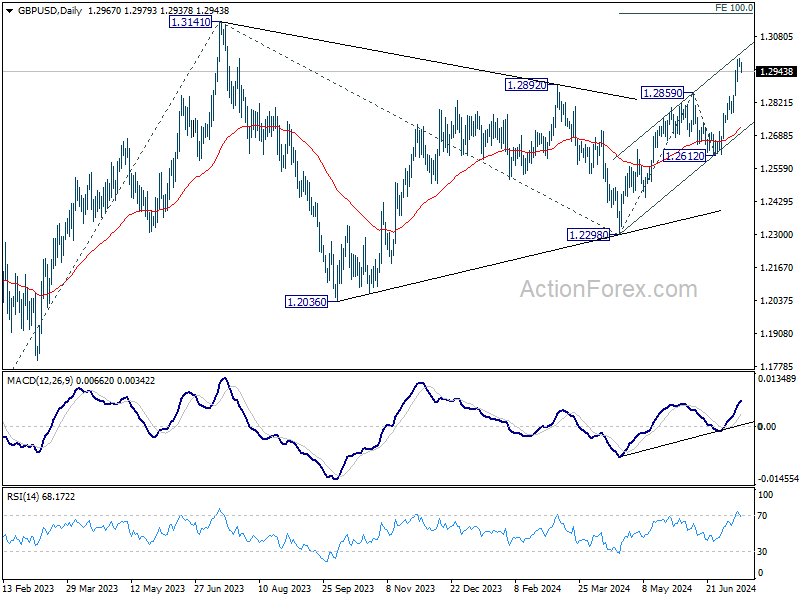
In the bigger picture, corrective pattern from 1.3141 medium term top (2023 high) could have completed with three waves to 1.2298 already. This will now remain the favored case as long as 1.2612 support holds. Firm break of 1.3141 will target 61.8% projection of 1.0351 (2022 low) to 1.3141 from 1.2298 at 1.4022.
EUR/USD Mid-Day Outlook
Daily Pivots: (S1) 1.0877; (P) 1.0900; (R1) 1.0916; More....
EUR/USD's retreat from 1.0921 extends lower today but stays well above 1.0805 support so far. Intraday bias remains neutral first. Some more consolidations would be seen but further rally is in favor. Firm break of 1.0915/21 will will resume whole rise from 1.0601 to 100% projection of 1.0601 to 1.0915 from 1.0665 at 1.0979. However, break of 1.0805 will turn bias back to the downside for deeper pullback.
In the bigger picture, price actions from 1.1274 are viewed as a corrective pattern, possibly a triangle, that's still be in progress. Break of 1.1138 resistance will be the first signal that rise from 0.9534 (2022 low) is ready to resume through 1.1274 (2023 high). This will now remain the favored case as long as 1.0601 support holds.
Canada CPI slows to 2.7% yoy in June, down-0.1% mom
Canada's CPI slowed from 2.9% yoy to 2.7% yoy in June. The deceleration was largely the result of slower year-over-year growth in gasoline prices, which rose 0.4% in June following a 5.6% increase in May. Excluding gasoline, the CPI rose 2.8% yoy.
Looking at the core measures, CPI median fell from 2.7% yoy to 2.6% yoy. CPI trimmed was unchanged at 2.9% yoy. CPI common slowed from 2.4% yoy to 2.3% yoy.
On a monthly basis, CPI fell -0.1% mom in June, following a 0.6% mom increase in May. The monthly decrease was driven by lower prices for travel tours (-11.1%) and gasoline (-3.1%).
US retail sales steady in Jun, ex-auto sales up 0.4% mom
US retail sales was steady mom at USD 704.3B in June, above expectation of -0.20% mom. Ex-auto sales rose 0.4% mom to USD 573.6B, above expectation of 0.1% mom. Ex-gasoline sales rose 0.2% mom to USD 652.4B. Ex-auto and gasoline sales rose 0.8% mom to USD 507.1B.
Total sales for the April through June period were up 2.5% from the same period a year ago.
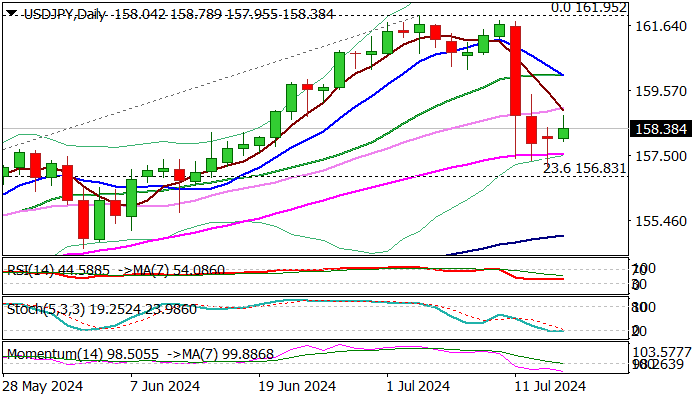
USD/JPY: May fall Further If US Retail Sales Miss in June
USDJPY remains in extended consolidation of last week’s sharp fall, sparked by US inflation data and intervention by Japanese authorities.
Near-term action is holding above 55DMA (157.55) which repeatedly contained dips and marks solid support for now.
Traders also take a breather, awaiting fresh signals from US retail sales, due today, which may further deflate dollar if June numbers miss forecasts, as Further intervention could be expected in such scenario.
Weaker daily studies add to potential bearish outlook, with firm break of 55DMA pivot to expose targets at 154.98 (100DMA) and 154.54 (June 4 higher low) and risk further losses on violation of the latter.
Converged 5/30DMA’s mark initial resistance (159.03), guarding upper pivot at 160.05 (converged 10/20DMA’s.
Res: 159.53; 160.05; 160.25; 161.80.
Sup: 157.55; 156.83; 155.71; 154.98.
GBP/USD Faces Challenges in Breaking Through Key 1.3000 Level
- GBP/USD struggles to break above the 1.3000 level despite softer US data and a dovish comment from Fed Chair Powell.
- UK inflation data will be crucial in determining whether GBP/USD can break above 1.3000.
- Technical analysis suggests GBP/USD may struggle to break above 1.3000 due to option barriers and overbought RSI.
Cable is hovering just below the psychological 1.3000 level, with Fed Chair Powell’s remarks at the Economic Club of Washington yesterday failing to spark momentum.
The US Dollar gained slightly amid political uncertainty in the US and the Republican nomination announcement. Markets do seem to be buoyed by the prospect of a Trump Presidency providing support to the US Dollar and long dated Treasury yields.
Currency Strength Meter, July 16, 2024
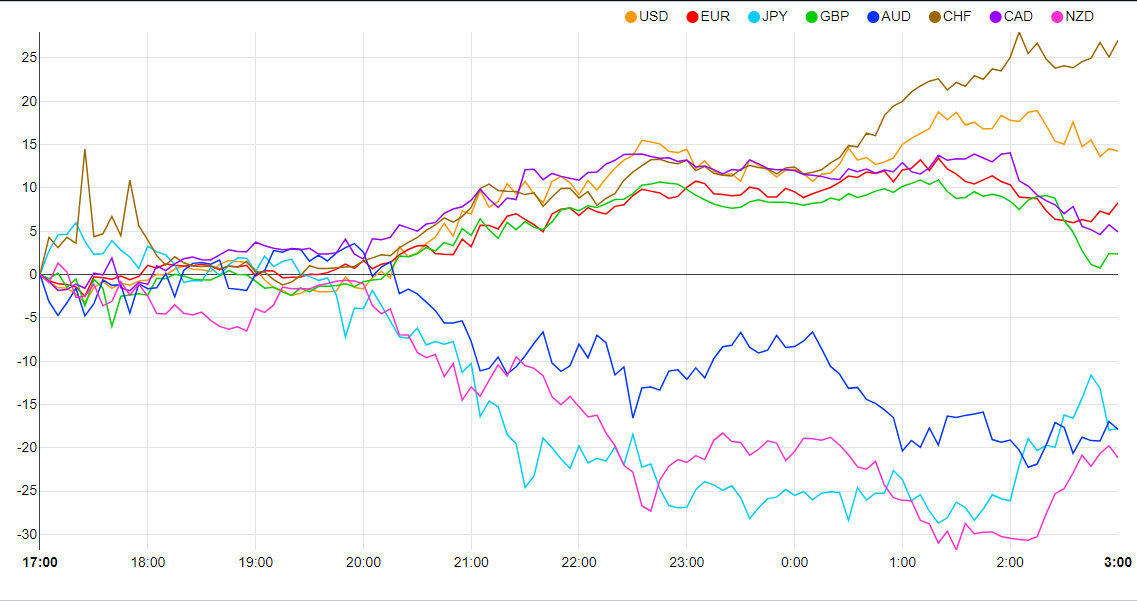
Source: FinancialJuice (click to enlarge)
Last week’s rally in GBP/USD was driven by softer US data, particularly the US inflation report. During his speech at the Economic Club yesterday, Fed Chair Powell maintained a largely neutral stance but made one notably dovish comment. He mentioned that the Fed had been waiting for additional confirmation that inflation was on the right track in Q1, which did not materialize. However, he noted that the three readings in the second quarter and one from last week have added some confidence.
Powell’s comments regarding last week’s data may partly explain the US Dollar’s resilience and Cable’s hesitation near a significant psychological level.
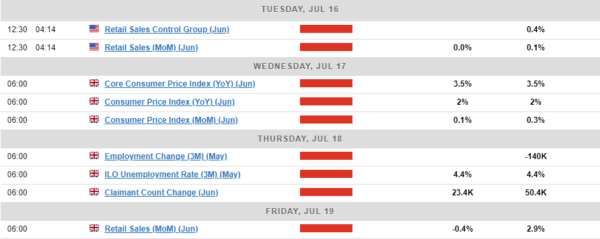
The Week Ahead: US Retail Sales, UK Inflation and Employment Data Ahead
The economic calendar for the upcoming week is packed with high-impact UK data releases. UK inflation data is of particular importance, as the Bank of England’s 2% target was met in the June 19 release. Market participants are keen to see if inflation can maintain this level, especially amid rumors of a potential uptick in UK inflation during the second half of 2024.
If the inflation rate hovers around or below the 2% year-over-year mark, sterling’s momentum could stall, preventing GBP/USD from sustainably rising above the 1.3000 level. Conversely, any indication of increased inflation might serve as the catalyst to propel GBP/USD past this key psychological threshold.
US retail sales data is due later today, but it’s not typically a key market mover in my analysis. I anticipate any reactions to the retail sales data to be short-lived, potentially causing volatility without leading to sustained market movements.
Technical Analysis GBP/USD
From a technical perspective, GBP/USD has struggled to surpass the psychological 1.3000 level, which is reinforced by numerous option barriers, keeping buyers at bay for now.
As with any resistance area, repeated tests of the 1.3000 level increase the likelihood of an eventual breakout. However, considering the current setup and the upcoming UK inflation data, there is potential for a deeper retracement toward the 1.2900 mark.
Tomorrow’s UK inflation data could be crucial for cable’s next move, especially as the RSI remains in overbought territory.
Support
- 1.2950
- 1.2900
- 1.2850
Resistance
- 1.3000
- 1.3090
- 1.3250
GBP/USD Daily Chart, July 16, 2024
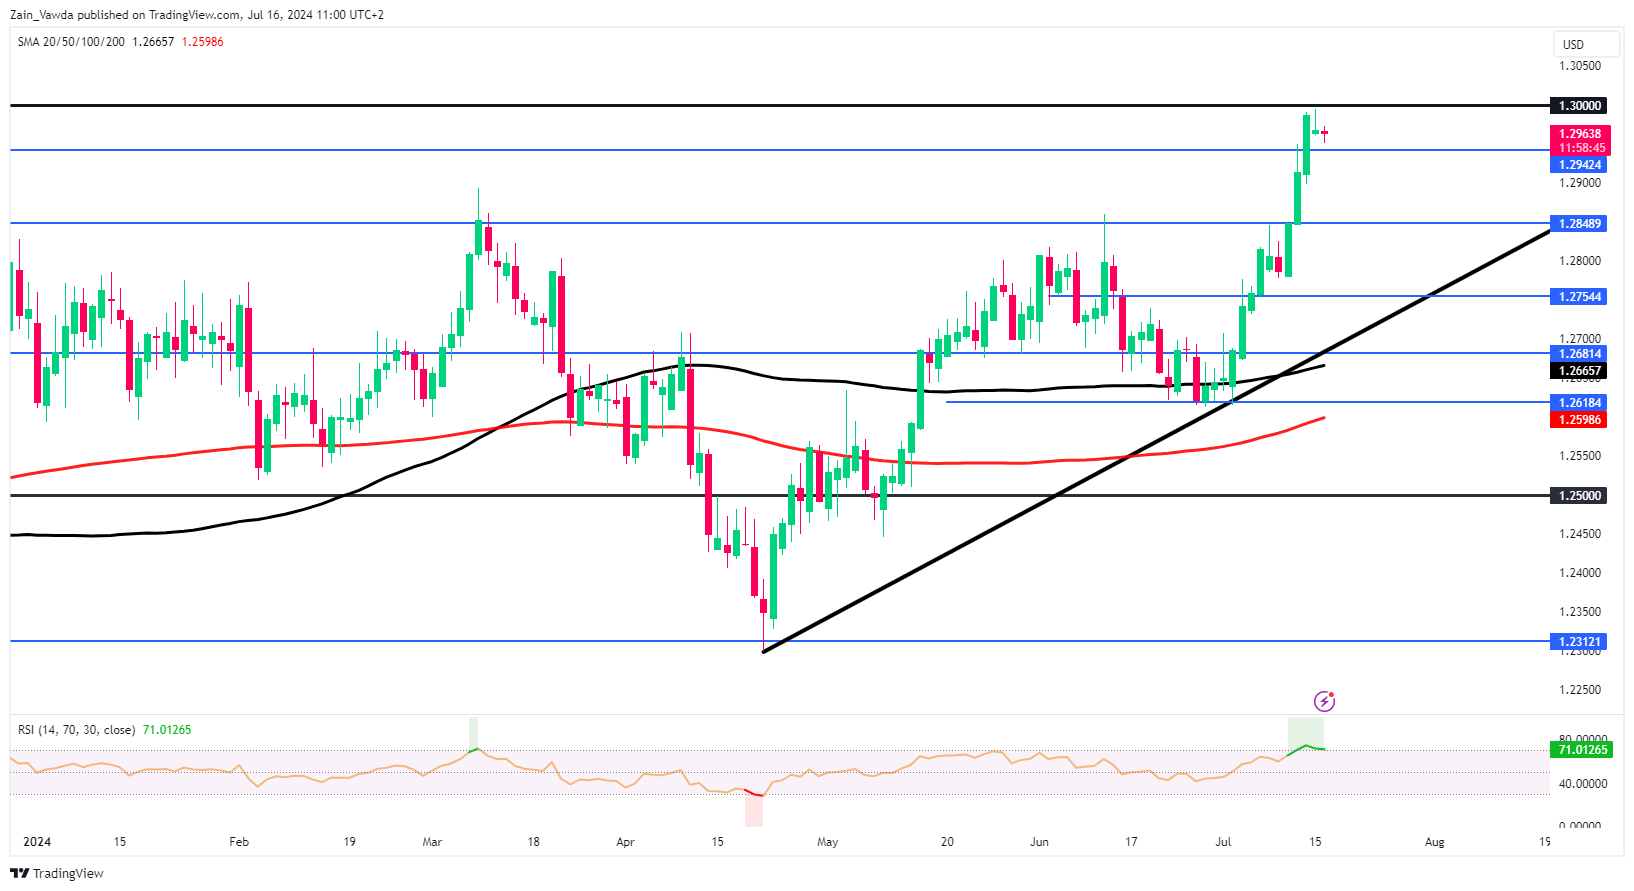
Source: TradingView.com (click to enlarge)