Sample Category Title
ECB’s Simkus: Interest rates are getting lower, quite significantly
ECB Governing Council member Gediminas Simkus shared his views with reporters today, indicating that his outlook aligns with current market expectations, which anticipate two rate cuts this year.
Simkus commented, "Interest rates are getting lower and, I think, will keep getting lower, and quite significantly."
USDCAD Advances Within Trading Range
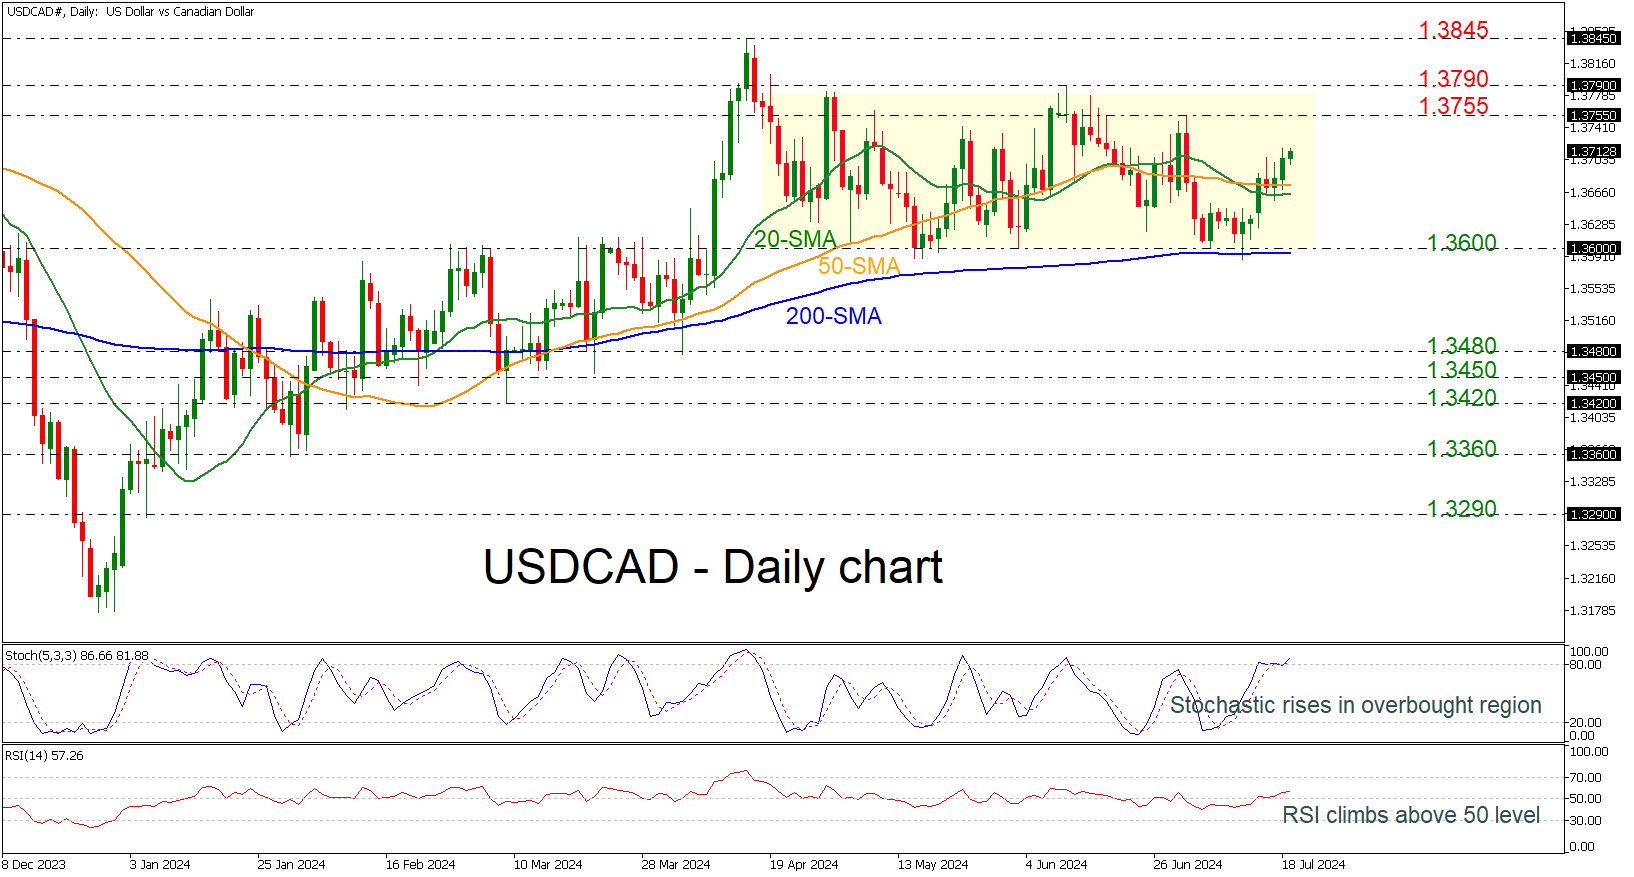
- USDCAD bounces off 1.3600 and 200-day SMA
- Momentum oscillators suggest more gains
USDCAD has been still developing within a trading range of 1.3600 and 1.3790 since April 17, with strong support at the 200-day simple moving average (SMA). The recent rebound from 1.3600 reflects the oscillators' strengthening momentum.
According to technical oscillators, the stochastic oscillator is pointing upward in the overbought region, while the RSI is rising, crossing above the neutral threshold of 50.
More upside pressures could find resistance first at 1.3755, ahead of the upper boundary of the consolidation area at 1.3790. A break above this area could pave the way for further increases until the 1.3845 barrier, taken from the high of April 16.
Alternatively, a dive beneath the short-term SMAs could take the market towards the tough obstacle of 1.3600, which overlaps with the 200-day SMA. A successful tumble below these lines could endorse the negative scenario, meeting 1.3480.
Summarizing, USDCAD is moving sideways, and only moves above 1.3790 or below 1.3600 could show the next direction.
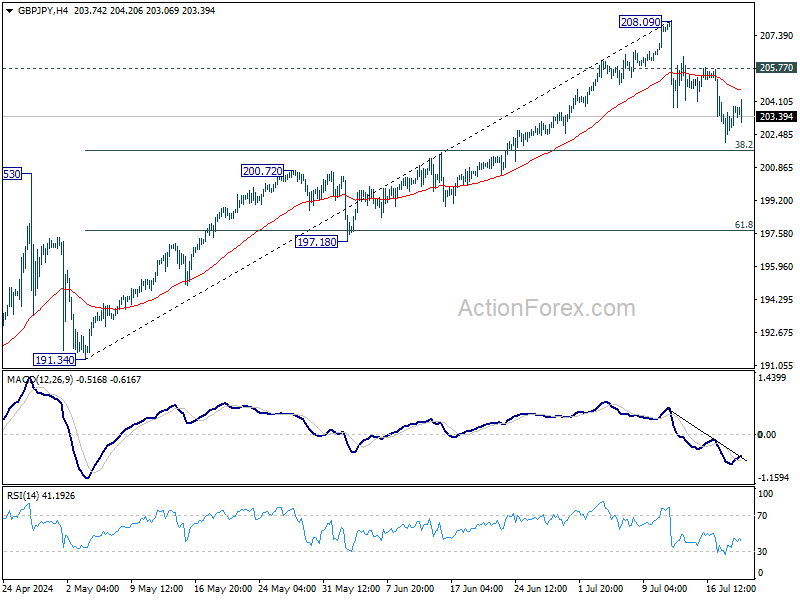
GBPJPY Retraces Lower After Hitting 16-year High
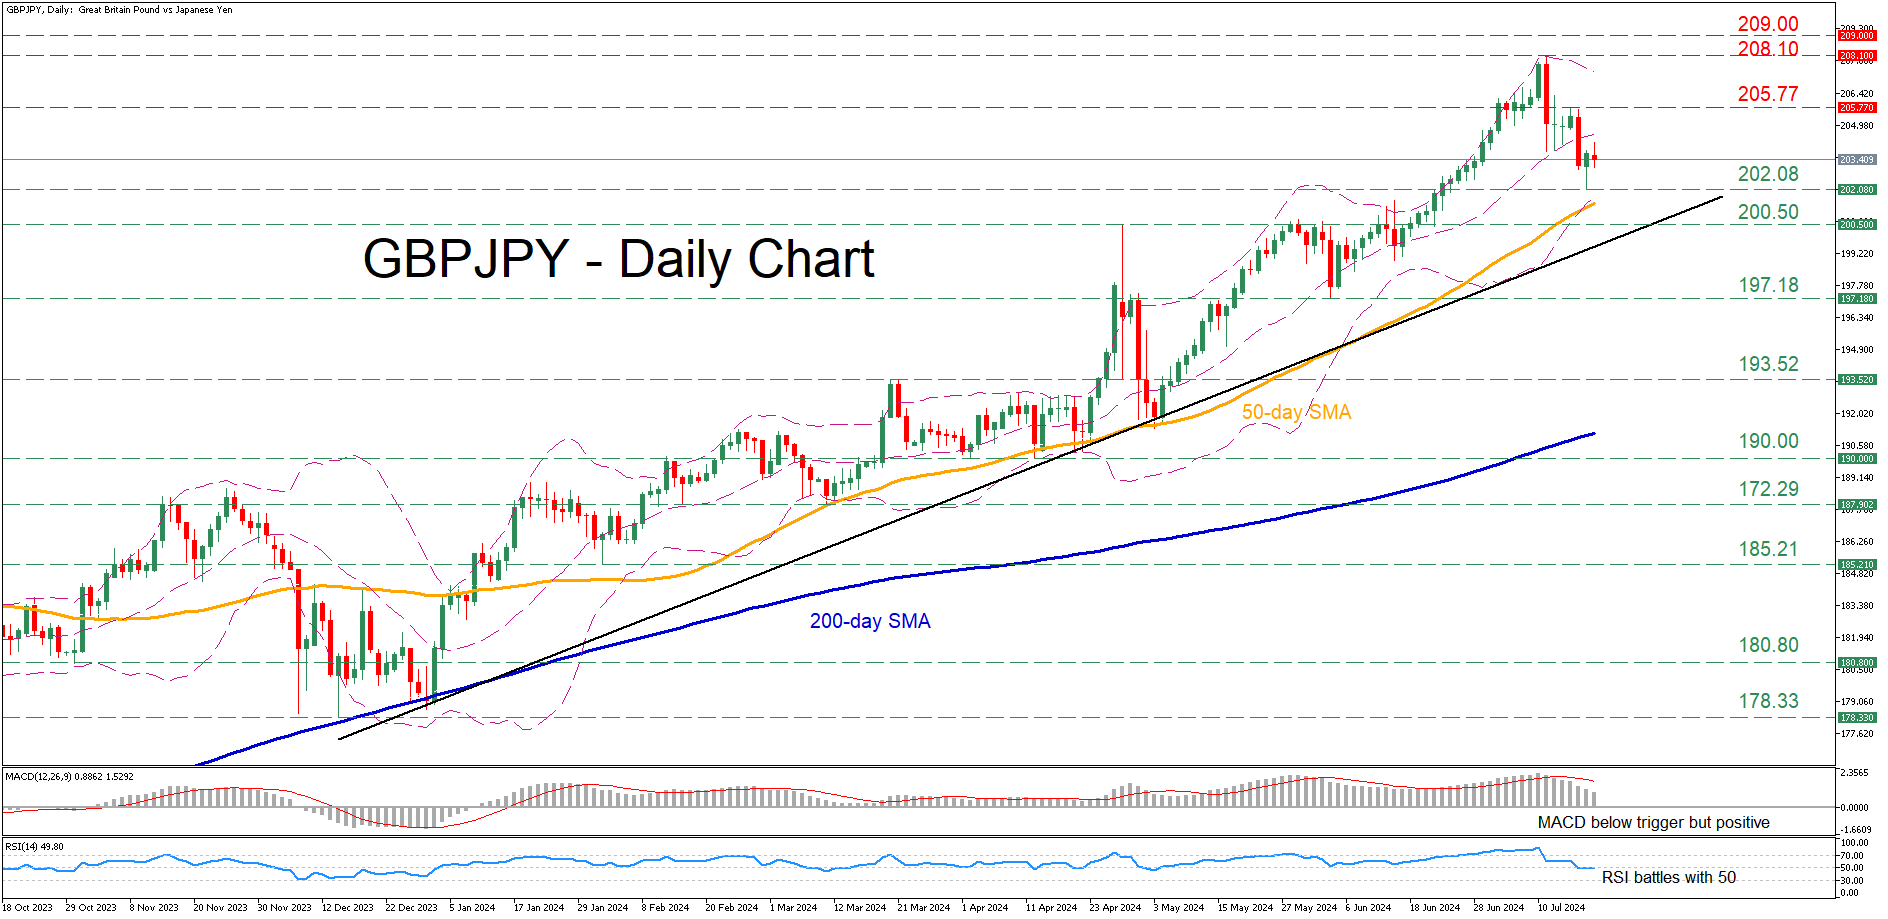
- GBPJPY pulls back from its highest level since August 2008
- RSI and MACD ease but remain in positive territories
GBPJPY has been in a prolonged uptrend since early 2024, posting a 16-year high of 208.10 on July 11. However, the pair has been undergoing a pullback since then probably due to the advance reaching overbought conditions.
Should the slide extend further, the recent support of 202.08 could act as the first line of defense. Piecing through that floor, the pair could decline towards its April high of 200.50, which also acted both as support and resistance in May and June. Further retreats might then cease at the June bottom of 197.18.
On the flipside, if the setback falters and the pair edges back higher, the bulls could initially attack 205.77 ahead of the 16-year peak of 208.10. A violation of that zone could open the door for fresh multi-year highs, where the April 2008 peak of 209.00 could curb further upside attempts.
In brief, GBPJPY has been experiencing a pullback in the past few sessions, but the momentum indicators have not turned negative yet. Nevertheless, a break below the 50-day simple moving average (SMA) could increase the bears’ appetite for a sustained correction.
ECB Not Confident that September Will Bring the Second Rate Ccut
TSM announced better-than-expected quarterly results and lifted its growth projections for this year’s revenue. Good news helped limiting the previous day selloff in chip stocks yesterday but couldn’t prevent the S&P500 and Nasdaq 100 from closing Thursday’s session with losses. The S&P500 fell 0.78% and Nasdaq 100 lost almost 0.50%. Nvidia rebounded more than 2.50% after the strong TSM results revived the AI optimism despite the growing worries of worsening chip war between the US and China. But TSM shares fell 2% in the Taiwan Stock Exchange today. Besides the sharp selloff triggered by Biden’s threat on China chip exports, the euphoria around the AI stocks diminished as Goldman Sachs warned that the biggest US tech firms may be spending too much on AI without a guarantee of seeing their investment bear fruit in a sufficiently satisfactory timeline. The rising odds of a Trump presidency is not necessarily positive for TSM, either, as he looked barely willing to defend Taiwan in case of a Chinese aggression. Moreover, a Trump and Vance duo in the White House is good for technology stocks – but the small one of them, and should not necessarily benefit to the Big Tech.
Unbearable
Biden is under an unbearable pressure to leave the presidential race because he is too old. Many Democratic heavy weights are now turning their back against the President. Even Barrack Obama said he should consider stepping down. And there are rumours that he could throw in the towel as early as this weekend. If that happens, we could see the Trump trade gain further momentum. That would benefit to Bitcoin, equities – especially the small and domestically focused ones - and cause a yield curve steepening with the long-end of the US treasuries feeling the heat of exploding debt
Some ask how long this Trump trade will last. The answer is a few weeks, maybe a few months, time to give the non-tech pockets of the market to catch their breath and the tech to correct following a breathtaking year-and-a-half rally. But in fine, factors like the Federal Reserve (Fed) and other central banks’ policy decisions, the international trade tensions, the global growth prospects, China, climate and idiosyncratic factors like AI should say the last word on the overall direction of the global stock markets.
Global picture
For now, the reflation trade favours the cyclical sectors (oil and finance) and small caps in the US, and a shift toward the European equities. Alas, European stocks kicked off the earnings season on a meagre note with weak results from luxury and airline sectors. It’s early to predict where the earnings season will go for the European companies. The European Central Bank’s (ECB) first rate cut should have lifted sentiment for many companies in Q2, but analysts have been revising down their earnings expectations since a few weeks.
Moving forward, the ECB is not confident that September will bring the second rate cut, and they don’t want the market to think that there will be a 25bp rate cut to be pulled out from their hat at the end of the summer. The ECB Chief Christine Lagarde said in her press conference yesterday that options for the September meeting remain wide open, but the decision will depend on data. Yet, the EURUSD sank below the 1.09 level as if she had given a stronger signal for a September cut. And that’s a risk given that if the rate cut expectations go ahead of themselves – and that’s what seems to be happening on both sides of the Atlantic Ocean – an eventual retreat in these expectations to match a reasonable level could hit sentiment and risk appetite.
What could cause that? Well, the PPI numbers last month came in higher than expected in the US. I see more reports highlighting the rising shipping costs due to the mess in the Middle East and the Red Sea. The freight costs and insurance bills reportedly exploded by 300% since past year. Shipping costs stand for only around 3% of the overall price pressures – had said Lagarde in one of her previous speeches - but combined with the risk of higher tariffs and worsening global trade prospects make the end picture quite uncertain. So yes, the Stoxx 600 is assumed to be a good choice for the reflation trade and could extend gains. But I am not sure that the early earnings (and political uncertainties) justify a move toward fresh ATH.
A waning appetite for European equities could spread butter on the bread of US equities, but for the major US indices to continue to outperform as they did since last year, the projected sector rotation that could hit the tech shouldn’t hit them too much. Because the other sectors could hardly make up the kind of losses that we saw earlier this week in Big Tech.
Earnings, earnings
Netflix added more than 8 million subscribers in Q2, beating its own forecasts and widening gap with its rivals. Yet, shares slipped in the afterhours trading after the Q3 sales forecast missed estimates, then rebounded. At the end of the day, Netflix shares didn’t move in the afterhours trading. A rotation from tech to non tech as a result of Trump and softer Fed expectations could weigh on Netflix in the coming weeks and pull the stock price lower from near ATH levels. But happily for Netflix, it’s got a limited exposure to AI, and may better weather a potential AI selloff than its major peers like Nvidia, Apple or Google.
ECB’s Villeroy: Market rate cut expectations “rather reasonable”
ECB Governing Council member Francois Villeroy de Galhau spoke on French radio BFM Business today, expressing that current market expectations for interest rate cuts seem "rather reasonable."
Markets are currently pricing in nearly two ECB rate cuts for the remainder of the year, likely occurring in September and December, with around five cuts anticipated by the end of next year.
Villeroy de Galhau affirmed ECB's stance on inflation, stating, "Overall, we are 'on track' with our inflation target and forecast of 2% next year." He further emphasized the commitment to this target, noting, "Barring any shocks, this is more than a forecast, it's a commitment."
Market Analysis: Gold Price and Crude Oil Price Correct Recent Gains
Gold price started a downside correction from $2,485. Crude oil prices are also moving lower from the $82.20 resistance zone.
Important Takeaways for Gold and Oil Prices Analysis Today
- Gold price climbed higher toward the $2,485 zone before there was a pullback against the US Dollar.
- A key bearish trend line is forming with resistance near $2,450 on the hourly chart of gold at FXOpen.
- Crude oil prices extended downsides below the $81.30 support zone.
- A major contracting triangle is forming with resistance near $80.70 on the hourly chart of XTI/USD at FXOpen.
Gold Price Technical Analysis
On the hourly chart of Gold at FXOpen, the price rallied heavily above the $2,425 resistance. The price even spiked above $2,480 before the bears appeared.
A high was formed near $2,483 before there was a downside correction. There was a move below the $2,465 support level. The bears even pushed the price below the $2,450 support and the 50-hour simple moving average.
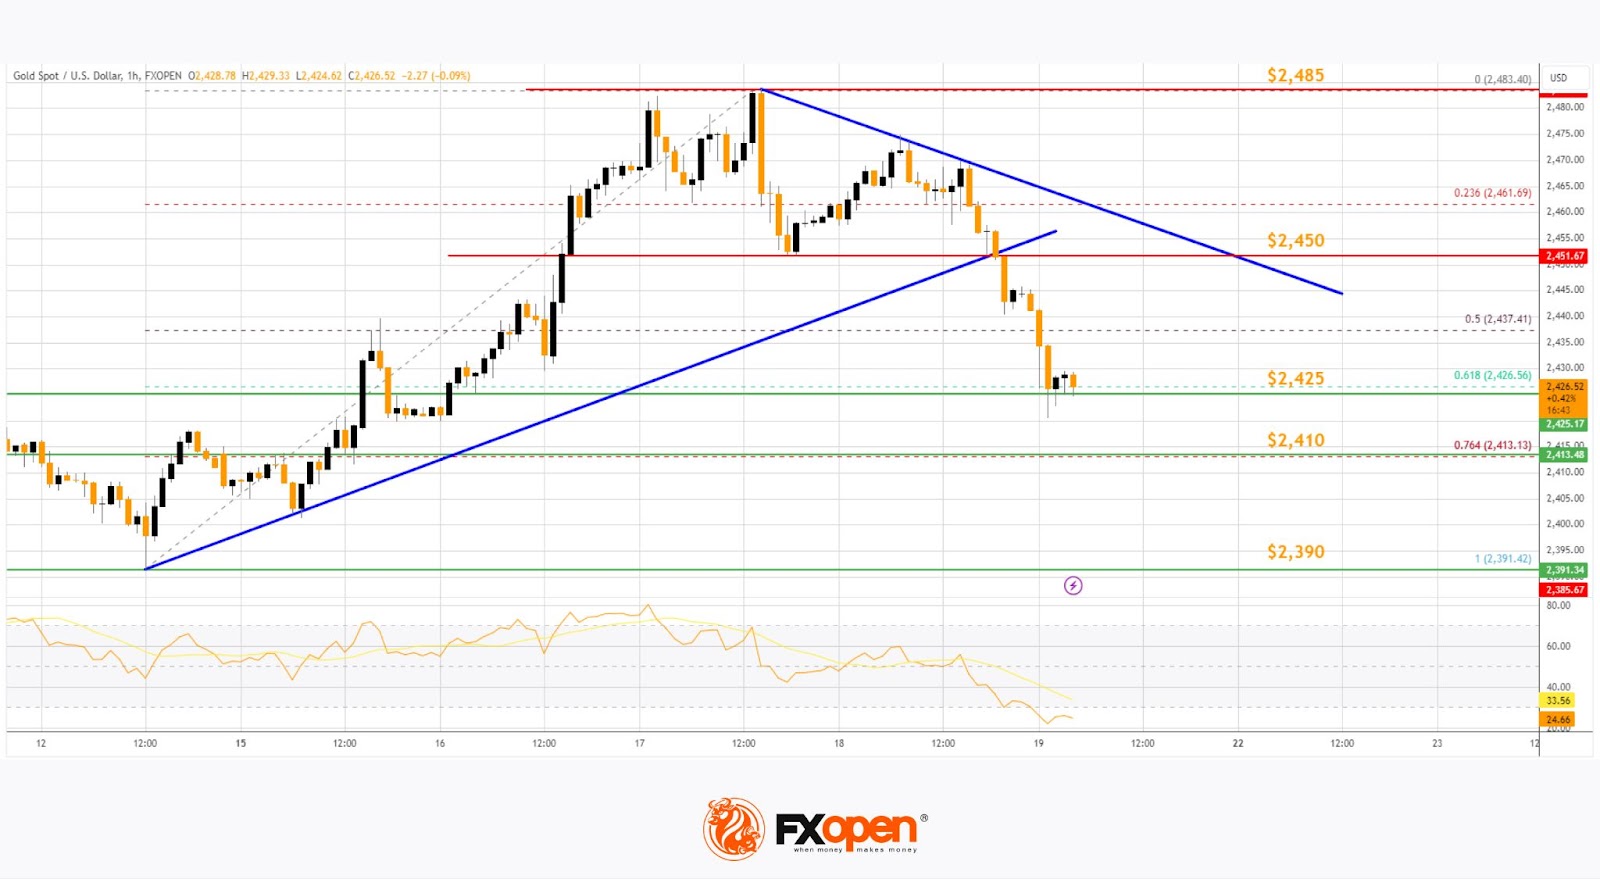
The price declined below the 50% Fib retracement level of the upward move from the $2,391 swing low to the $2,483 high. If the bears remain in action, the price might decline further.
Initial support on the downside is near the $2,425 level. It is near the 61.8% Fib retracement level of the upward move from the $2,391 swing low to the $2,483 high. The first major support is near the $2,410 level.
If there is a downside break below the $2,410 support, the price might decline further. In the stated case, the price might drop toward the $2,390 support.
On the upside, there is a key bearish trend line forming with resistance near $2,450 and the 50-hour simple moving average. The next major resistance is near the $2,485 level. The main resistance could be $2,500, above which the price could test the $2,520 resistance. The next major resistance is $2,550.
An upside break above the $2,550 resistance could send Gold price toward $2,580. Any more gains may perhaps set the pace for an increase toward the $2,600 level.
Oil Price Technical Analysis
On the hourly chart of WTI Crude Oil at FXOpen, the price struggled to continue higher above $82.20 against the US Dollar. The price formed a short-term top and started a fresh decline below $81.30.
The bears even pushed the price below $80.70 and the 50-hour simple moving average. The price even declined below the 50% Fib retracement level of the upward move from the $79.25 swing low to the $82.18 high.
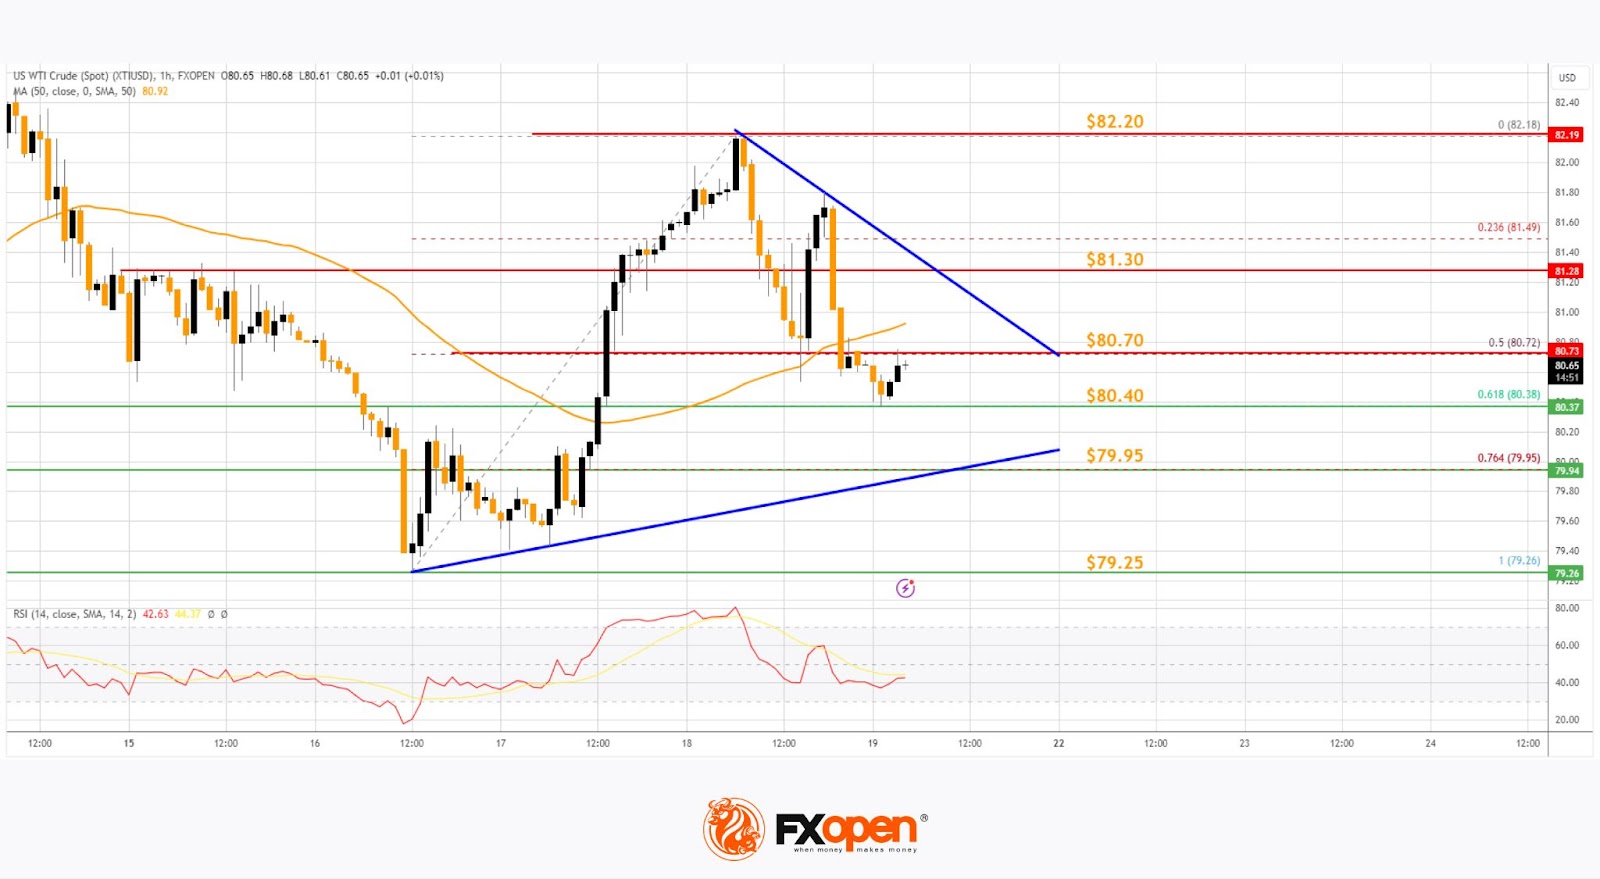
The price tested the $80.40 support zone and the 61.8% Fib retracement level of the upward move from the $79.25 swing low to the $82.18 high.
Immediate support is near the $80.40 level. The next major support on the WTI crude oil chart is near $79.95. If there is a downside break, the price might decline toward $79.25. Any more losses may perhaps open the doors for a move toward the $78.00 support zone.
On the upside, immediate resistance is near a major contracting triangle at $80.70 and the 50-hour simple moving average. The next resistance is near the $81.30 level.
The main resistance is near a trend line at $82.20. A clear move above the $82.20 zone could send the price toward $82.50. The next key resistance is near $83.20. If the price climbs further higher, it could face resistance near $84.50. Any more gains might send the price toward the $85.00 level.
Start trading commodity CFDs with tight spreads. Open your trading account now or learn more about trading commodity CFDs with FXOpen.
This article represents the opinion of the Companies operating under the FXOpen brand only. It is not to be construed as an offer, solicitation, or recommendation with respect to products and services provided by the Companies operating under the FXOpen brand, nor is it to be considered financial advice.
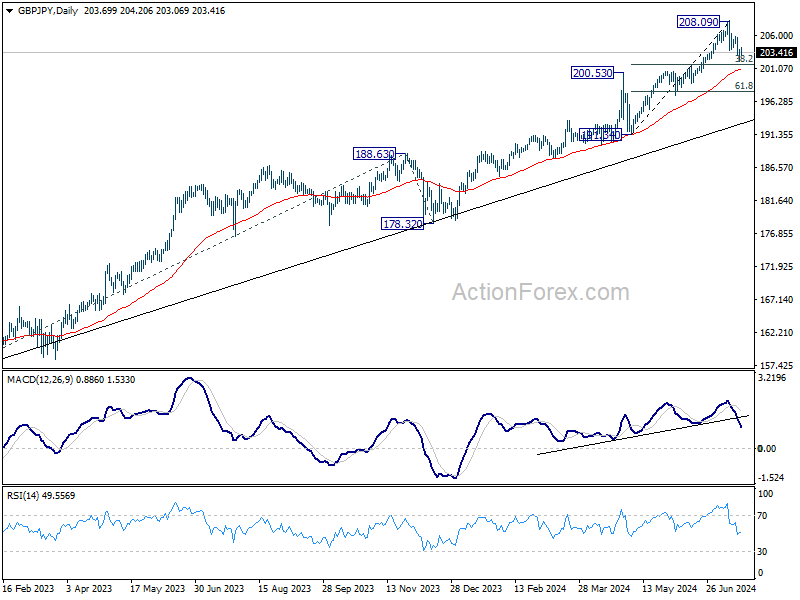
GBP/JPY Daily Outlook
Daily Pivots: (S1) 202.57; (P) 203.22; (R1) 204.341; More...
Intraday bias in GBP/JPY is turned neutral with 4H MACD crossed above signal line. Strong support could be seen from 38.2% retracement of 191.34 to 208.09 at 201.69 to bring rebound. On the upside, above 205.77 minor resistance will turn intraday bias will turn bias back to the upside for retesting 208.09. However, sustained break of 201.69 will argue that larger correction is already underway.
In the bigger picture, long term up trend is still in progress. Next target is 100% projection of 155.33 to 188.63 from 178.32 at 211.62. Outlook will stay bullish as long as 200.72 resistance turned support holds, even in case of deep pullback.
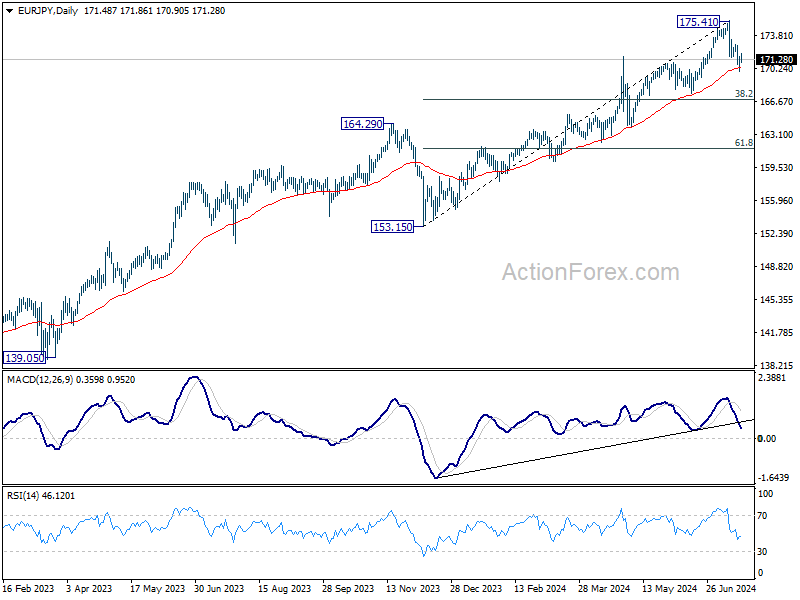
EUR/JPY Daily Outlook
Daily Pivots: (S1) 170.43; (P) 171.01; (R1) 172.02; More...
EUR/JPY recovered after dipping to 169.98 and intraday bias is turned neutral first. Further fall is in favor as long as 172.91 resistance holds. Sustained trading below 55 D EMA (now at 170.30) will target 38.2% retracement of 153.15 to 175.41 at 166.90, as a correction to whole rise from 153.15. On the upside, though, break of 172.91 resistance will revive near term bullishness and bring retest of 175.41 high.
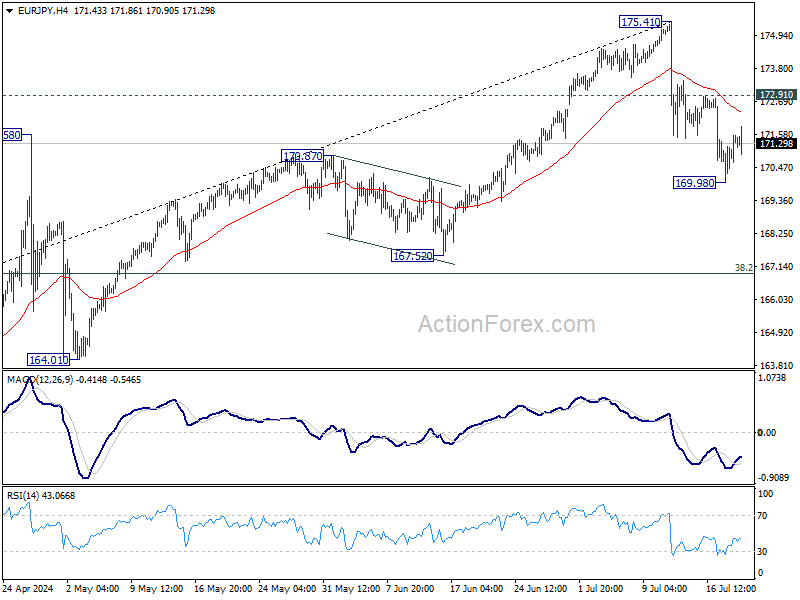
In the bigger picture, medium term outlook will stay bullish as long as 164.29 resistance turned support holds. Long term up trend is still in favor to continue through 175.41 at a later stage. However, firm break of 164.29 will be a strong sign of bearish trend reversal.
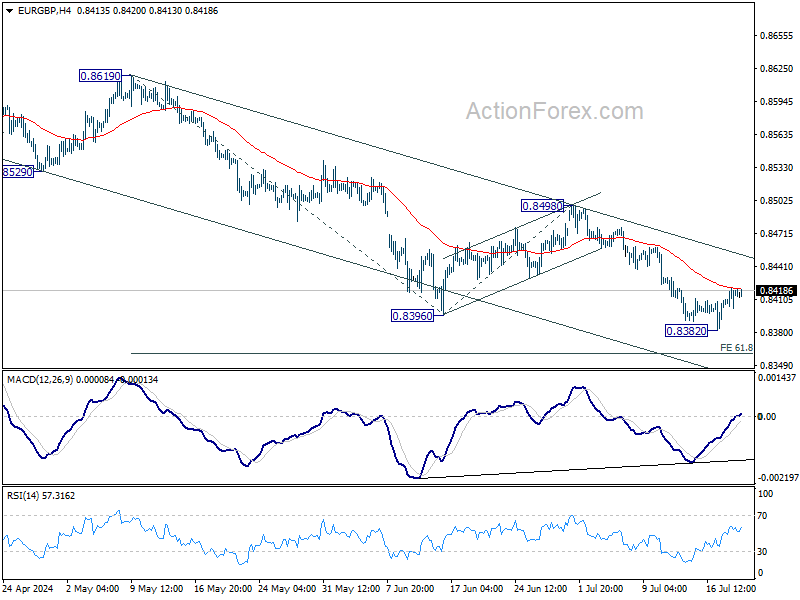
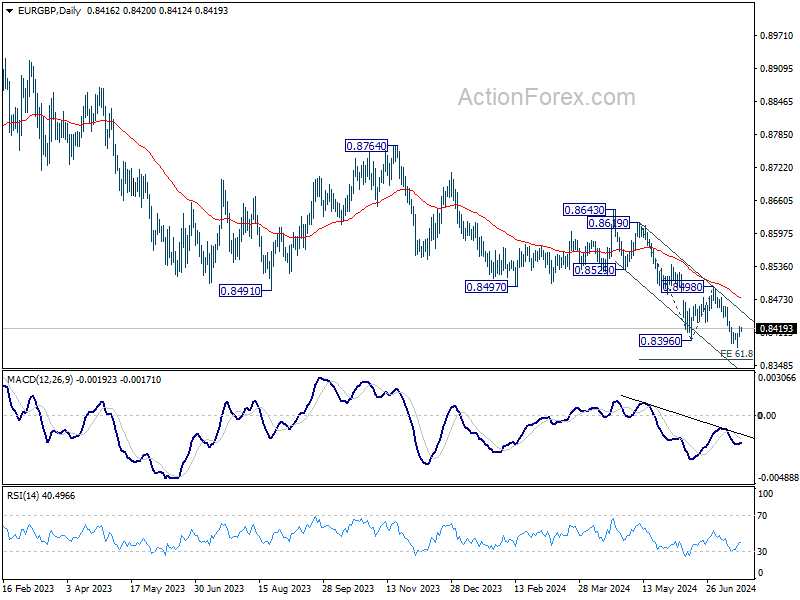
EUR/GBP Daily Outlook
Daily Pivots: (S1) 0.8407; (P) 0.8414; (R1) 0.8426; More....
Intraday bias in EUR/GBP remains neutral for the moment and more consolidations could be seen above 0.8382. Further decline is in favor. But considering bullish convergence condition in 4H MACD, downside could be contained by 61.8% projection of 0.8619 to 0.8396 from 0.8498 at 0.8360 on first attempt. On the upside, break of 55 4H EMA (now at 0.8420) will turn bias back to the upside for stronger rebound.
In the bigger picture, down trend from 0.9267 (2022 high) is in progress. Next target is 0.8201 key support (2022 low). For now, outlook will remain bearish as long as 0.8643 resistance holds, even in case of stronger rebound.
EUR/AUD Daily Outlook
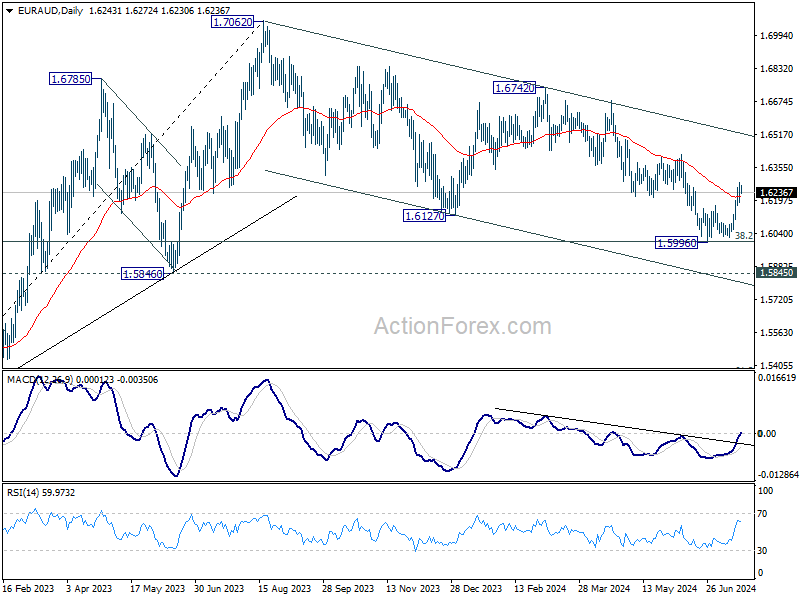
Daily Pivots: (S1) 1.6195; (P) 1.6240; (R1) 1.6291; More...
EUR/AUD's rebound from 1.5996 lost momentum after hitting 1.6282. Intraday bias is turned neutral first. Further rise is in favor as long as 1.6171 minor support holds. Correction from 1.7062 might have completed with three waves down to 1.5996, after hitting 1.6000 fibonacci support. Above 1.6282 will target 1.6418 resistance next. However, break of 1.6171 will dampen this bullish case and bring retest of 1.5996 instead.
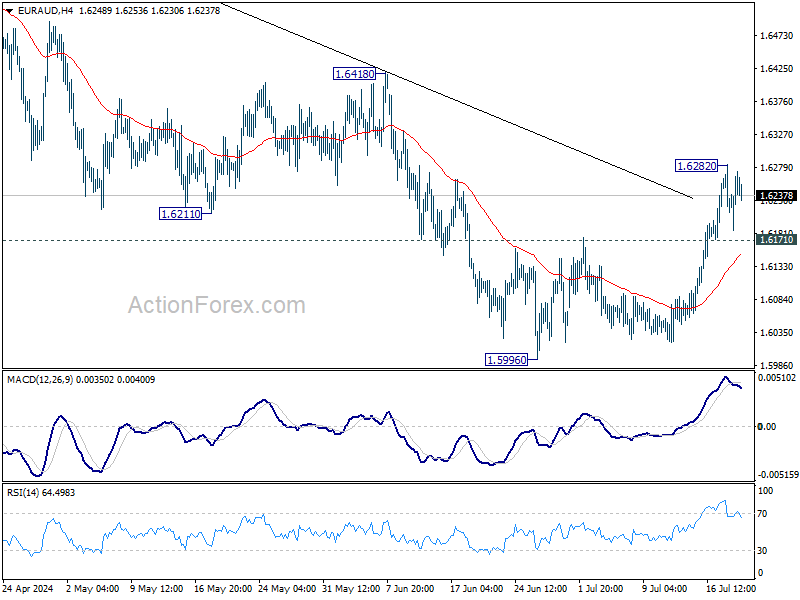
In the bigger picture, fall from 1.7062 medium term top is seen as a correction to the up trend from 1.4281 (2022 low) only. Strong support is still expected between 1.5846 and 38.2% retracement of 1.4281 to 1.7062 at 1.6000 to bring rebound. Break of 1.6418 resistance will argue that the correction has completed.