Sample Category Title
The Weekly Bottom Line: Nearing the Pivot Point
U.S. Highlights
- After an eerily calm few months, a fresh dose of volatility descended across global financial markets this week.
- Top Fed officials speaking this week noted that they are getting ‘closer’ to cutting interest rates. Financial markets have fully priced the first cut to come in September.
- Retail sales and industrial production data for June came in better than expected, while homebuilding remains under pressure.
Canadian Highlights
- Economic data was under the microscope this week, ahead of the Bank of Canada’s interest rate decision on July 24th. An interest rate cut is universally expected, with both business sentiment and retail sales pointing to weak demand in Canada’s economy, which should help ease inflation pressures going forward.
- However, if Governor Macklem opts to surprise markets with a hold, he will likely cite a lack of progress on core inflation metrics in recent months, driven by services inflation moving in the wrong direction recently.
U.S. – Nearing the Pivot Point
After an eerily calm few months, this week brought a fresh dose of volatility across global financial markets. The equity selloff was heavily concentrated across the tech sector, following some speculation that the Biden administration is considering implementing new rules to clamp down on companies exporting chipmaking equipment to China. While the selloff widened as the week progressed, small-cap stocks still managed to end the week 2% higher and are up 8% over the past nine trading days. The S&P 500 is down nearly 0.5% over that same period. The recent outperformance has largely been driven by market participants becoming increasingly confident that the Fed will begin easing its policy stance over the coming months. At the time of writing, market odds are fully priced for the first cut to come in September, with 63 bps of easing expected by year-end.
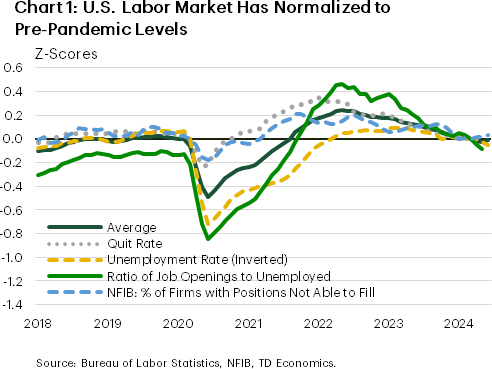
Based on how recent data has trended, investors have good reason to suspect that the Fed will likely begin dialing back its policy rate come September. Last week’s CPI report showed inflationary pressures cooling faster than expected, while recent readings of the labor market suggest that nearly all the pandemic imbalances have been restored (Chart 1). Speaking at an event at the Washington Economic Club this week, Powell reiterated the point on the labor market, citing “… essentially we’re back at equilibrium”. On inflation, Powell noted that recent readings have “added somewhat to confidence”. Other Fed officials including Williams and Waller echoed Powell’s sentiment this week, noting that the improved inflation trajectory has brought the Fed “closer” to cutting interest rates and that the current economic data are consistent with the Fed achieving a ‘soft landing’.
Indeed, economic data out this week support the notion that while the economy is slowing, it’s not falling off a cliff. Retail sales were flat in June, but that was largely related to a sharp pullback in auto sales due to a cyber attack on a software firm that supports car dealers across the country. Meanwhile, the control retail group – used in the BEA’s calculation of PCE – rose by a healthy 0.9% m/m, while revisions to prior months showed a stronger pace of consumer spending in April/May. Consumer spending is tracking around 2% annualized for Q2, a touch higher than Q1’s 1.5% but handily below the +3% pace averaged through the second half of last year.
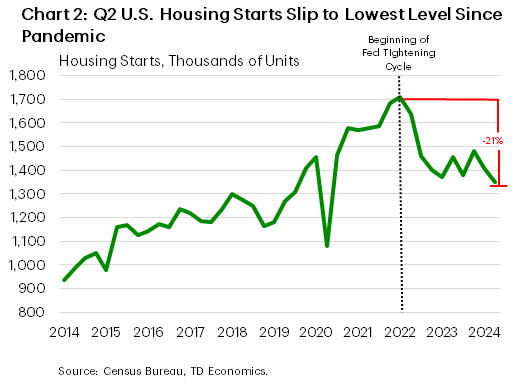
Meanwhile, industrial production data for June rose by a respectable 0.6% m/m and recorded its largest quarterly gain since Q2-2021. Encouragingly, the manufacturing index has now posted gains in four of the last five months and is closing in on levels not seen since the Federal Reserve first started hiking interest rates back in March 2022. Conversely, home building activity continues to feel the pinch of higher rates, with Q2 housing starts slipping to a new post-Fed tightening low (Chart 2).
All told, it’s becoming increasingly clear the U.S. economy is downshifting from last year’s breakneck rate of expansion to something closer to a trend-like pace. Provided the next two inflation readings don’t show any meaningful reversal in recent trends, the Fed likely has a clear path to start cutting rates in the coming months.
Canada – Will the BoC Focus on the Fly or the Ointment?
This week’s economic data was under the microscope coming ahead of the Bank of Canada (BoC) interest rate announcement and updated Monetary Policy Report on July 24th. Canada’s inflation data garnered the highest scrutiny, and it came in lower than consensus expectations with a 2.7% reading – the slowest pace in more than three years. This reading cemented market bets for a quarter-point interest rate cut next week. We agree that is the most likely outcome, however, a renewed uptick in services inflation could spook the BoC into holding rates steady.
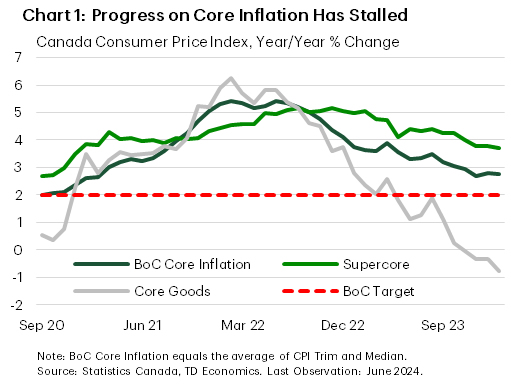
Scratching beneath the surface on CPI inflation, there is one fly in the ointment. The BoC’s preferred core inflation measure didn’t make any progress in June, stuck at 2.8% year-on-year (y/y) on average (Chart 1). Narrowing in on the most recent three months, core inflation pressures picked up from 2.5% in May to 2.9% in June. If the Bank of Canada opts to surprise markets next week and take a pause on rate cuts, this will likely be the reason that they cite.
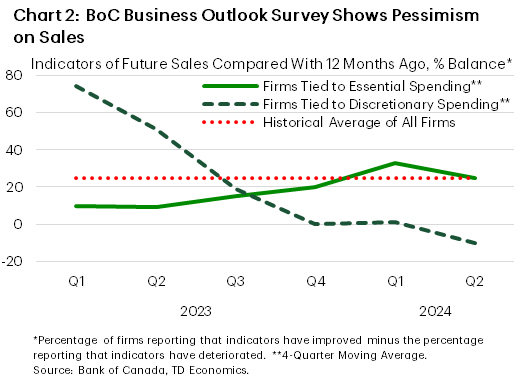
It will come down to how much weight the Bank of Canada puts on this particular fly. Other activity and sentiment indicators are sending very clear signals that the Canadian economy is bending under the weight of higher rates. The BoC’s Business Outlook Survey for the second quarter was one such sign. The survey described business sentiment as low, and the main factors businesses mentioned were weighing on sentiment were: elevated interest rates, weak demand for non-essential goods and services, and ongoing high costs. Businesses expectations for future sales also remained historically low, and those tied to discretionary consumer spending are particularly weak (Chart 2). Businesses also expect growth in their selling prices to continue easing, which is good news for future progress on the Bank’s inflation target.
May retail sales were another sign that the consumer is also weakening. Sales were down more than expected on the month, with eight of nine industry categories and nine of ten provinces seeing sales fall. Sales were also down 0.7% month/month (m/m) in real terms. The one area to gain ground was motor vehicle and parts dealers (+0.8% m/m), led by an increase at new car dealers. Apart from that, there were no other silver linings in May retail sales. Even the advance retail indicator is pointing to another decline in sales for June.
Now it is over to the BoC’s announcement, which will also update the bank’s economic forecast. Since the last update in April, inflation has fallen slightly faster than the Bank had expected, and growth has been weaker. What we don’t know is how many rate cuts the Bank had assumed within that view. But whatever it was, there is a strong argument for a bit more easing now. The fact that the U.S. Federal Reserve is also looking like they could cut a bit earlier than was thought a few months ago helps the case for a BoC cut. That reduces any BoC worries about spreads widening too much and weakening the Canadian dollar, which would complicate their job reining in inflation.
Weekly Economic & Financial Commentary: A String of Upside Surprises, but Growth is Slowing in the U.S.
Summary
United States: A String of Upside Surprises, but Growth is Slowing in the U.S.
- Retail sales, housing starts and industrial production all surprised to the upside this week. Yet, an uptick in initial jobless claims was a reminder that conditions in the labor market are cooling, which sets the U.S. economy on a path of slower growth in the second half of the year.
- Next week: Existing & New Home Sales (Tues. and Wed.), GDP (Thurs.), Personal Income and Spending (Fri.)
International: China Is Now on Pace To Miss Its Annual Growth Target
- This week, GDP data downshifted and pricing pressures subdued in China, reflecting sluggish activity; against this backdrop, we continue to expect that the People's Bank of China (PBoC) will ease monetary policy during the rest of 2024 and throughout 2025.
- Next week: Central Bank of Turkey Policy Rate (Tues.), Bank of Canada Policy Rate (Wed.), Eurozone PMIs (Wed.)
Interest Rate Watch: Treasury Yields: Along for the Ride
- Through the first half of the year, the incoming data have whipsawed economists, and financial markets have come along for the ride. The see-sawing in Treasury yields over the first half of the year has been all the more notable as the policy rate has remained unchanged; the repricing has been primarily driven by expectations for future policy adjustments.
Topic of the Week: Fear Not, the Consumer IS Downshifting
- Retail sales data released this week surprised to the upside. Coming on the heels of last week's news that revolving consumer credit shot up in the latest monthly data, one might reasonably wonder if the consumer is showing fresh resilience. We provide some context to demonstrate that is not, in fact, the case.
Week Ahead – Flash PMIs, US GDP and BoC Decision on Tap
- US data awaited amid overly dovish Fed rate cut bets
- July PMIs to reveal how economies entered H2
- BoC decides on monetary policy, may cut rates again
Will investors add to their Fed rate cut bets?
With investors ramping up their Fed rate cut bets, the US dollar suffered during the first half of the week, although it recovered some ground on Thursday. Following the softer-than-expected CPI data last week, several Fed officials, including Chair Powell, noted the data are bolstering their confidence that price pressures are on a sustainable path to remain low. Powell also said that they will not wait until inflation hits 2% to cut interest rates.
Coming on top of the employment report for June, which revealed further softness in the labor market, the aforementioned developments prompted market participants to fully price in a September rate cut and to assign a decent 50% chance for a third reduction this year, with such a move being fully factored in for January.
Those bets will come to a test next Thursday, when the first estimate of the US GDP will be released, but also on Friday, when the core PCE index is coming out, alongside the personal income and spending data.
The Atlanta Fed GDPNow model suggests that the economy accelerated to 2.4% q/q SAAR from 1.4% in Q1, while the New York Nowcast points to a more modest acceleration to 1.8%. In any case, both models suggest that the risks may be to the upside. However, the slowdown in the core CPI for June suggests a similar reaction in the core PCE index for the month, something that may not allow traders to significantly raise their implied path, even if the GDP surprises to the upside.
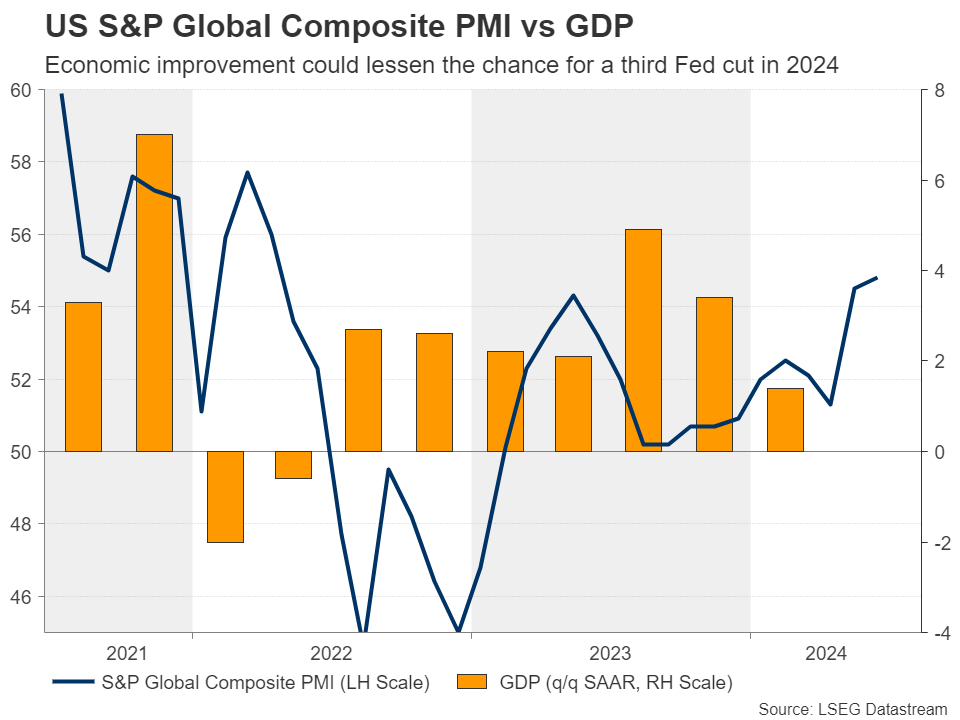
Having said that though, the picture could very well be altered ahead of these releases, on Wednesday, when the preliminary PMIs for July are due to be released. If the PMIs, which constitute more up to date information, reveal further economic improvement, as well as some stickiness in the prices charged by firms, investors may very well have second thoughts regarding a third rate cut by the turn of the year. Something like that may allow the US dollar to recover some of its losses on Wednesday and perhaps extend the recovery on Thursday if the GDP numbers are encouraging.
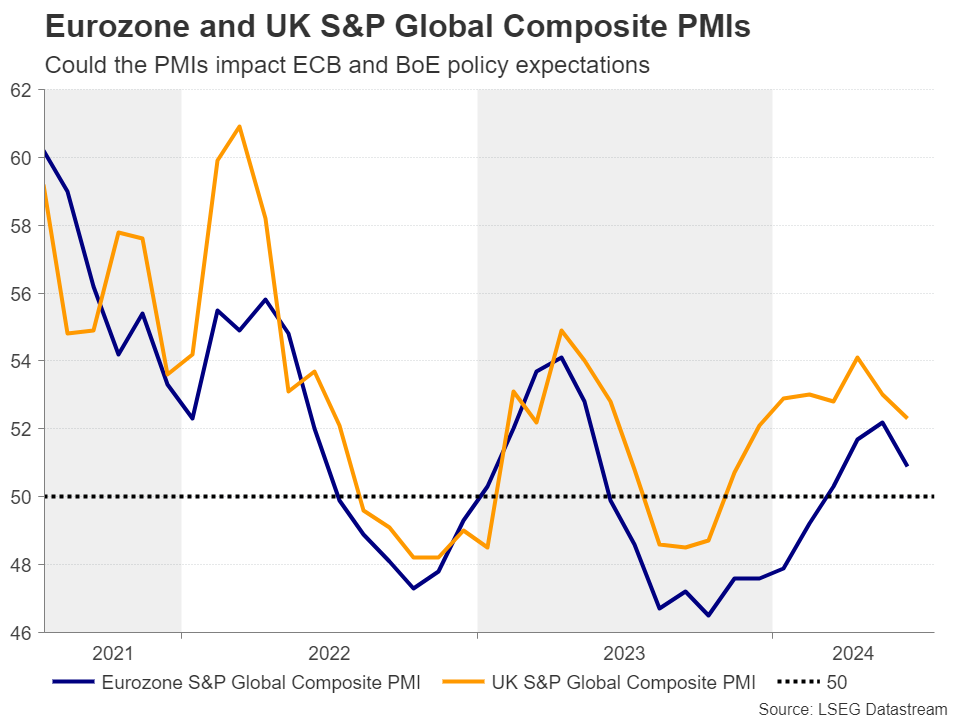
How could the PMIs impact ECB and BoE policy paths?
On Wednesday, the Eurozone and UK flash PMIs are also due to be released.
Getting the ball rolling with the Eurozone, at Thursday’s gathering, the ECB kept interest rates unchanged, with President Lagard saying at the press conference that a rate cut in September is “wide open.”
Investors kept the probability for such a move elevated at around 65%, keeping on the table a strong chance for another quarter-point reduction by the end of the year. The June PMIs revealed some softness, and it remains to be seen whether the July prints will paint a similar picture. If so, the probability for a September rate cut may increase, extending the latest correction in euro/dollar.
In the UK, the probability of a rate cut by the BoE in August slid to around 45% from around 60% in just a week, following remarks by BoE Chief Economist Huw Pill that services inflation and wage growth remain uncomfortably high, and after this week’s CPI data confirmed that services inflation remains extremely hot.
With all that in mind, if the PMIs reveal economic improvement and more stickiness in prices charged by firms, the probability for an August rate cut by the BoE may decline even more, thereby allowing the pound to gain, perhaps not so much against the dollar if the US data comes in strong, but against the euro, if the common currency feels the heat of the soft Euro area PMIs.
BoC to deliver a back-to-back rate cut
Later that same day, the Bank of Canada announces its monetary policy decision. At its latest gathering, this Bank cut interest rates by 25bps citing easing inflation and sluggish economic growth, with Governor Macklem noting that it would be “reasonable to expect further cuts” if inflation continues to cool.
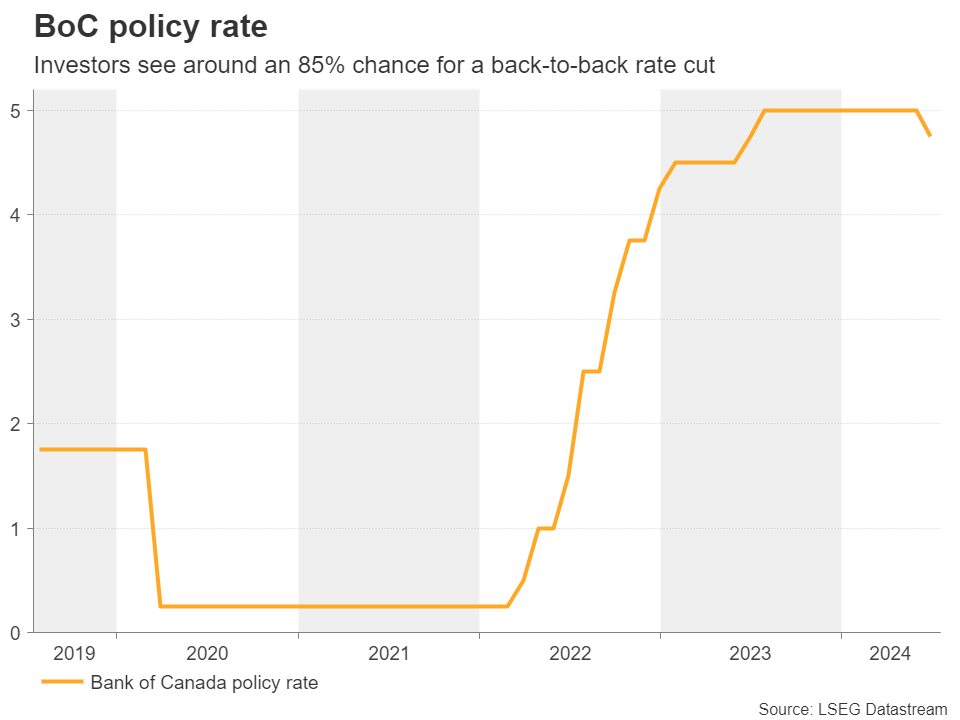
This week, the Canadian CPI numbers revealed that inflation eased further in June, bolstering the case for a back-to-back rate cut at next week’s meeting. Indeed, according to money markets, there is a nearly 85% chance for that to happen. Therefore, a rate cut on its own is unlikely to shake the Canadian dollar. Traders may quickly turn their attention to any hints on whether the easing cycle will continue in September as well. If they get enough dovish signals, the loonie is likely to suffer.
Elsewhere, during the Asian session on Friday, Japan’s Tokyo CPI data is due to be released. Those trying to figure out how likely a rate hike by the BoJ is this month may pay extra attention as the Tokyo prints are great gauges of the National CPI numbers.
Lastly, several tech-giants are reporting their earnings results. Microsoft, Alphabet and Tesla report on Tuesday, while on Thursday, it’s Amazon’s turn.
Another Cut from BoC Will Bring Benchmark Interest Rate to 4.5%
Softer inflation in Canada in June provided a small relief after an upside surprise in May, and set the Bank of Canada up for another 25-basis point interest rate cut on Wednesday to build on its first cut in June.
Similar to the June meeting, we think the central bank will highlight a weakening economic backdrop and broadly easing underlying inflation without providing additional guidance on the timing of future rate cuts. Risks are that there will be less easing bias, given the slightly choppier progress in recent consumer price index readings. The BoC’s preferred measures of “core” inflation have been edging higher on a three-month annualized basis since April, but a streak of lower prints earlier this year means the six-month annualized readings have still been trending lower.
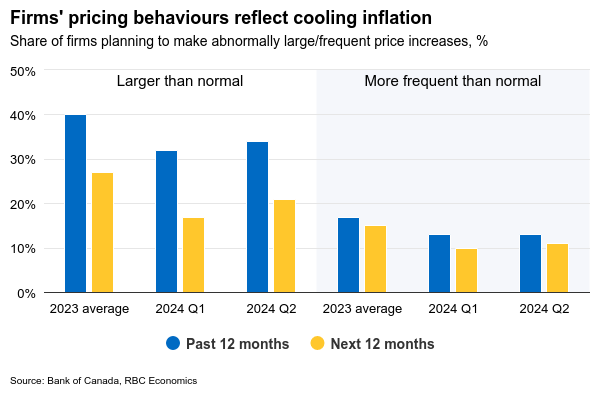
Looking ahead, indicators from the Q2 Business Outlook Survey are pointing to further unwinding in price pressures with fewer firms expecting larger or more frequent price increases in the next year. Business expectations for inflation and wage growth also continued to moderate with the latter in line with cooling labour market conditions as the unemployment rate creeps higher. Survey of Employment, Payrolls, and Hours (SEPH) data on Thursday should echo these trends. Wage growth from SEPH and the job vacancy rate in April have already normalized close to pre-pandemic levels. The hourly wage was up 3% from a year ago compared to 2.7% in pre-pandemic 2019, and the job vacancy rate was back at the 2019 average rate of 3.2%. We expect another decline in those measures in May.
Week ahead data watch
We expect U.S. GDP to have increased by 1.4% (annualized) in Q2/24, similar to growth in the first quarter. Much of that increase in Q2 was thanks to higher household consumption, offsetting a decline in residential investments as housing starts trended lower. Trade deficits likely widened in the same quarter, as rising exports were not enough to catch up with growth in imports.
We expect personal consumption to tick higher (+0.3%) in June, a bit higher than the 0.2% in May. Personal income likely grew by 0.3% in June, down from the 0.5% in the prior month and consistent with the slower wage growth we saw earlier in the payroll report.

Gold: Reversal or Typical Retreat?
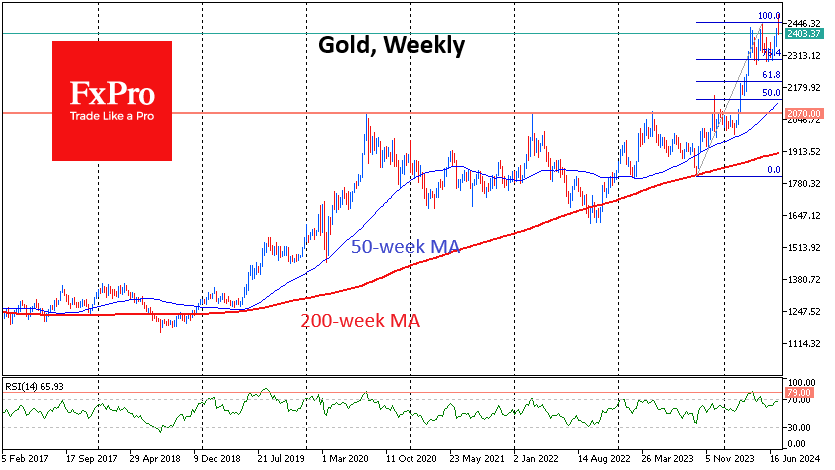
Gold made an impressive 3% surge during the week, breaking May’s all-time highs. However, it then retreated to the downside, selling off throughout the second half of the week. What should you watch out for to see if this is a reversal?
Pullbacks after making new highs have been a typical pattern for gold in recent months, with similar retreats in May, April, March, and December. The highs were followed by a pullback, which subsided within about two weeks, leading to a stabilisation of the price and a return to the upside.
However, bull markets do not last forever, and traders should look for signs that this bullish trend is reversing. We pay attention to the following warning signals.
A synchronised pull-out of risk assets: Along with gold, stock indices were also under pressure this week. After a long divergence, all four key indices (Nasdaq-100, S&P 500, Dow Jones 30, Russell 2000) were down on Thursday. The last all-time high for gold and the S&P500 came on 17 June, also indicating a synchronised reversal.
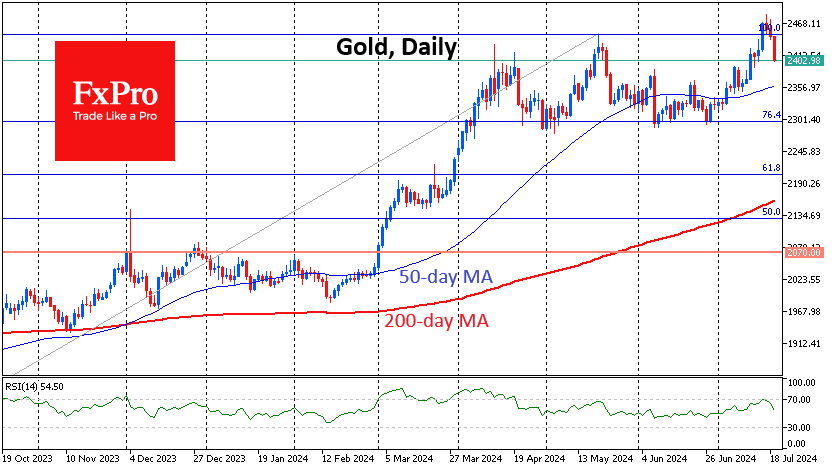
A falling relative strength: The upward impulses taking the gold price to new highs coincide with increasingly lower RSI peaks. In March, at the $2179 price closing high, the RSI peaked at 84. In April, with the price closing high at $2392, the RSI was climbing to 73. In the outgoing week, the record close was at $2468, with RSI at 70. We deliberately skipped the May peak with a closing high of $2425 and RSI at 67, as that upside momentum was relatively small – about 6%.
Next week could determine the momentum for months to come. Drops of more than 3% next week could repeat the pattern of 2020 and 2022 with protracted corrections of more than six months. Most worrisome would be a repeat of the 2011 pattern, when the high of $1921 was followed by a 20% sell-off over four weeks. This peak was not rewritten until nine years later, and from the global peak to the global bottom, the value of a troy ounce almost halved, declining for more than four years.
AUD/USD: On Track for Biggest Weekly Drop Since Mid-April
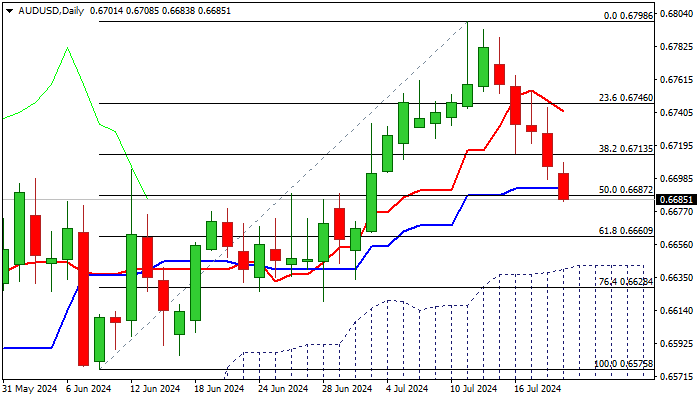
Australian dollar continues to trend lower vs its US counterpart for the fifth consecutive day, on track for the biggest weekly loss since the second week of April.
Bears have so far retraced 50% of 0.6575/0.6798 upleg and look for daily close below daily Kijun-sen (0.6691), to reinforce bearish signal.
Daily studies are weakening (fading bullish momentum/price fell below 10/20DMA’s) however, more work to the downside will be required to signal that bears are taking control and validate reversal signal, developing on weekly chart.
Further acceleration lower would look for test of 0.6660 (Fibo 61.8%) and 0.6642 (daily cloud top), while extended upticks should stay below broken Fibo 38.2% level, now acting as solid resistance (0.6713) to keep bears in play.
Res: 0.6700; 0.6713; 0.6741; 0.6764.
Sup: 0.6662; 0.6631; 0.6604; 0.6575.
Sunset Market Commentary
Markets
One of the biggest-ever IT outages sparked volatility at the start of European trading but without lasting impact on general markets. A security update by CrowdStrike caused a global problem with Microsoft’s Windows. UK retail sales also printed at the onset of trading and failed to settle the debate on the outcome of the August BoE policy meeting. Recall that it only needs a change of heart at a few MPC-members to pull the trigger on an August policy rate cut. This week’s inflation figures and labour market data slightly argued in favour of waiting another month whereas retail sales point into the direction of immediate action. EUR/GBP moved further away from the 0.84 support zone, changing currently hands around 0.8425. Today’s agenda was empty afterwards, allowing us to focus on ECB comments following yesterday’s indecisive policy meeting. ECB Muller finds it hard to comment on how many rate cuts there will be this year. ECB Villeroy was more willing to show his cards, suggesting that market expectations on rates (quarterly 25 bps moves in September/December/March/June) seem rather reasonable. ECB Simkus warned on the strength of services inflation but also agrees with the market view for two more cuts this year. ECB Rehn was neutral, not willing to commit to any rate-path. It’s clear that July and August CPI figures and Q2 wage data will in the end decide on the near term ECB policy rate path.
European stock markets lost around 0.5% in the open, catching up with WS losses, but held stable afterwards. The dollar is going nowhere at EUR/USD 1.0890. Core bonds face somewhat more selling pressure, as the ISM/CPI rally is running out of steam. Daily changes on the US yield curve currently range between +2.5 bps and +3.5 bps. German yields increase by 1.5 bps to 3.8 bps in a steepening move. Markets likely entered some kind of lull in the run-up to the July 31st FOMC meeting. More and more gossip on a Biden withdrawal in the US presidency race for now leaves no traces on markets neither.
News & Views
The ECB Survey of Professional Forecasters for Q3 2024 only showed modest changes compared to the Q2 outlook. Respondents expect headline HICP inflation to decline from 2.4% in 2024 to 2% in 2025 and further to 1.9% in 2026 (unchanged apart from a 0.1 ppt downward revision for 2026). Longer-term inflation expectations were unchanged at 2%. Expectations for core inflation (ex-energy and food) were revised upwards slightly for 2024 (2.7% from 2.6%) and 2025 (2.2% from 2.1), reflecting data outturns and more persistent than expected services inflation and labour cost growth. Expected real GDP growth for 2024 remained modest at 0.7%, reflecting mainly a weak carry-over from 2023, but was revised upwards due to a stronger than expected Q1 2024 outturn. Expectations for 2025, 2026 and the longer term were 1.3%, 1.4% and 1.3% respectively (unchanged apart from a 0.1 ppt downward revision for 2025). Respondents expect the unemployment rate to increase to 6.5% in 2024 but to decline gradually to 6.4% in 2026 and then remain at 6.4% in the longer term, implying a slight downward revision to the profile of the unemployment rate. Expectations for annual growth in compensation per employee were revised upwards by 0.5 ppts for 2024 and 0.2 ppts for 2025, to 4.5% and 3.4% respectively. These revisions were explained by stronger than expected outcomes, increases in public sector wages and in minimum wages in some countries, plus more persistence looking ahead than previously expected.
Looking forward to next week’s policy meeting of the National Bank of Hungary (MNB), KBC economics expects that there is room for a next 25 bps rate cut, even as the MNB announced that it had entered a new era for monetary policy, applying a more cautious month-by-month approach. However, this week vice-governor Virag indicated that a July rate cut remains completely open depending on incoming data. He expects inflation likely to remain around the tolerance band in the second half of the year and beliefs inflation could stay closer to 4% rather than 5% expected by some. This still requires a tight and prudent policy with an appropriate level of real interest rates. With inflation currently near/below 4% (3.7% headline, 4.1% core), he sees 2 or 3 rate cuts by the end of the year as realistic. The MNB might also positively assess recent fiscal consolidation measures announced by the government. A recent decline in market interest rates and the forint strengthening to near EUR/HUF 390 could give the MNB some comfort as well. After a 25 bps rate cut to 6.75% next week, KBC sees an end of year policy rate of 6.25% with next steps September and December.
Graphs
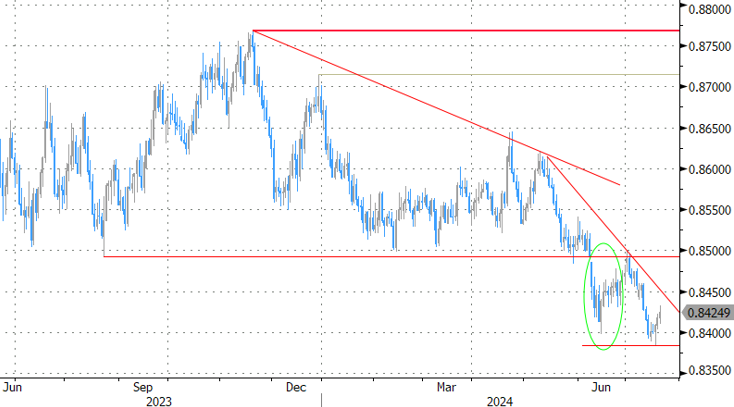
EUR/GBP: markets remain in doubt on outcome of August policy meeting. Too early to frontrun on break below 0.84
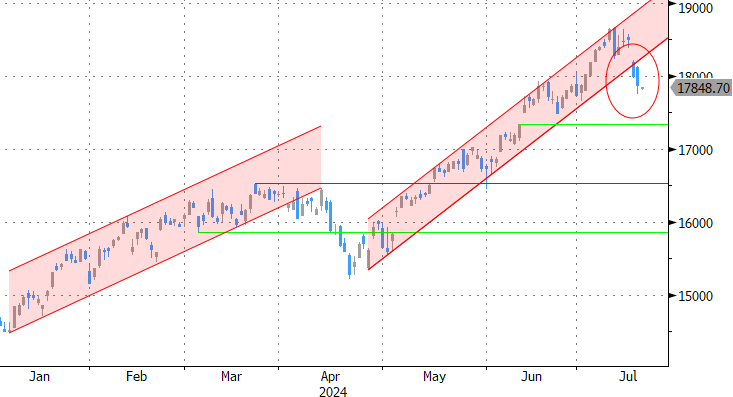
Nasdaq: IT-outage adds to current correction momentum
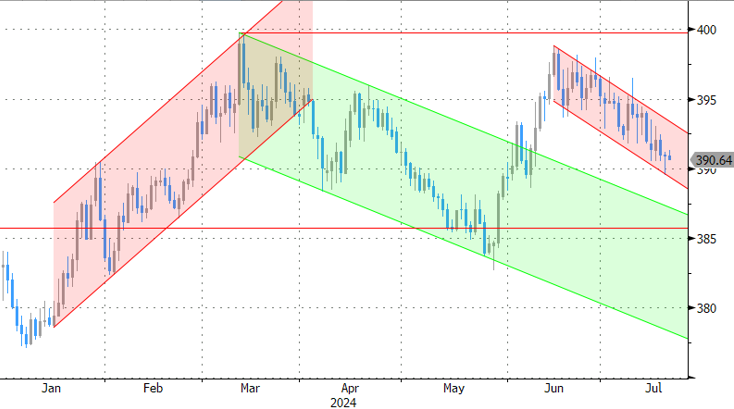
EUR/HUF: forint doesn’t bother MNB intentions to restart easing cycle before it even really stopped
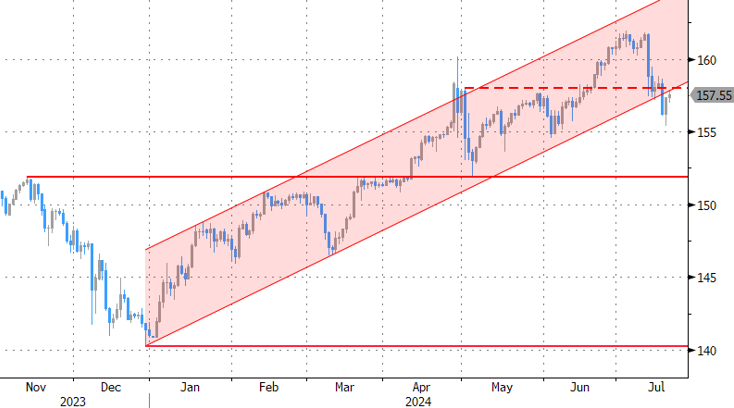
USD/JPY: Japanese June inflation data rise, though slightly less than feared. We don’t think it will stop the BoJ from implementing a rate hike at the July 31 meeting
USD/JPY Mid-Day Outlook
Daily Pivots: (S1) 155.29; (P) 156.95; (R1) 157.84; More...
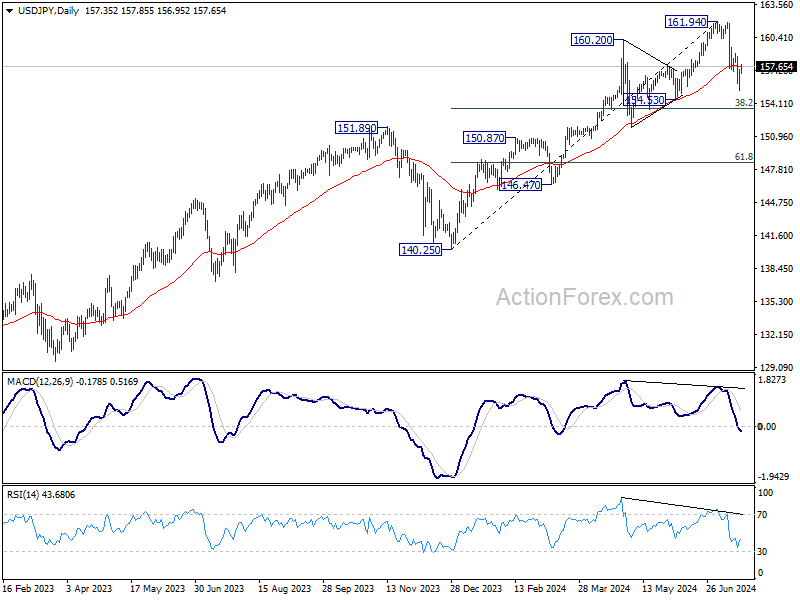
Intraday bias in USD/JPY remains neutral at this point. Deeper decline is still expected as long as 158.85 resistance holds. Below 155.36 will extend the fall from 161.94, as a correction to rally from 140.25, to 38.2% retracement of 140.25 to 161.94 at 163.65. On the upside, above 158.85 resistance will turn bias back to the upside for stronger rebound instead.
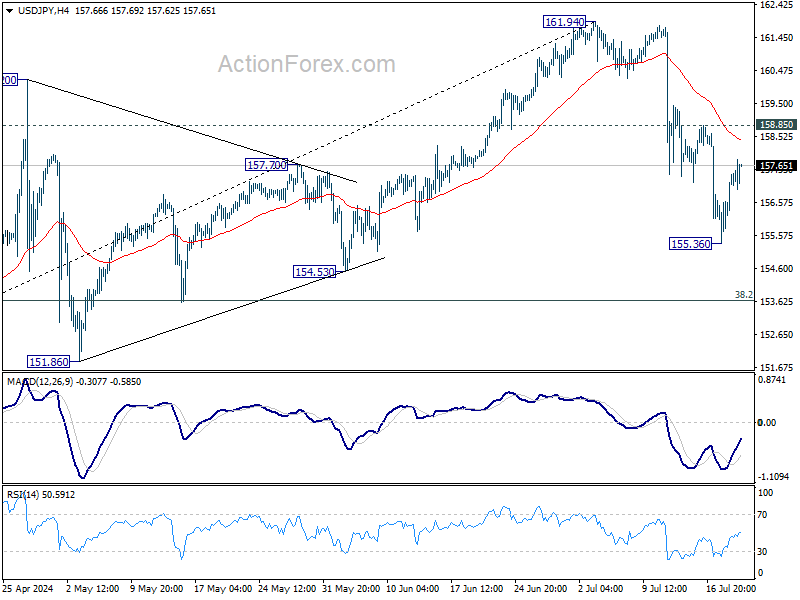
In the bigger picture, as long as 151.89 resistance turned support holds, long term up trend could still continue through 161.94 at a later stage. Next target will depend on the depth of the current correction from 161.94. However, sustained break of 151.89 will argue that larger scale correction or trend reversal is underway.
USD/CHF Mid-Day Outlook
Daily Pivots: (S1) 0.8839; (P) 0.8859; (R1) 0.8898; More…
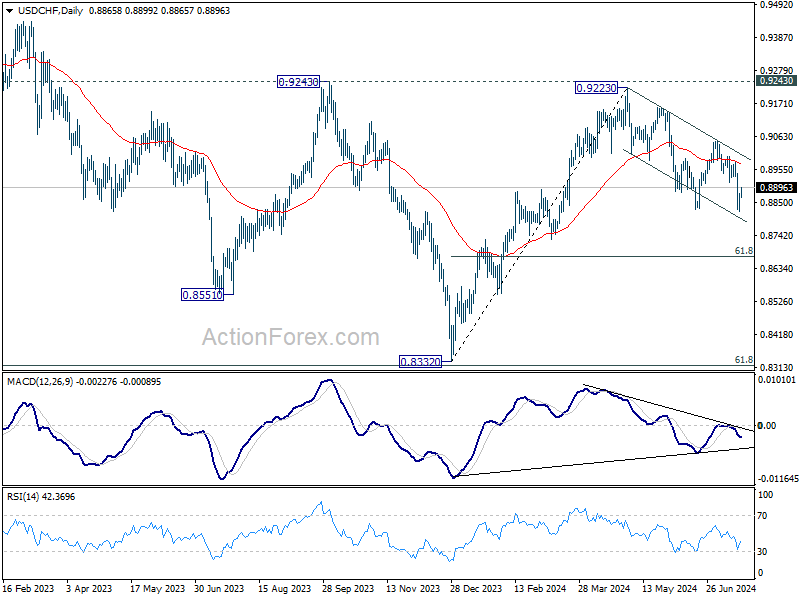
Intraday bias in USD/CHF remains neutral for consolidations above 0.8819 temporary low. But further decline is expected as long as 0.9049 resistance holds. Break of 0.8819 will resume the fall from 0.9223 to 60% retracement of 0.8332 to 0.9223 at 0.8672 next.
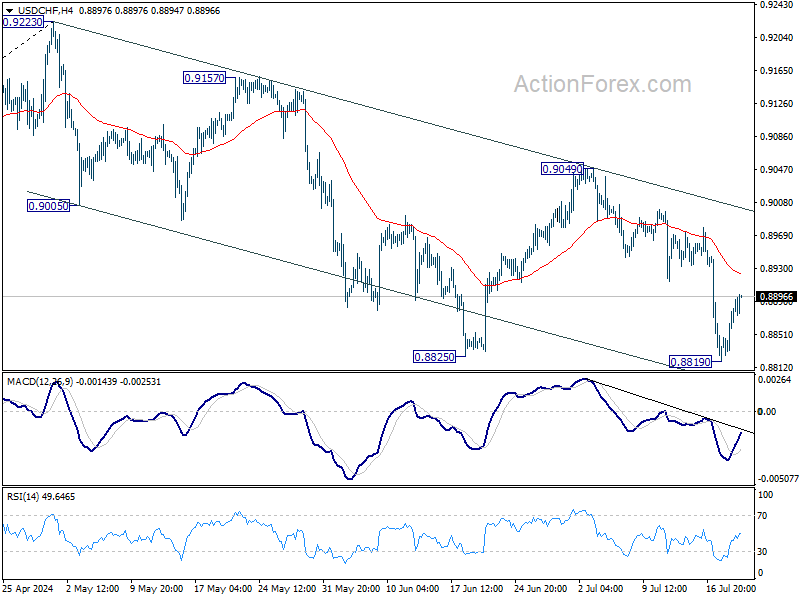
In the bigger picture, with 0.9243 resistance intact, medium term outlook in USD/CHF is neutral at best. For now, more sideway trading is likely between 0.8332/9243. However, firm break of 0.9243 will indicate larger bullish trend reversal.
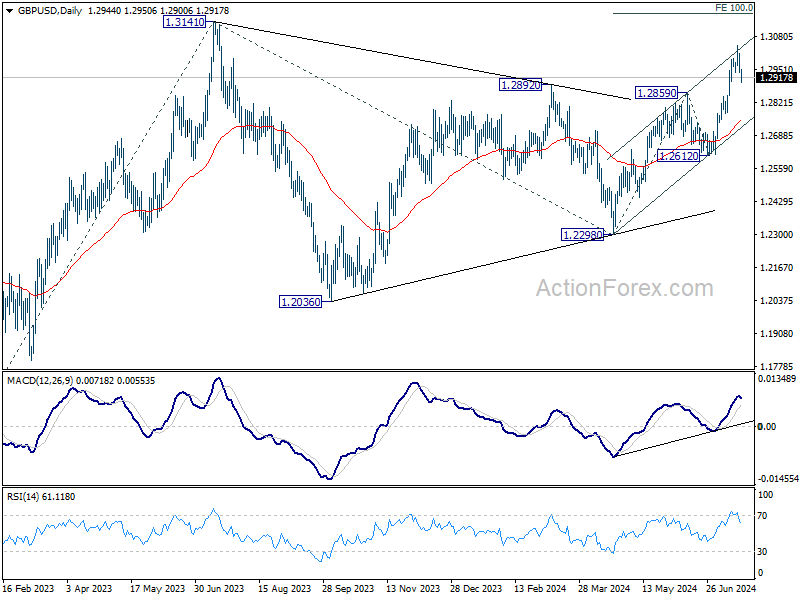
GBP/USD Mid-Day Outlook
Daily Pivots: (S1) 1.2915; (P) 1.2968; (R1) 1.2997; More...
Intraday bias in GBP/USD remains neutral at this point. Pullback from 1.3043 could extend lower but downside should be contained by 1.2859 resistance turned support to bring another rally. Above 1.3043 will resume the rise from 1.2298 to 100% projection of 1.2298 to 1.2859 from 1.2612 at 1.3173, which is slightly above 1.3141 key medium term resistance. However, firm break of 1.2859 will turn bias to the downside for deeper decline.
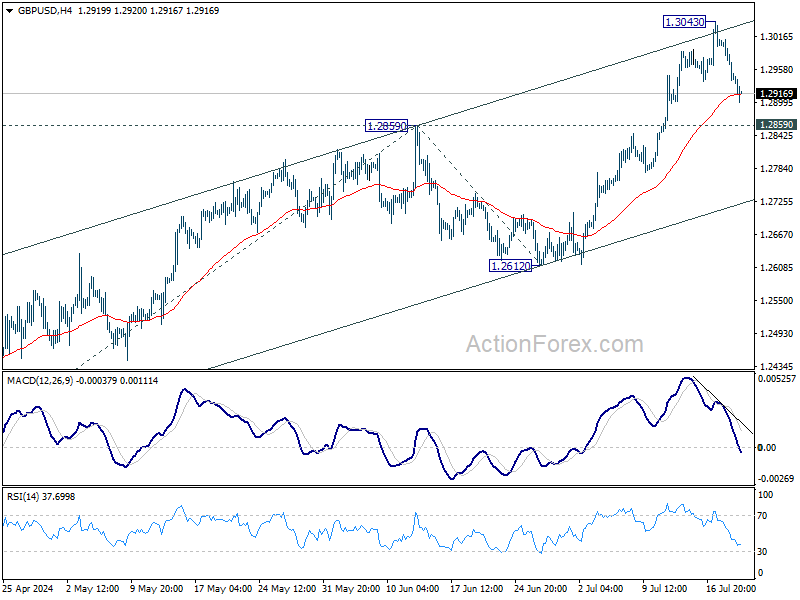
In the bigger picture, corrective pattern from 1.3141 medium term top (2023 high) could have completed with three waves to 1.2298 already. This will now remain the favored case as long as 1.2612 support holds. Firm break of 1.3141 will target 61.8% projection of 1.0351 (2022 low) to 1.3141 from 1.2298 at 1.4022.