Sample Category Title
EUR/USD Mid-Day Outlook
Daily Pivots: (S1) 1.0829; (P) 1.0864; (R1) 1.0904; More....
No change in EUR/USD's outlook and intraday bias stays on the upside for retesting 1.0915 resistance. Decisive break there will resume whole rally from 1.0601 and target 100% projection of 1.0601 to 1.0915 from 1.0665 at 1.0919 next. For now, risk will stay on the upside as long as 1.0805 support holds, in case of retreat.
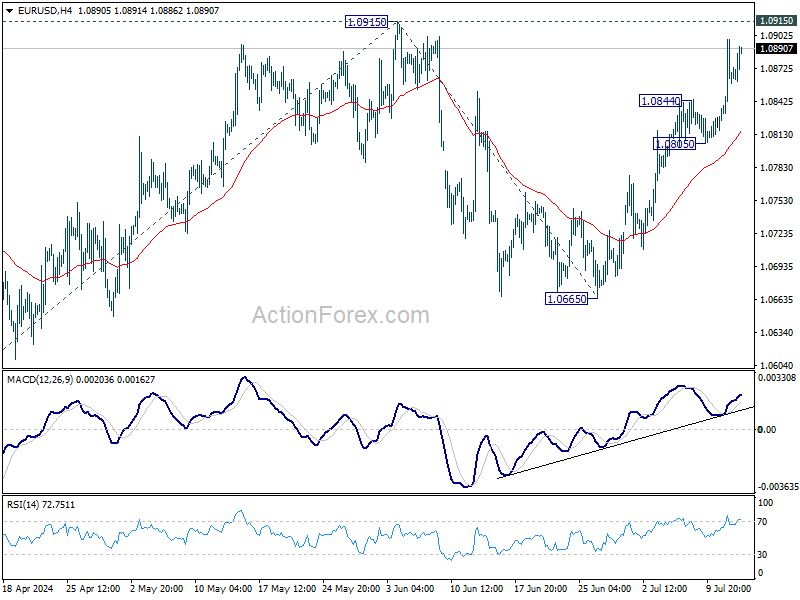
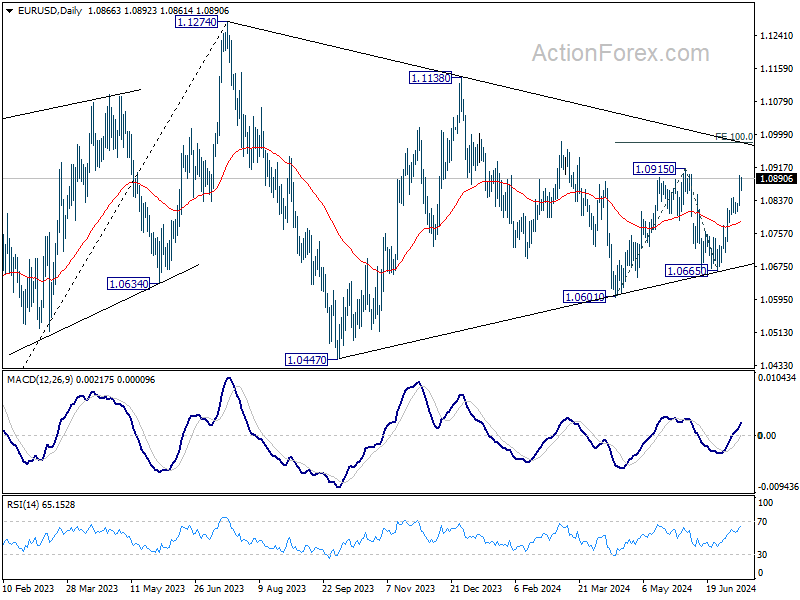
In the bigger picture, price actions from 1.1274 are viewed as a corrective pattern that could still be in progress. Break of 1.0601 will target 1.0447 support and possibly below. On the upside, firm break of 1.0915 resistance will start another rising leg back to 1.1138 resistance instead.
GBP/USD Mid-Day Outlook
Daily Pivots: (S1) 1.2858; (P) 1.2903; (R1) 1.2960; More...
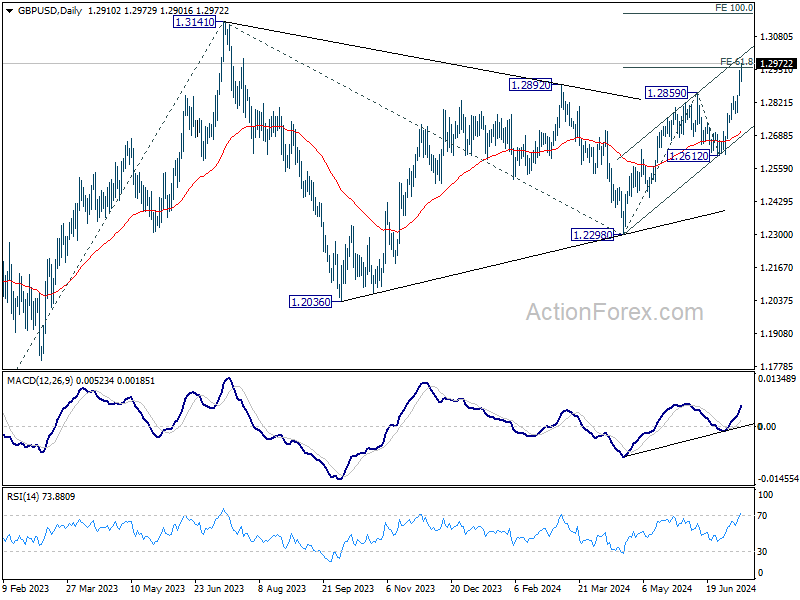
Intraday bias in GBP/USD remains on the upside for the moment. Decisive break of 61.8% projection of 1.2298 to 1.2859 from 1.2612 at 1.2959 would prompt upside acceleration through 1.3141 resistance to 100% projection at 1.3173. On the downside, below 1.2845 resistance turned support will turn intraday bias neutral first.
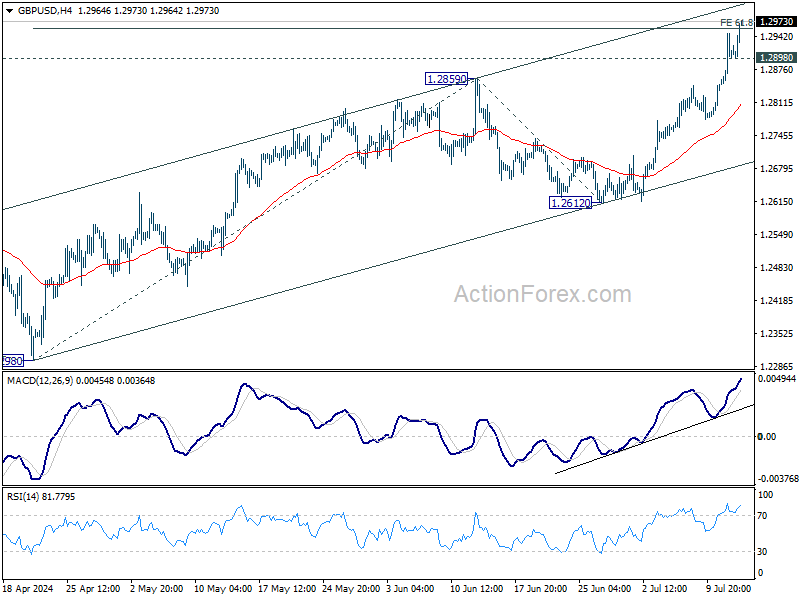
In the bigger picture, price actions from 1.3141 medium term top are seen as a corrective pattern which might have completed with three waves to 1.2298 already. This will now remain the favored case as long as 1.2612 support holds. Firm break of 1.3141 will target 61.8% projection of 1.0351 (2022 low) to 1.3141 (2023 high) from 1.2298 at 1.4022.
USD/CHF Mid-Day Outlook
Daily Pivots: (S1) 0.8919; (P) 0.8961; (R1) 0.9007; More…
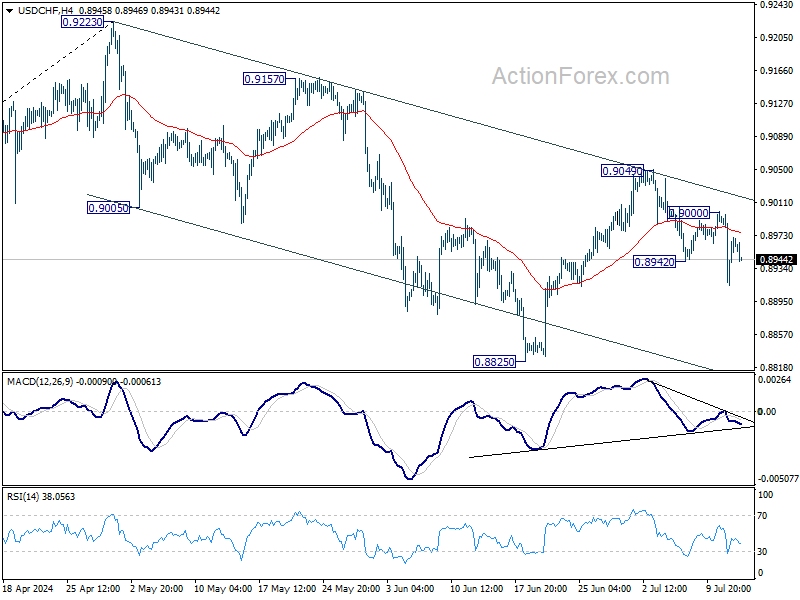
No change in USD/CHF's outlook as further decline is expected with 0.9000 resistance intact. Deeper decline would be seen to 0.88825 support. Fall from 0.9223 should be in progress with near term channel intact. Break of 0.8825 will target 50% retracement of 0.8332 to 0.9223 at 0.8778 next. However, break of 0.9000 will turn bias back to the upside for 0.9049 resistance instead.
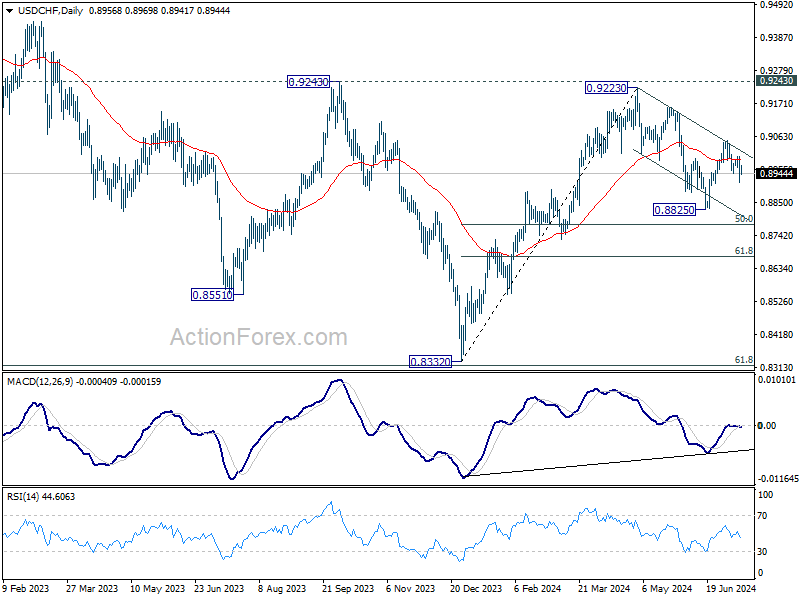
In the bigger picture, focus remains on 0.9223/9243 resistance zone. Decisive break there would suggest larger bullish trend reversal and turn outlook bullish. Nevertheless, rejection by 0.9223/43 will keep medium term outlook neutral at best, for more range trading between 0.8332/9243 first.
USD/JPY Mid-Day Outlook
Daily Pivots: (S1) 156.97; (P) 159.37; (R1) 161.30; More...
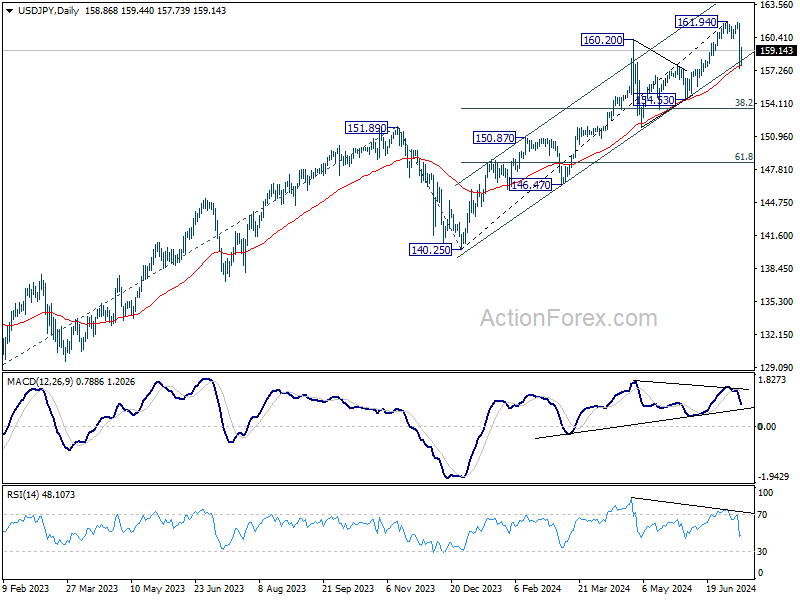
No change in USD/JPY's outlook. Deeper decline is expected with 160.25 support turned resistance intact. Fall from 161.94 is seen as corrective the five-wave rally from 140.25. Sustained break of 55 D EMA (now at 157.71) will affirm this bearish case. Next target will be 38.2% retracement of 140.25 to 161.94 at 163.65.
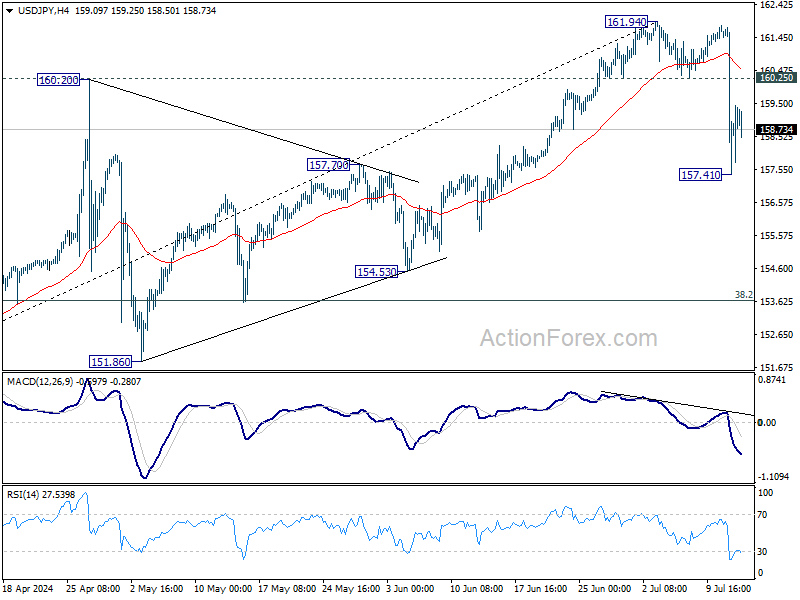
In the bigger picture, long term up trend is still in progress. Further rise is expected as long as 154.53 support holds. Next target is 100% projection of 127.20 (2023 low) to 151.89 (2023 high) from 140.25 at 164.94. However, sustained break of 154.53 will raise the chance of larger scale correction and target 140.25/151.89 support zone.
Dollar Softens Post-PPI Release, Yet Selling Momentum Remains Limited
Dollar is under some selling pressure in early US session despite stronger-than-expected PPI readings. However, downside momentum of the greenback is relatively limited. The post-CPI selloff yesterday did not gain significant traction, partly because stock markets unexpectedly retreated. Currently, futures are indicating a flat opening, and if activity in risk markets remains subdued in this final session of the week, Dollar might stabilize, at least temporarily.
Meanwhile, Japanese Yen is undergoing a consolidation phase after yesterday's significant gains—the largest daily rally against Dollar since late 2022. Although there has been no official confirmation from Japanese officials regarding intervention in the currency markets, data released by BoJ today suggests that the scale of intervention was likely around JPY 3.5T.
The estimate on Japan's intervention is derived from movements observed in the central bank's accounts. Notably, BoJ's current account balance is expected to decrease by JPY 3.2T due to government fiscal factors by next Tuesday, a stark contrast to the JPY 333B increase forecasted by private money brokers prior to the suspected intervention. Further clarity on these interventions will be available when official monthly data is released on July 31.
Reviewing the weekly performance across currency markets, New Zealand Dollar remains the weakest, closely followed by Dollar and then Swiss Franc. On the stronger side, Yen leads, followed by Sterling and Euro. Australian Dollar and Canadian Dollar are positioned in the middle of the performance spectrum.
In Europe, at the time of writing, FTSE is up 0.19%. DAX is up 0.22%. CAC is up 0.65%. UK 10-year yield is up 0.0524 at 4.131. Germany 10-year yield is up 0.045 at 2.513. Earlier in Asia, Nikkei fell -2.45%. Hong Kong HSI rose 2.59%. China Shanghai SSE rose 0.03%. Singapore Strait Times rose 0.65%. Japan 10-year JGB yield fell -0.0336 to 1.050.
US PPI rises 0.2% mom, 2.6% yoy, largest annual advance in more than a year
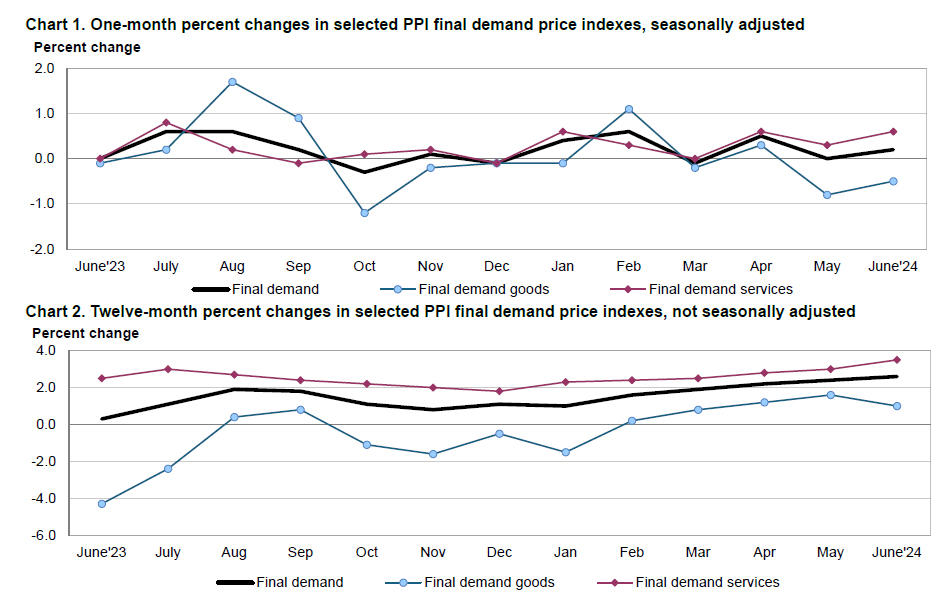
US PPI for final demand rose 0.2% mom in June, slightly above expectation of 0.1% mom. PPI rose 2.6% yoy for the 12 months ended in June, above expectation of 2.2% yoy. That's also the largest annual advance since March 2023.
PPI less foods, energy, and trade services were unchanged at 0.0% mom. For the 12 months period, PPI less foods, energy, and trade services rose 3.1% yoy.
New Zealand BNZ manufacturing freefalls to lowest non-lockdown level since 2009
New Zealand BusinessNZ Performance of Manufacturing Index fell sharply from 46.6 to 41.1 in June, well below the long-term average of 52.6 and marking the lowest non-lockdown monthly level since February 2009.
Breaking down the details, production dropped from 44.0 to 35.4, and new orders fell from 43.9 to 38.8. These sub-40 activity levels for production and new orders are the lowest seen outside of COVID lockdowns since November 2008. Employment also declined significantly, from 50.4 to 43.8, its lowest non-COVID monthly result since July 2019. Finished stocks decreased from 52.3 to 47.9, while deliveries remained unchanged at 44.9.
BusinessNZ's Director of Advocacy, Catherine Beard, expressed significant concern over the "freefall in activity from May to June," highlighting the severe challenges facing a sector that has been contracting for the past 15 months. The proportion of negative comments surged to 76.3%, up from 63.5% in May and 69% in April, with respondents highlighting an overall economic slowdown and tough recessionary conditions.
USD/JPY Mid-Day Outlook
Daily Pivots: (S1) 156.97; (P) 159.37; (R1) 161.30; More...
No change in USD/JPY's outlook. Deeper decline is expected with 160.25 support turned resistance intact. Fall from 161.94 is seen as corrective the five-wave rally from 140.25. Sustained break of 55 D EMA (now at 157.71) will affirm this bearish case. Next target will be 38.2% retracement of 140.25 to 161.94 at 163.65.
In the bigger picture, long term up trend is still in progress. Further rise is expected as long as 154.53 support holds. Next target is 100% projection of 127.20 (2023 low) to 151.89 (2023 high) from 140.25 at 164.94. However, sustained break of 154.53 will raise the chance of larger scale correction and target 140.25/151.89 support zone.
Economic Indicators Update
| GMT | Ccy | Events | Actual | Forecast | Previous | Revised |
|---|---|---|---|---|---|---|
| 22:30 | NZD | Business NZ PMI Jun | 41.1 | 47.2 | 46.6 | |
| 03:00 | CNY | Trade Balance (USD) Jun | 99.1B | 85.1B | 82.6B | |
| 03:00 | CNY | Trade Balance (CNY) Jun | 704B | 590B | 586B | |
| 04:30 | JPY | Industrial Production M/M May F | 3.60% | 2.80% | 2.80% | |
| 12:30 | CAD | Building Permits M/M May | -12.20% | -5.00% | 20.50% | 23.40% |
| 12:30 | USD | PPI M/M Jun | 0.20% | 0.10% | -0.20% | 0.00% |
| 12:30 | USD | PPI Y/Y Jun | 2.60% | 2.20% | 2.20% | |
| 12:30 | USD | PPI Core M/M Jun | 0.40% | 0.20% | 0.00% | 0.30% |
| 12:30 | USD | PPI Core Y/Y Jun | 3.00% | 2.50% | 2.30% | |
| 14:00 | USD | Michigan Consumer Sentiment Jul P | 68.5 | 68.2 |
US PPI rises 0.2% mom, 2.6% yoy, largest annual advance in more than a year
US PPI for final demand rose 0.2% mom in June, slightly above expectation of 0.1% mom. PPI rose 2.6% yoy for the 12 months ended in June, above expectation of 2.2% yoy. That's also the largest annual advance since March 2023.
PPI less foods, energy, and trade services were unchanged at 0.0% mom. For the 12 months period, PPI less foods, energy, and trade services rose 3.1% yoy.
Corporates Have Weighed in on Crypto Once Again
Market picture
The crypto market capitalisation fell by 0.8% in 24 hours to $2.11 trillion. An attempt to strengthen the market’s offensive on news about inflation in the US attracted new sellers, which this time can easily be linked to the similar dynamics of the Nasdaq index, with which crypto has the closest correlation.
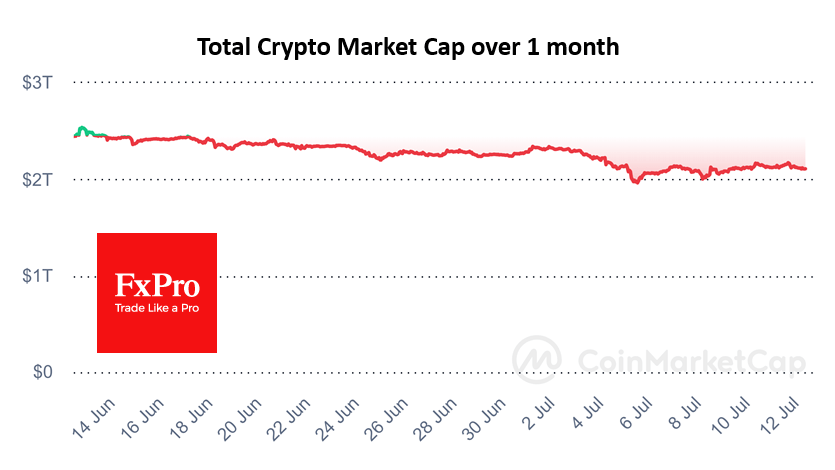
At the same time, the dynamics of the last 24 hours were not one-sided: Bitcoin lost 1.4%, Ethereum—0.3%, BNB—0.9%, and Solana—3.5%, but such coins as XRP, Toncoin, and many others added. Perhaps we can say that those who added were the majority, but their weight in the market was not that big. That is, buyers showed interest in buying, but corporate and government sellers were pulling the market down this time.
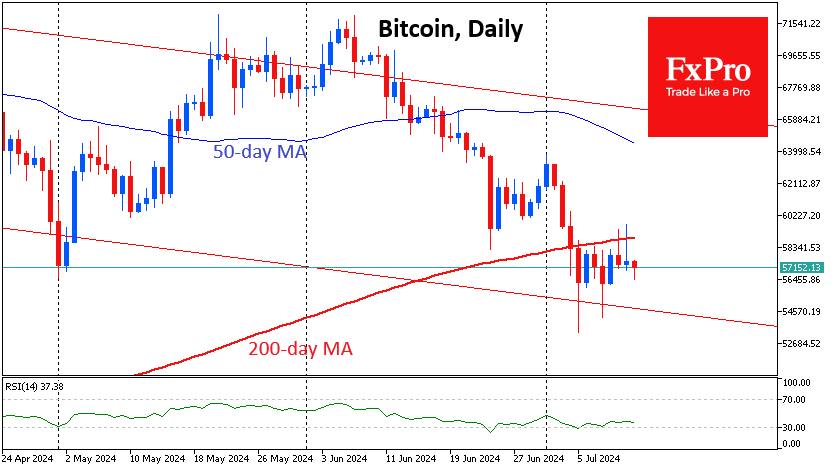
Bitcoin is back at $57K after a failed assault on $60K on Thursday. Technically, the bears are keeping the price above the 200-day moving average. In fact, the sellers could be corporates, whose actions are often closely tied to Nasdaq100 performance. German authorities were also actively selling off previously confiscated Bitcoins. This volume is not huge, but some potential buyers prefer to stay on the sidelines, seeing the overhang of sales.
Could we be seeing the start of an altcoin rally? We doubt it, suggesting that the altcoin season only begins when the prices of the largest coins have reached all-time highs and appear overvalued to some.
News background
German authorities have left only 4925 BTC worth about $282 million for sale. This is less than 10% of the original amount seized in January from the pirate movie site Movie2k.
The BitMEX exchange pleaded guilty to violating the US Bank Secrecy Act and wilfully failing to implement an anti-money laundering (AML) programme. The platform became a vehicle for large-scale money laundering and sanctions evasion schemes, the US Attorney for the Southern District of New York said in a statement.
The US SEC has terminated its investigation into stablecoin issuer Paxos and does not intend to pursue enforcement action.
US CFTC Chairman Rostin Banham said that 70-80% of crypto assets do not qualify as securities, contradicting the SEC’s position.
Ethereum co-founder Vitalik Buterin urged the community to prepare for a potential ‘51% attack’ on ETH, one of the main threats. In the context of Proof-of-Stake, a 51% attack occurs when an attacker controls more than 50% of all coins blocked from participating in the validation of network blocks.
Analysis of USD/JPY: Was There an Intervention?
Yesterday’s news of slowing inflation in the US sharply weakened the dollar, anticipating the Federal Reserve’s monetary easing. In the first 15 minutes after the data release:
→ EUR/USD rose by approximately 0.45% to the psychological level of 1.09;
→ GBP/USD increased by approximately 0.55%, reaching a 2024 high.
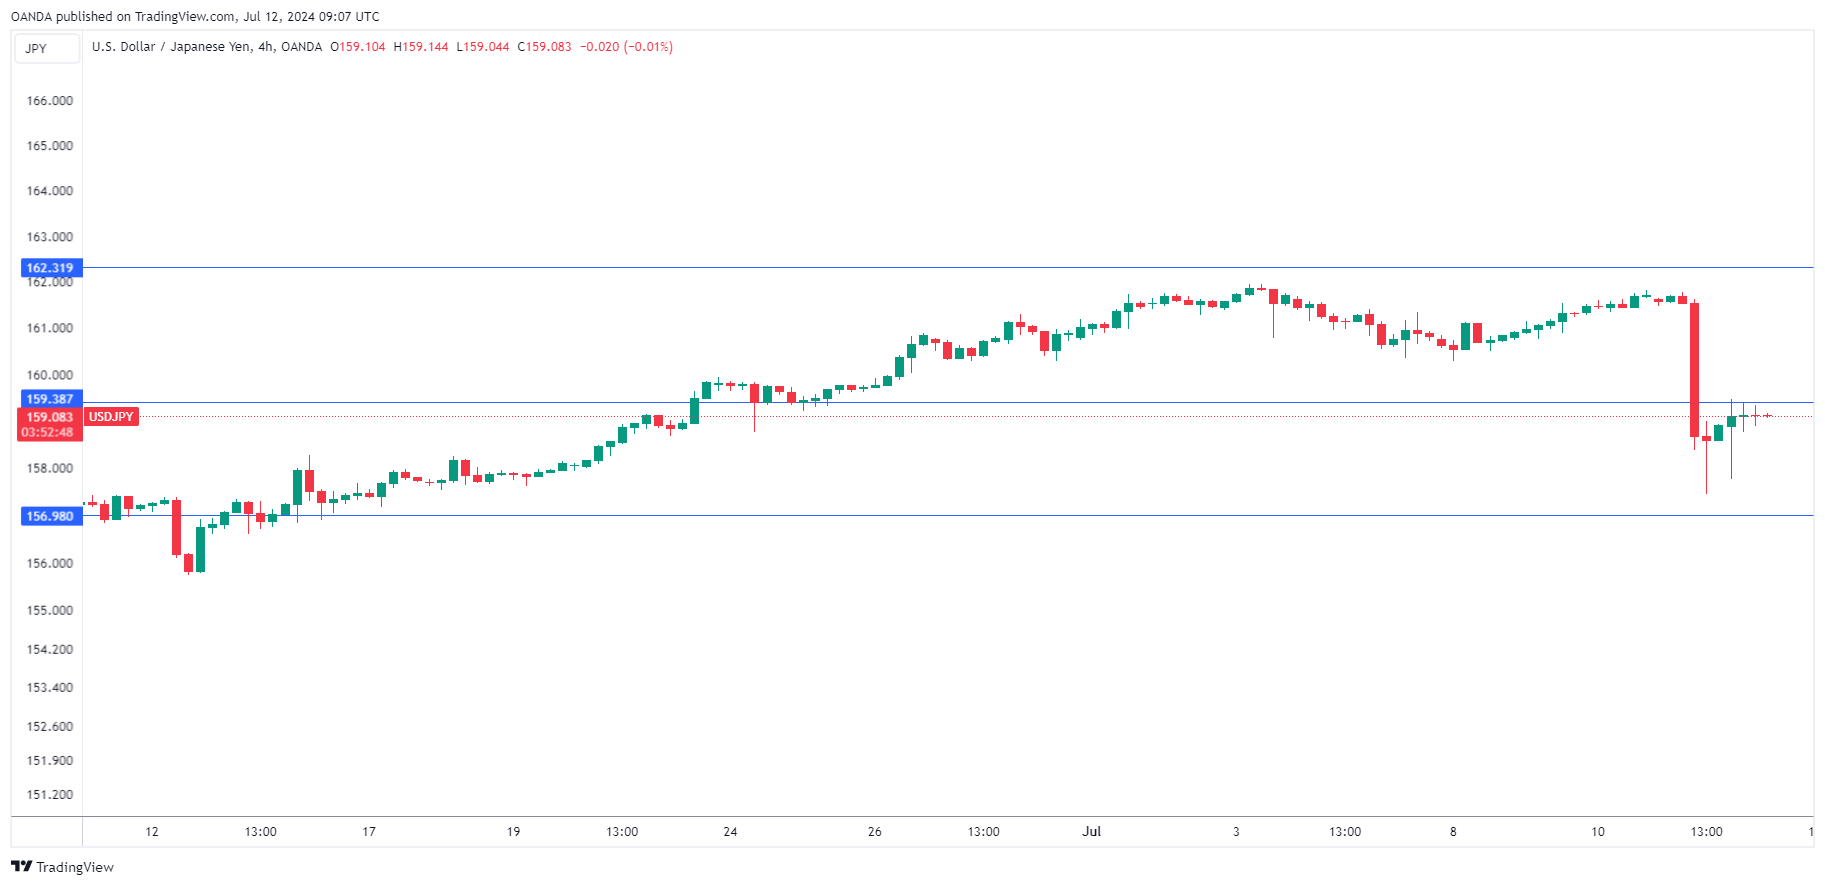
Conversely, USD/JPY fell, with a more aggressive movement. As the chart shows, the dollar weakened against the yen by about 1.8% in the first 15 minutes after the release. This suggests that amidst the US news, the Bank of Japan intervened to support its currency, which hadn’t fallen below 160 yen per USD since June 26.
Reuters reports that Tokyo’s chief currency diplomat, Masato Kanda, stated on Friday that authorities would take necessary measures in the currency market but declined to comment on whether they had intervened.
Aside from the question of intervention, the future outlook for the yen against the dollar is of interest.
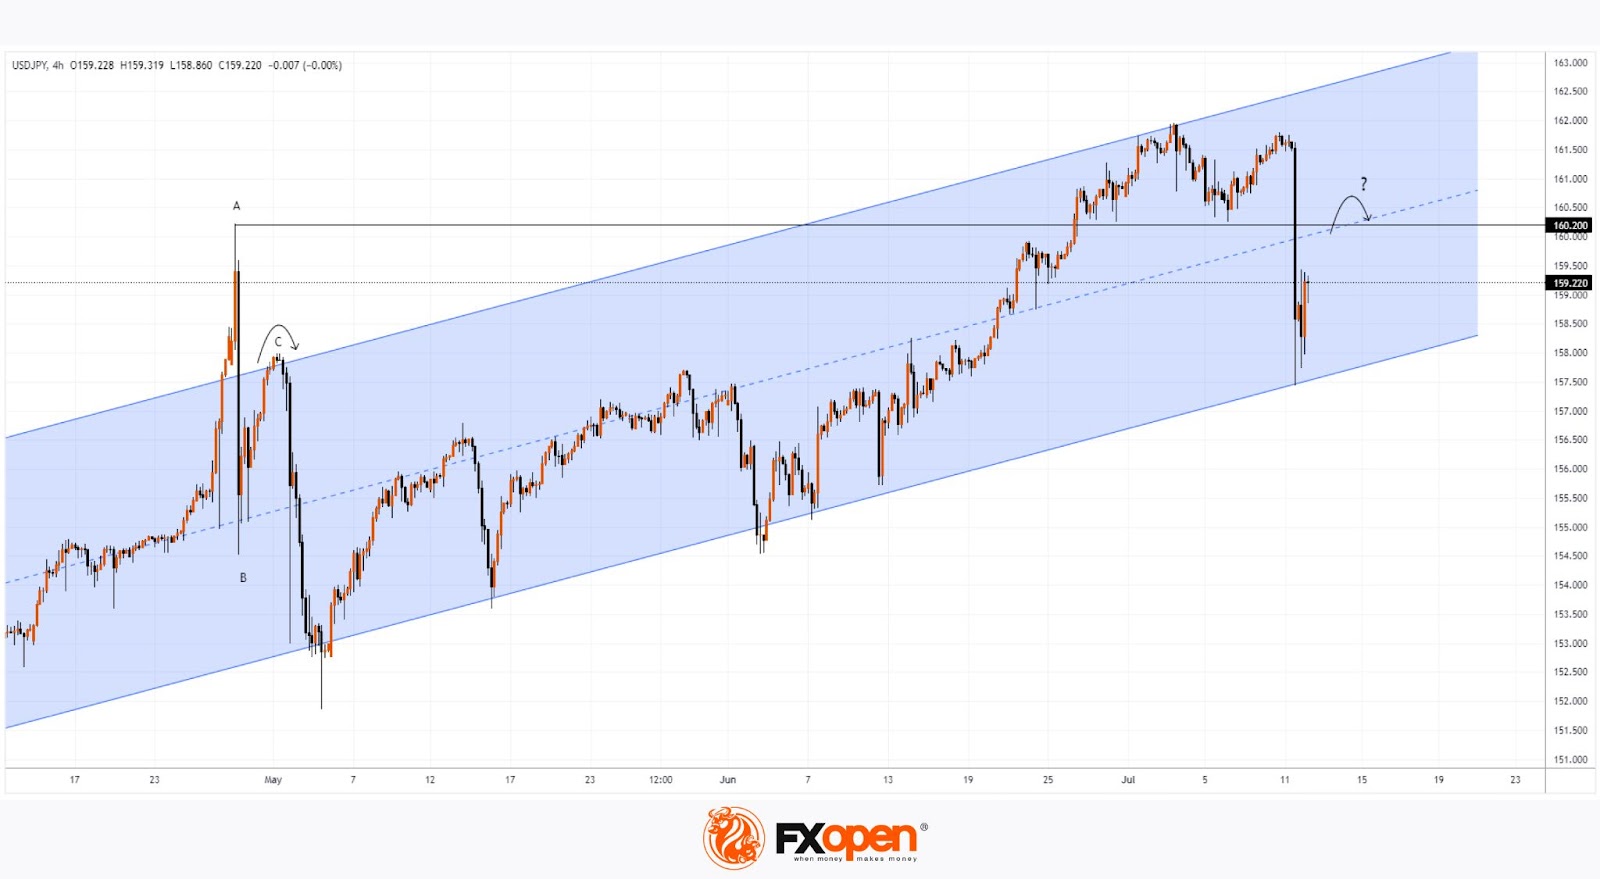
On June 27, analysing USD/JPY, we constructed an ascending blue channel.
Technical analysis of USD/JPY with updated data shows that:
→ the price remains within the boundaries of this channel;
→ yesterday’s sharp drop began near its upper boundary, finding support at its lower boundary.
Note the price behaviour in a similar situation after the sharp fall from A→B in late April. A rebound from B→C of approximately 50% occurred, forming a Rounding Top pattern at the upper part (as indicated by the arrow). Bears then reasserted themselves.
If USD/JPY follows a similar scenario, we may see a recovery to the resistance block formed by the median line of the blue channel and the 160.20 level (drawn from the April high), followed by the formation of a rounding top with renewed bearish activity (indicated by the question-marked arrow).
Trade over 50 forex markets 24 hours a day with FXOpen. Take advantage of low commissions, deep liquidity, and spreads from 0.0 pips. Open your FXOpen account now or learn more about trading forex with FXOpen.
This article represents the opinion of the Companies operating under the FXOpen brand only. It is not to be construed as an offer, solicitation, or recommendation with respect to products and services provided by the Companies operating under the FXOpen brand, nor is it to be considered financial advice.
USD/JPY Stabilizes After Massive Slide
The Japanese yen has edged lower on Friday, after posting huge gains a day earlier. USD/JPY is trading at 159.16 in the European session, up 0.26% on the day at the time of writing.
Japanese yen soars – soft US inflation or intervention?
The US dollar was down against most of the major currencies on Thursday, after a softer–than-expected US CPI report raised expectations for a rate cut in September. The yen was the big winner on the day, surging as much as 2.7% and climbing to 157.41 against the dollar. The US dollar recovered some of these losses and USD/JPY closed at 158.76, down 1.8% on the day.
US inflation fell to 3.0% y/y/ in June, its lowest level in a year. This was down from 3.3% in May and below the market estimate of 3.1%. The monthly reading was impressive at -0.1%, the first decline since May 2020. Core inflation also eased in June and market expectations for a September rate cut have jumped to 86%, compared to 69% a day just prior to the inflation report. The Federal Reserve has gone to great lengths to dampen rate cut expectations but may send a more dovish signal to the markets following the very soft inflation data.
The US dollar had a bad day at the office on Thursday but the extent of the slide against the yen raised suspicions that Tokyo had intervened in the currency markets. A report on Japanese TV said that the government and the Bank of Japan had intervened after the US dollar posted losses following the US inflation report.
Japan’s chief currency diplomat, Masato Kanda, didn’t surprise anyone by saying “no comment” about whether there was an intervention on Thursday. Japan is embroiled in a constant cat-and-mouse game with yen speculators and its policy is to keep market participants in the dark about currency interventions. With the Bank of Japan signaling that it plans to tighten policy, we can expect additional volatility from the Japanese currency.
USD/JPY Technical
- USD/JPY tested resistance at 159.37. Above, there is resistance at 161.30
- There is support at 156.97
NZ Dollar Edges Higher Despite Soft Mfg. Data
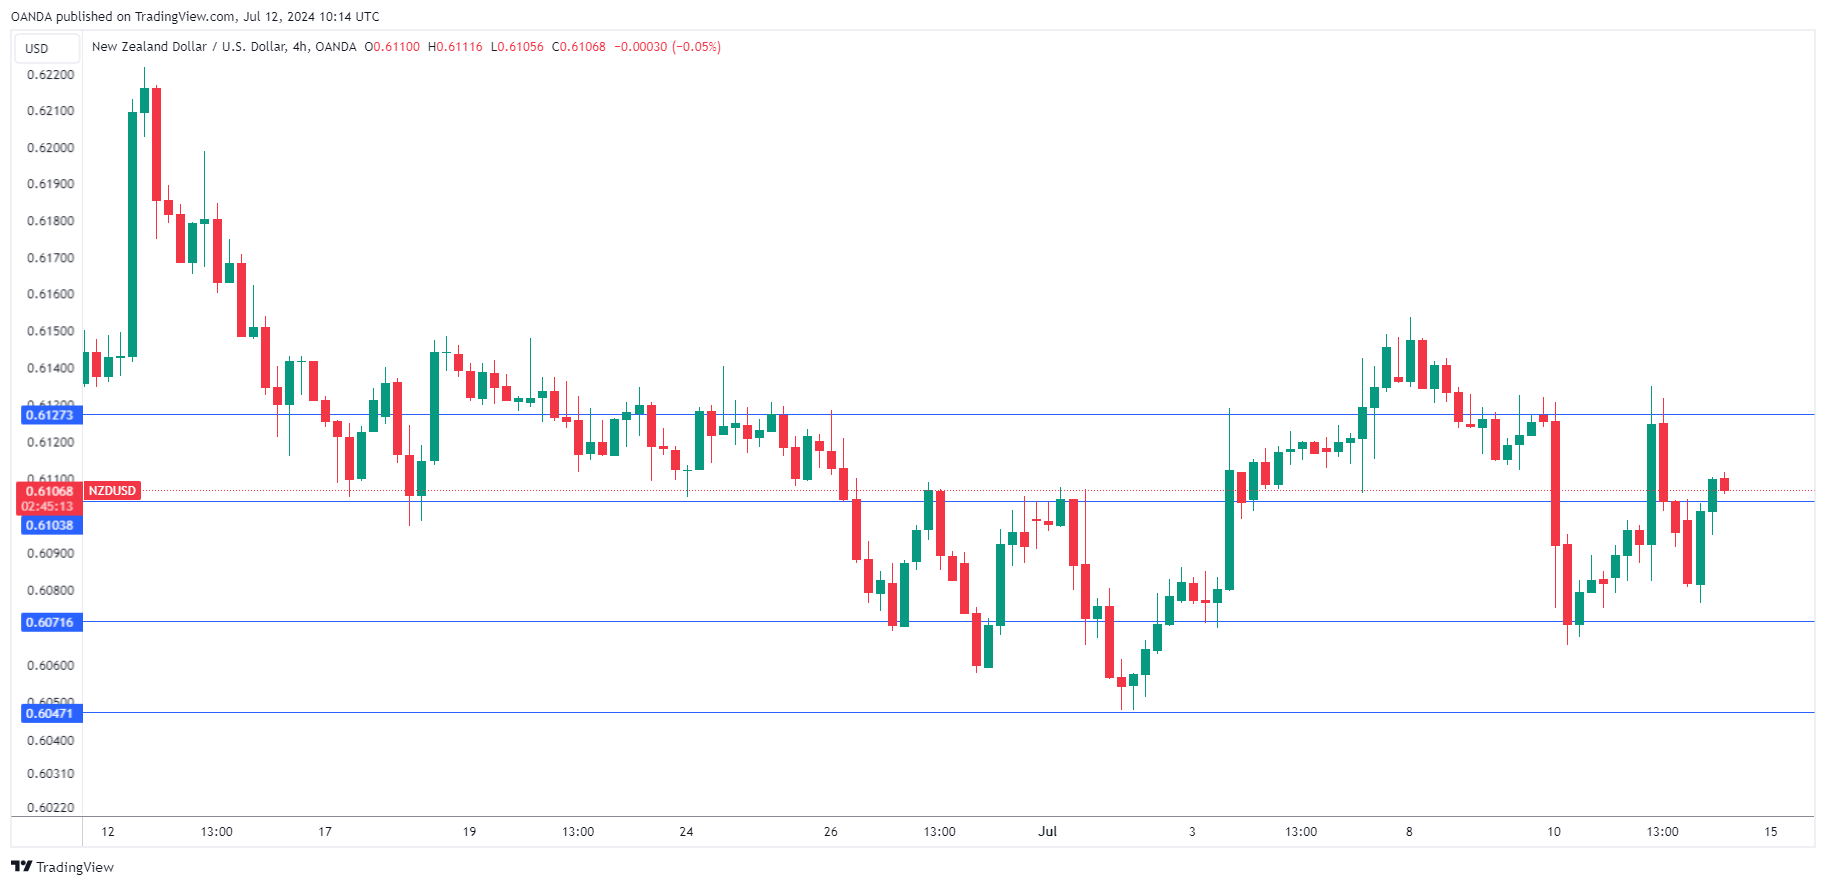
The New Zealand dollar is slightly higher on Friday. NZD/USD is trading at 0.6110 in the European session, up 0.24% on the day at the time of writing.
New Zealand dollar showing big swings
It has been a volatile few days for the New Zealand dollar. On Wednesday, NZD/USD fell as much as 1% after the Reserve Bank of New Zealand surprised the markets with an unusually dovish rate statement. The RBNZ held the cash rate at 5.5% for an eighth consecutive time but opened the door to rate cuts earlier than expected, perhaps as early as August.
At the previous meeting in May, the RBNZ projected rates would remain at 5.5% until August 2025 and even discussed a rate hike. The central bank made a startling 180 degree pivot at this week’s meeting, hinting at possible rate cuts due to the slowing economy and expectations for inflationary pressures to ease. The markets jumped on the RBNZ’s dovish pivot and have priced in rate cuts in August or November. The rise in expectations of a rate cut sent the New Zealand dollar sharply lower.
New Zealand’s manufacturing sector has been in a depression and the Manufacturing PMI fell deeper into contraction territory in June. The index slid to 41.1 in June, down sharply from 47.2 in May and shy of the forecast of 46.8. This was the lowest reading since August 2021 and has contracted for 15 straight months. The weak domestic economy and softer demand for New Zealand exports continues to weigh on manufacturing.
.
NZD/USD Technical
- NZD/USD is testing resistance at 0.6103. Above, there is resistance at 0.6127
- 0.6071 and 0.6047 are providing support