
Sample Category Title
EUR/JPY Daily Outlook
Daily Pivots: (S1) 171.04; (P) 173.24; (R1) 174.90; More...
EUR/JPY recovered after falling sharply to 171.50. While further decline might be seen, strong support is expected from 170.87 resistance turned support to bring rebound. That should set the range for consolidations below 175.41 short term top. Nevertheless, firm break of 170.87 will argue that larger correction is already underway.
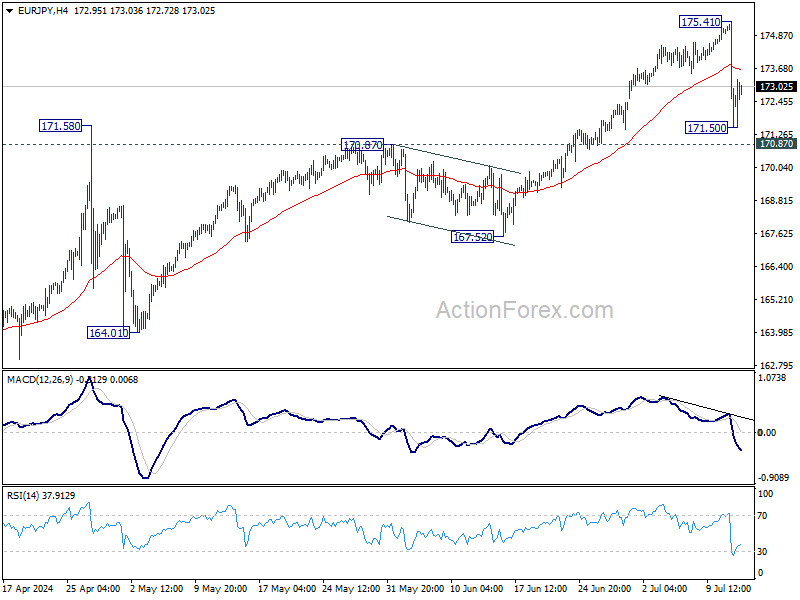
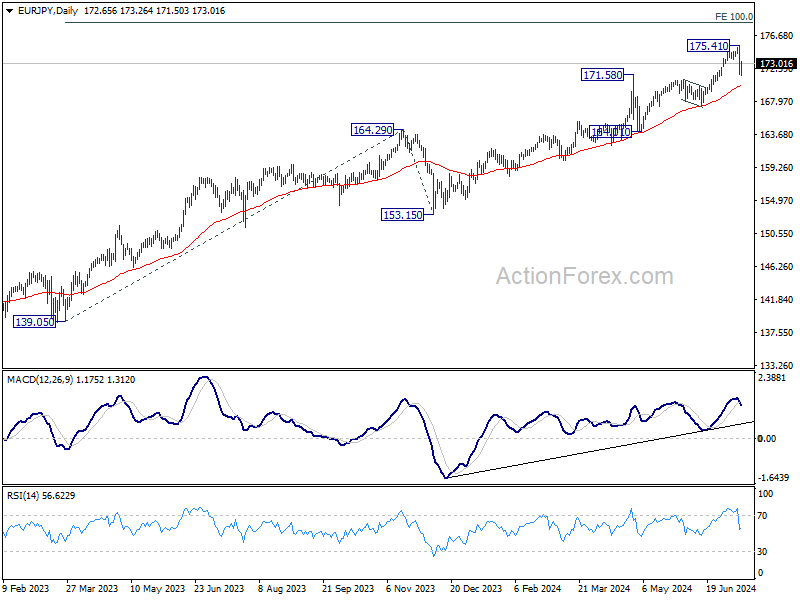
In the bigger picture, long term up trend is still in progress. Next target is 100% projection of 139.05 to 164.29 from 153.15 at 178.38. For now outlook will stay bullish as long as 170.87 resistance turned support holds, even in case of deep pullback. However, firm break of 170.87 will bring deeper fall to 167.52 support. Decisive break there will confirm that larger correction in in progress for 153.15/164.29 support zone.
EUR/GBP Daily Outlook
Daily Pivots: (S1) 0.8407; (P) 0.8422; (R1) 0.8430; More....
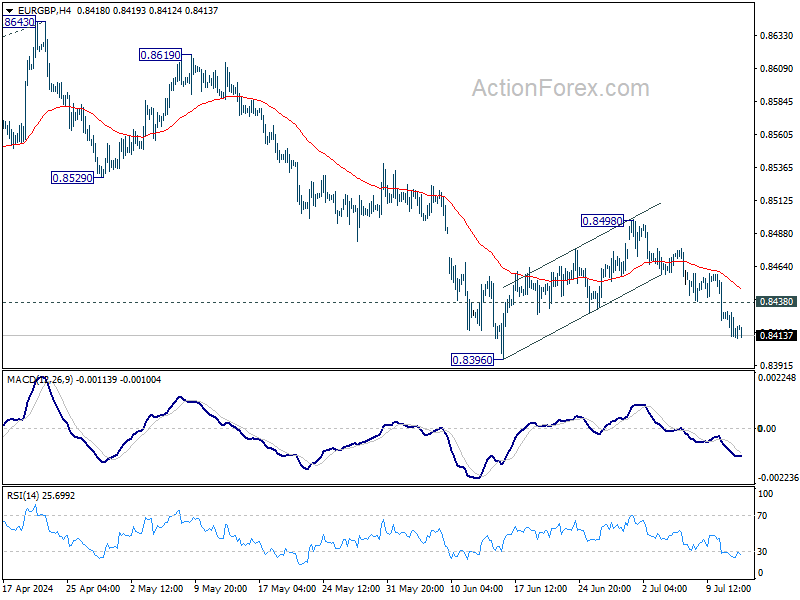
Intraday bias in EUR/GBP remains on the downside at this point. Corrective recovery form 0.8396 should have completed at 0.8498 after rejection by 55 D EMA. Deeper fall would be seen to retest 0.8396 support first. Firm break there will resume larger down trend. On the upside, above 0.8438 minor resistance will delay the bearish case and turn intraday bias neutral first.
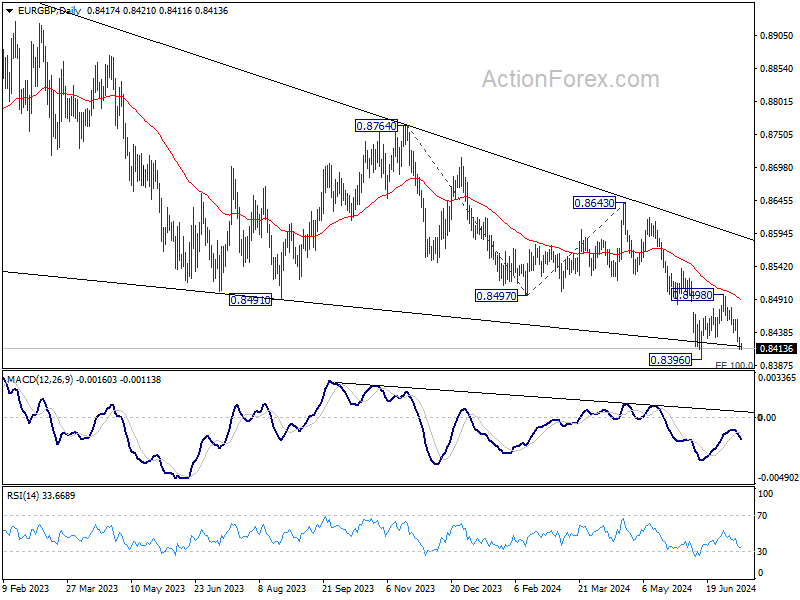
In the bigger picture, down trend from 0.9267 (2022 high) is in progress. Next target is 100% projection of 0.8764 to 0.8497 from 0.8643 at 0.8376. Sustained break there will target 161.8% projection at 0.8211 next. For now, outlook will remain bearish as long as 0.8643 resistance holds, even in case of stronger rebound.
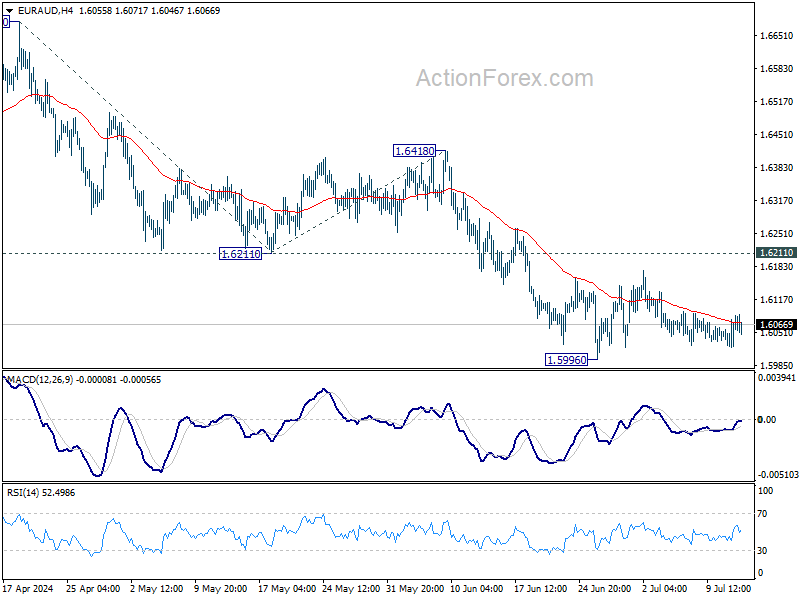
EUR/AUD Daily Outlook
Daily Pivots: (S1) 1.6038; (P) 1.6062; (R1) 1.6101; More...
EUR/AUD recovered ahead of 1.5996 low as consolidations continued. Intraday bias remains neutral first. Also, outlook stays bearish as long as 1.6211 support turned resistance holds. On the downside, break of 1.5996 will target 100% projection of 1.6679 to 1.6211 from 1.6418 at 1.5950. Firm break there will target 1.5846 key support next.
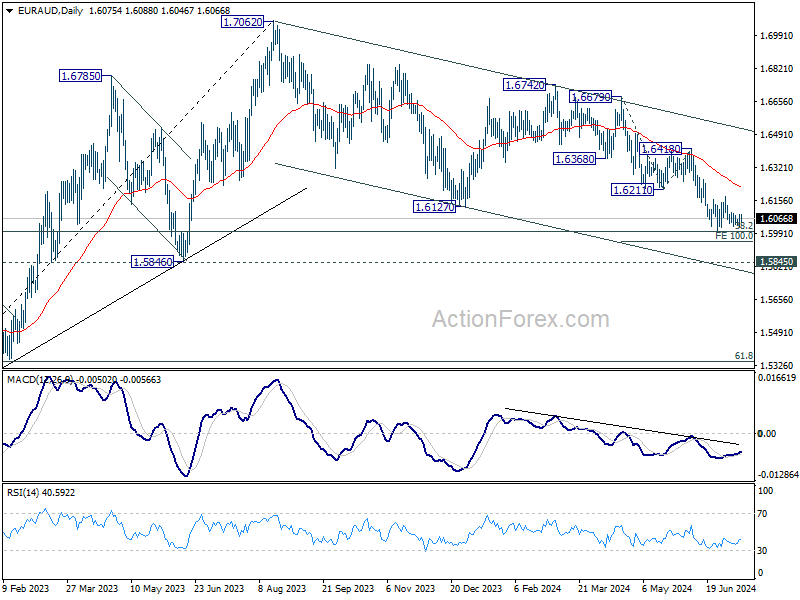
In the bigger picture, fall from 1.7062 medium term top is seen as a correction to the up trend from 1.4281 (2022 low) only. Strong support is still expected between 1.5846 and 38.2% retracement of 1.4281 to 1.7062 at 1.6000 to bring rebound. Break of 1.6148 resistance will argue that the correction has completed.
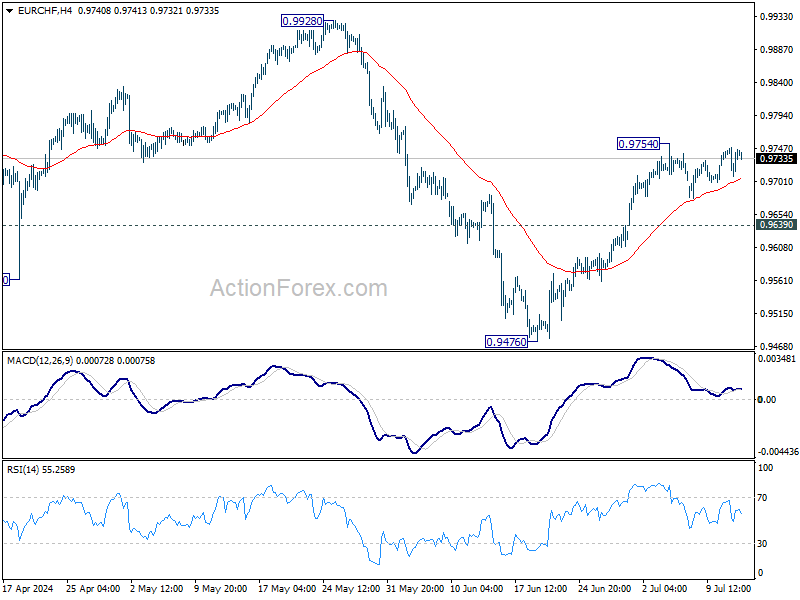
EUR/CHF Daily Outlook
Daily Pivots: (S1) 0.9717; (P) 0.9734; (R1) 0.9760; More....
Intraday bias in EUR/CHF remains neutral as consolidation continues below 0.9753. Another dip cannot be ruled out yet, but further rally is expected with 0.9639 support intact. On the upside, above 0.9754 will resume the rebound from 0.9476 to retest 0.9928 high. Nevertheless, break of 0.9639 will turn bias back to the downside for 0.9476 low instead.
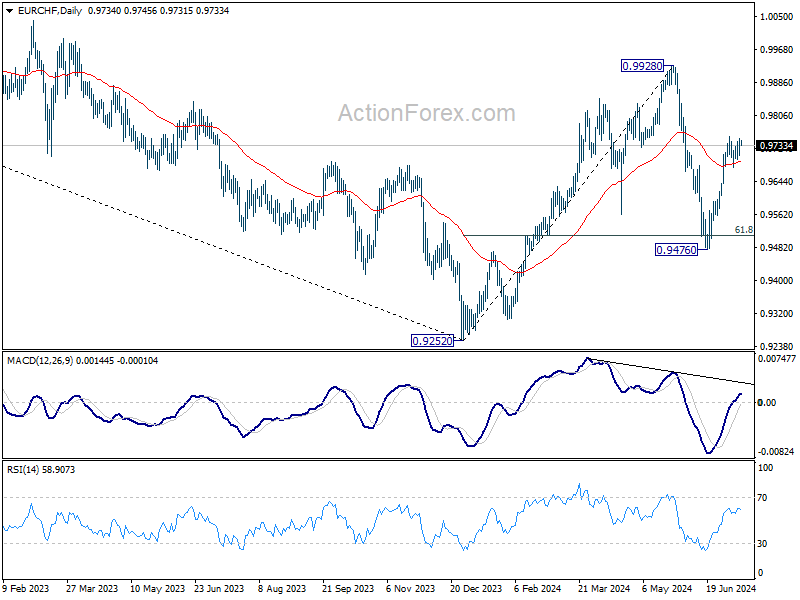
In the bigger picture, rebound from 0.9252 medium term bottom might not be completed yet. But even in case of resumption, strong resistance could emerge from 1.0095 to limit upside. Medium term outlook will be neutral at best as long as 1.0094 structural resistance holds. Meanwhile, break of 0.9476 will bring retest of 0.9252 low.
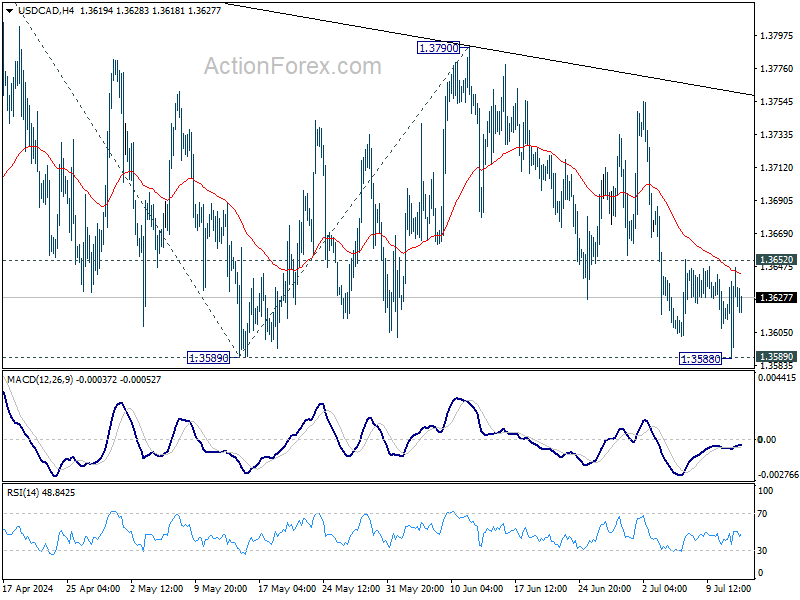
USD/CAD Daily Outlook
Daily Pivots: (S1) 1.3599; (P) 1.3623; (R1) 1.3658; More...
USD/CAD dipped to 1.3588 but recovered after hitting 1.3589 support. Intraday bias remains neutral first. Outlook is unchanged that corrective pattern from 1.3845 could extend. Break of 1.3589 will target 100% projection of 1.3845 to 1.3589 from 1.3790 at 1.3534. Strong support would be seen there to bring rebound. On the upside, above 1.3652 minor resistance will turn bias back to the upside for 1.3790 resistance instead.
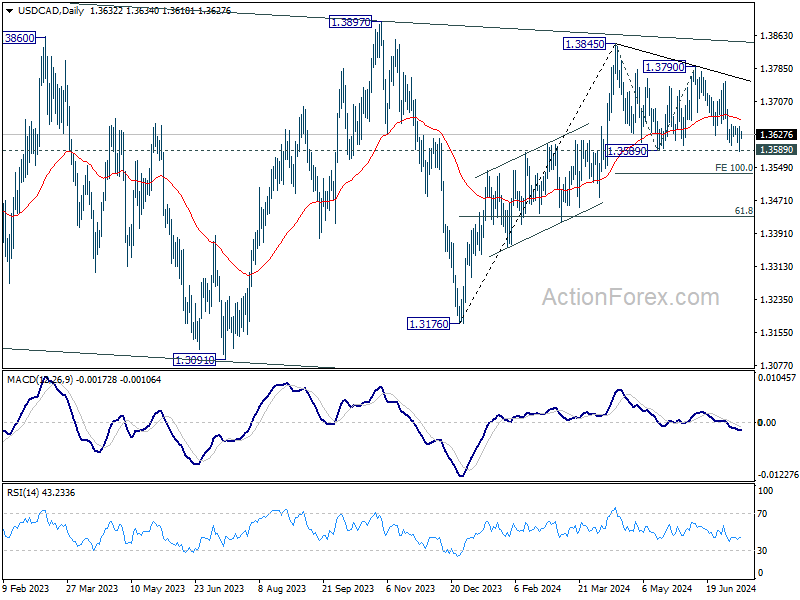
In the bigger picture, price actions from 1.3976 (2022 high) are viewed as a corrective pattern. In case of another fall, strong support should emerge above 1.2947 resistance turned support to bring rebound. Firm break of 1.3976 will confirm up resumption of whole up trend from 1.2005 (2021 low). Next target is 61.8% projection of 1.2401 to 1.3976 from 1.3176 at 1.4149.
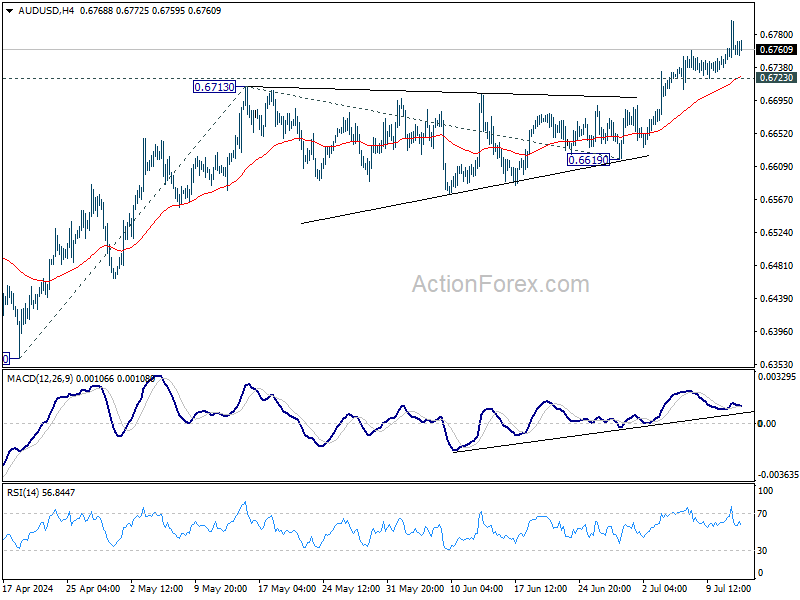
AUD/USD Daily Report
Daily Pivots: (S1) 0.6736; (P) 0.6767; (R1) 0.6792; More...
AUD/USD's rally is in progress and intraday bias remains on the upside for 61.8% projection of 0.6361 to 0.6713 from 0.6619 at 0.6837. Decisive break there could prompt upside acceleration through 0.6870 resistance to 100% projection at 0.6971. On the downside, however, break of 0.6723 support will turn intraday bias to the downside for deeper pullback.
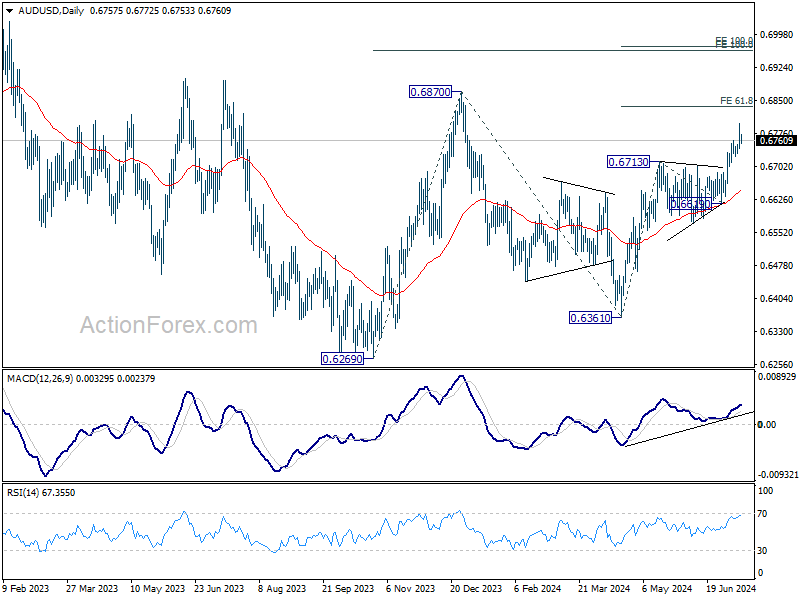
In the bigger picture, price actions from 0.6169 (2022 low) are seen as a medium term corrective pattern to the down trend from 0.8006 (2021 high). Fall from 0.7156 (2023 high) is seen as the second leg, which could have completed at 0.6269 already. Rise from there is seen as the third leg. Break of 0.6870 will target 100% projection of 0.6269 to 0.6870 from 0.6361 at 0.6962.
USD/JPY Daily Outlook
Daily Pivots: (S1) 156.97; (P) 159.37; (R1) 161.30; More...
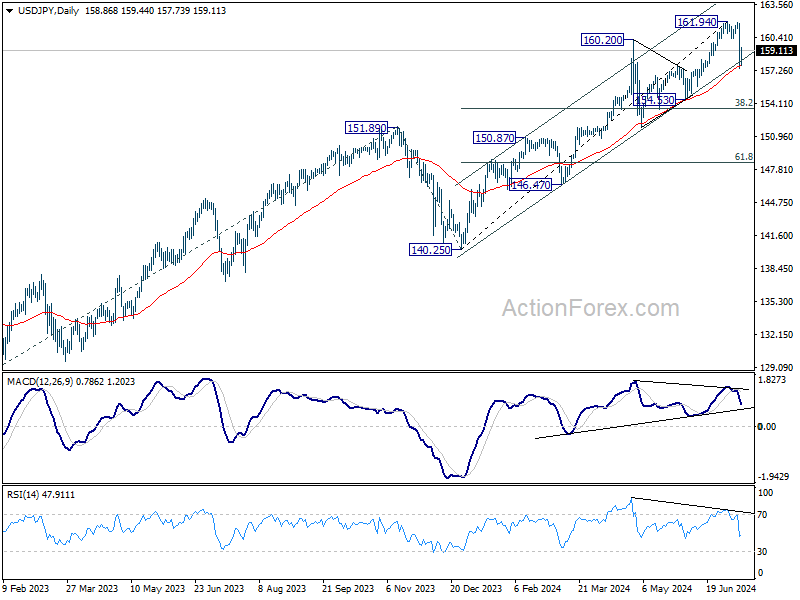
USD/JPY recovered after falling sharply to 157.41 but further decline is expected with 160.25 support turned resistance intact. Considering bearish divergence condition in D MACD, fall from 161.49 might already be correcting the whole five-wave rally from 140.25. Sustained break of 55 D EMA (now at 157.71) will affirm this bearish case. Next target will be 38.2% retracement of 140.25 to 161.94 at 163.65.
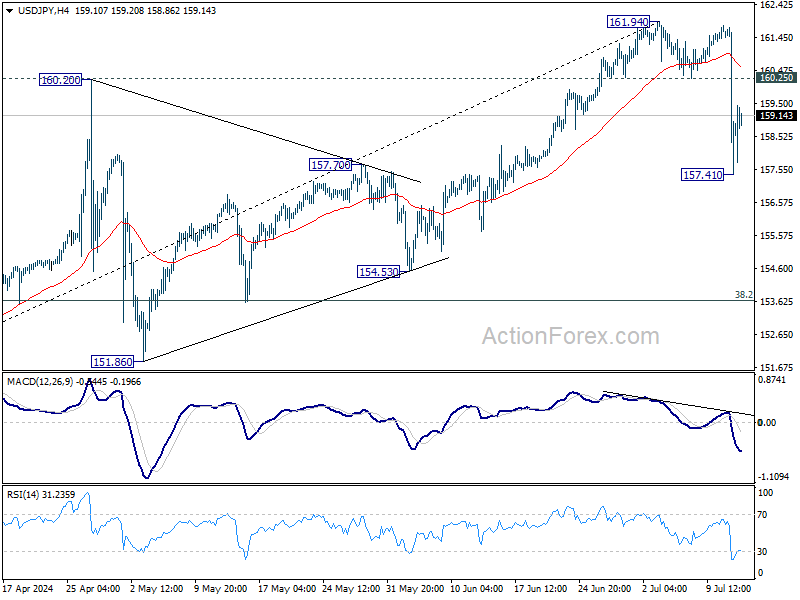
In the bigger picture, long term up trend is still in progress. Further rise is expected as long as 154.53 support holds. Next target is 100% projection of 127.20 (2023 low) to 151.89 (2023 high) from 140.25 at 164.94. However, sustained break of 154.53 will raise the chance of larger scale correction and target 140.25/151.89 support zone.
USD/CHF Daily Outlook
Daily Pivots: (S1) 0.8919; (P) 0.8961; (R1) 0.9007; More…
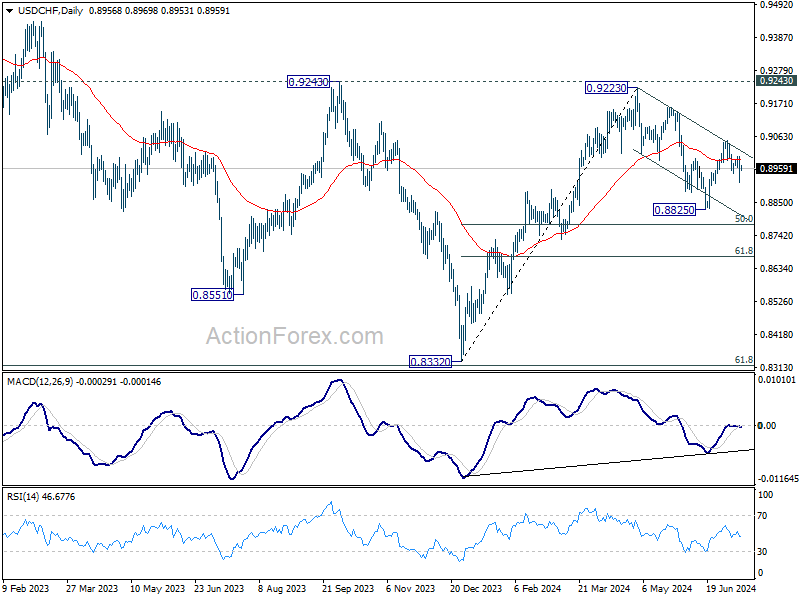
Further decline is expected in USD/CHF with 0.9000 resistance intact. Deeper decline would be seen to 0.88825 support. Fall from 0.9223 should be in progress with near term channel intact. Break of 0.8825 will target 50% retracement of 0.8332 to 0.9223 at 0.8778 next. However, break of 0.9000 will turn bias back to the upside for 0.9049 resistance instead.
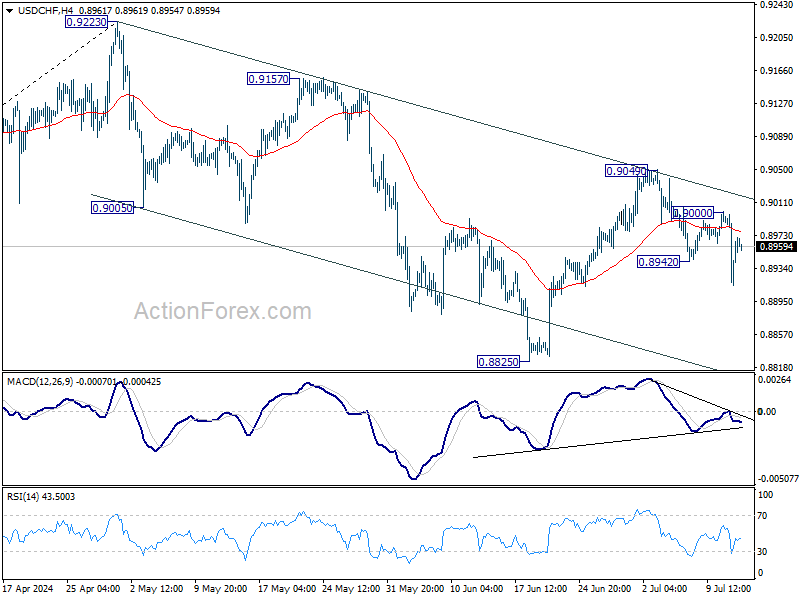
In the bigger picture, focus remains on 0.9223/9243 resistance zone. Decisive break there would suggest larger bullish trend reversal and turn outlook bullish. Nevertheless, rejection by 0.9223/43 will keep medium term outlook neutral at best, for more range trading between 0.8332/9243 first.
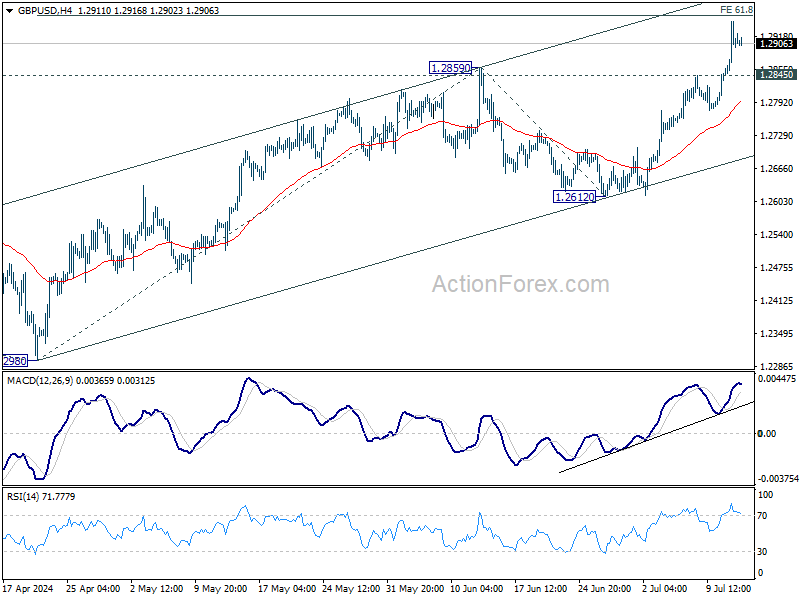
GBP/USD Daily Outlook
Daily Pivots: (S1) 1.2858; (P) 1.2903; (R1) 1.2960; More...
Intraday bias in GBP/USD remains on the upside for 61.8% projection of 1.2298 to 1.2859 from 1.2612 at 1.2959. Decisive break there would prompt upside acceleration through 1.3141 resistance to 100% projection at 1.3173. On the downside, below 1.2845 resistance turned support will turn intraday bias neutral first.
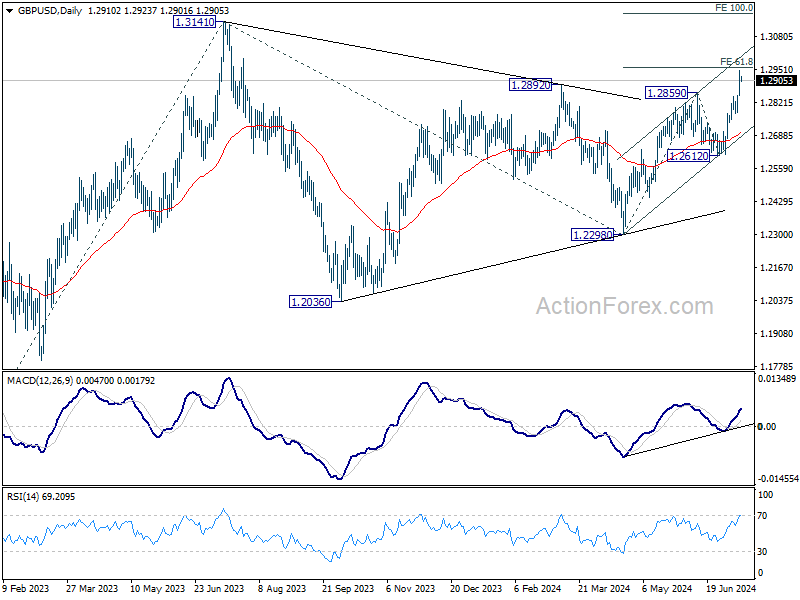
In the bigger picture, price actions from 1.3141 medium term top are seen as a corrective pattern which might have completed with three waves to 1.2298 already. This will now remain the favored case as long as 1.2612 support holds. Firm break of 1.3141 will target 61.8% projection of 1.0351 (2022 low) to 1.3141 (2023 high) from 1.2298 at 1.4022.
Soft US CPI Boosts Reflation Trade
I don’t know for the Federal Reserve (Fed) but investors definitely got to the evidence that inflation is on a right path to justify a Fed rate cut sooner rather than later yesterday after the latest CPI report printed a slower-than-expected figures both for headline and core inflation, both on a monthly and on a yearly basis. The US 2-year yield fell by another 10bp chunk to around 4.50% and the 10-year yield tipped a toe below 4.17% before bouncing back above the 4.20% mark. Activity on Fed funds futures showed that the probability of a September rate cut soared up to 95% and is holding near 92.5% this morning, while this probability was less than 75% at the same time yesterday morning. The US dollar index sank shortly below its 200-DMA. From a technical perspective, the index is still in the bullish trend, above 104.20 - the major 38.2% Fibonacci retracement on this year’s rebound, yet we now have a stronger case building for a sustainably decline below this level.
The sharp dollar selloff sent the US dollar meaningfully higher against most currencies but the Japanese yen particularly attracted attention after the USDJPY tanked from near 162 to below 159 level in a single move. The move sparked speculation that the Bank of Japan (BoJ) may have stepped in and took the opportunity to exacerbate the negative move. Some news outlet backed the rumours while the BoJ officials kept silent. Not knowing whether yesterday’s yen purchases were or were not fueled by the BoJ makes intervention significantly more effective as traders simply don’t know if – by buying the dip – they are betting against the BoJ, which has only limited sources to make such interventions, or they are betting against thousands of buyers who have the power to overhaul the market. As a result, we don’t know, but the USDJPY is trading below 160 this morning.
In the UK, the pound was already bid yesterday morning after stronger-than-expected growth data helped traders scale back the expectation of an August cut from 70% to a coin toss. Combined with rising hawkish voices at the Bank of England (BoE), waning political risks and softening US dollar, we could see Cable make an attempt on the 1.30 level. But the fact that the BoE hawks cry louder doesn’t mean that the doves are not around…
Across the Channel, the EURUSD advanced to 1.09 yesterday. The single currency got a further support from the French finance minister Bruno Le Maire’s pressing with planned spending cuts to reassure the EU and the markets that France will comply with the EU rules and not let the debt explode following a government change, while the Bank of France Chief Francois Villeroy warned against increasing the government debt and taxes for companies. The fiscal and monetary policymakers joint efforts seem to be paying off with the French 10-year yield back to levels when Macron had called for the snap election and the CAC 40 is again testing the 200-DMA offers to the upside on lower yields and on a revived reflation trade on rising Fed cut expectations.
Interestingly, the S&P500 and Nasdaq fell sharply yesterday after the US CPI data. The sharp rise in Fed rate cut bets and falling yields looked like they didn’t give support to the major US indices, but they did. The S&P500’s equal weight index jumped 1.20%. Almost 400 stocks within the S&P500 gained yesterday, all sectors gained except for technology – and consumer staples as it was dragged down by Amazon, but most stocks in the S&P500 cheered the news. The Russell 2000 soared more than 3.5% to this year’s peak level that was reached by the end of March. Oil gained, gold jumped past the $2400 level as lower yields decreased the opportunity cost of holding the non-interest bearing metal while SPDR’s metals & mining ETF jumped 2.74%. So the flight from Big Technology to other sectors, the reflation trade, was big like a mountain at yesterday’s trading session. But it also came as a proof that, no matter how hard the other sectors rally, if the bleeding in Big Tech stocks is not contained, the major indices will suffer.
Inside Tech, Nvidia lost more than 5.5% as investors left the safety of Big Tech which are rate-proof thanks to AI, MAMAA stocks fell 2.77% while Tesla dived almost 8.5% as the selloff was amplified by the news that the company will delay revealing details on its robotaxi from August to October and use the additional weeks to build additional prototypes. It sounded like the prototypes that they have in hand are not good enough to keep investors dreaming. Note that, Tesla’s stock price rallied 11-day in a row after Elon Musk pointed at August 8th robotaxi reveal, let’s see how many days of selloff the delay will cause.
Today, attention shifts to earnings. The US big banks will open the dance today. Shares of big US big banks outperformed the S&P500 this year. But the Q2 results may look mixed as the interest rate environment wasn’t favourable due to rise in yields, the net interest income may have remained limited due to sluggish loan growth, the non interest revenues were probably mixed due to slowing economic activity and credit is a place to watch given the fears around the commercial real estate but investors could look past the rate-related worries as the Fed is now expected to announce the first rate cut as early as September and cut three times before the year ends.