

Sample Category Title
US: Inflationary Pressures Cool Faster than Expected in June, Bolstering Case for September Rate Cut
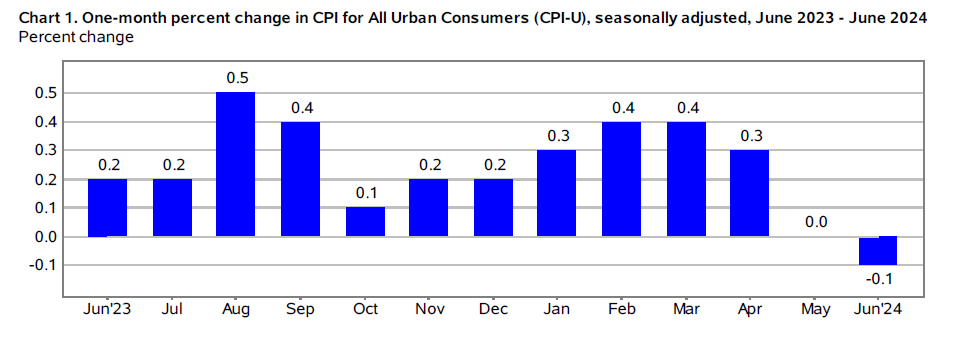
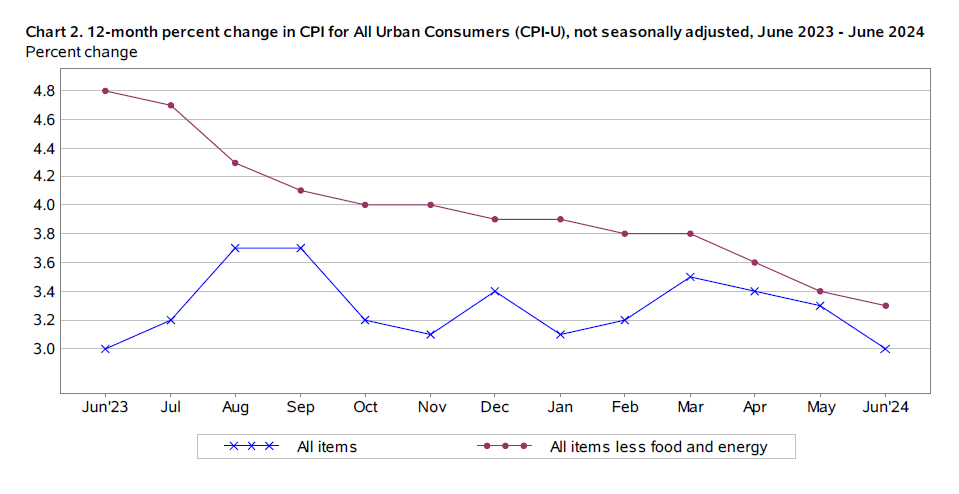
The Consumer Price Index (CPI) fell 0.1% month-on-month (m/m), below the consensus forecast calling for a modest 0.1% gain. On a twelve-month basis, CPI edged lower by 0.3 percentage points to 3.0%.
- Lower energy prices – largely attributed to a 3.7% decline in gasoline prices – helped to push down on the headline measure. Grocery store prices were up 0.2% on the month and are up a subdued 1.6% y/y.
Excluding food and energy, core prices rose a modest 0.1%, a deceleration from May's already soft 0.16% gain, and considerably below the hotter 0.37% monthly readings averaged through the first three months of the year. The twelve-month change on core slipped by a tenth of a percentage point to 3.3% – the smallest 12-month increase since April 2021.
Core services prices rose by a very subdued 0.1% – its weakest monthly gain since August 2021. This was the result of a notable deceleration in shelter costs – rising 0.2% after averaging monthly gains of 0.4% over the past twelve-month period – and an outright decline in the 'supercore' measure (-0.2%). Notable declines were seen across transportation – largely driven by a sharp 5% pullback in airfares – and recreational services.
Core goods prices fell by a modest 0.1%, thanks to a further pullback in both new (-0.2%) and used (-1.5%) vehicle prices.
Key Implications
This is exactly what the FOMC is looking for. Not only did the supercore measure slip into deflationary territory, but the long-awaited adjustment lower on shelter prices also appears to be underway, while core goods prices also continued to edge lower. Encouragingly, the three-month annualized rate of change on core inflation fell sharply to 2.1% – the softest reading since March 2021.
Speaking at his semiannual Congressional testimony earlier this week, Chair Powell described the May inflation report as 'very good', which would make this morning's report excellent. Should the next two inflation readings remain on the softer side, a September rate cut looks to be very much in play.
USD/JPY Mid-Day Outlook
Daily Pivots: (S1) 161.38; (P) 161.59; (R1) 161.93; More...
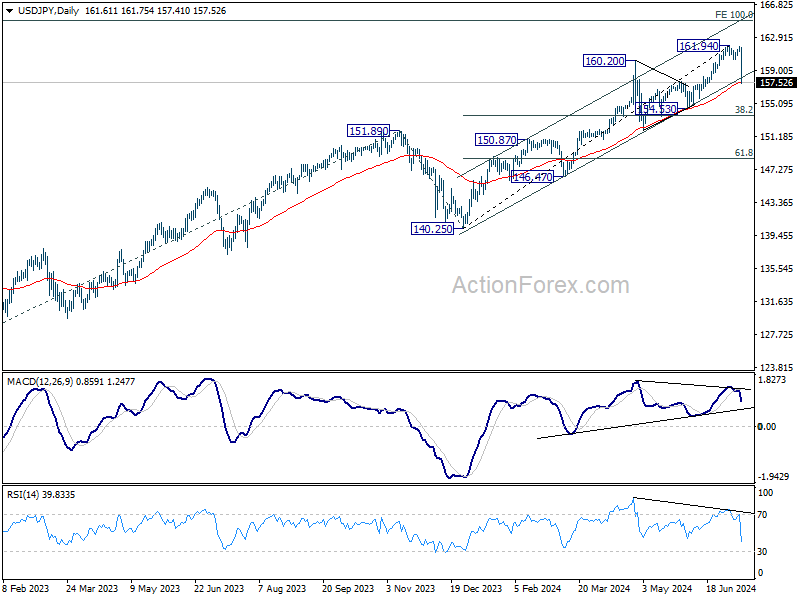
USD/JPY declines sharply in early US session and breaks 160.25 support decisively. Considering bearish divergence condition in D MACD, fall from 161.49 might already be correcting the whole five-wave rally from 140.25. Intraday bias is back on the downside. Sustained break of 55 D EMA (now at 157.62) will affirm this bearish case. Next target will be 38.2% retracement of 140.25 to 161.94 at 163.65. Meanwhile, rise will now stay on the downside as long as 160.25 support turned resistance holds, in case of recovery.
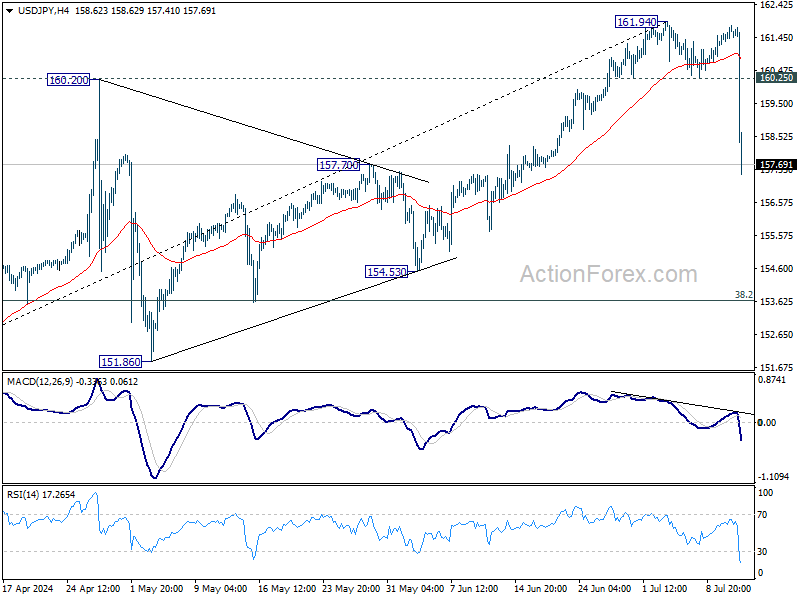
In the bigger picture, long term up trend is still in progress. Further rise is expected as long as 154.53 support holds. Next target is 100% projection of 127.20 (2023 low) to 151.89 (2023 high) from 140.25 at 164.94. However, sustained break of 154.53 will raise the chance of larger scale correction and target 140.25/151.89 support zone.
Fed Sep Cut Now Realistic after US CPI; Japan Intervenes to Boost Yen?
Dollar tumbled sharply in early US session following lower-than-expected consumer inflation readings. Headline CPI showed its first month-over-month decline since early 2023, while core CPI annual rate unexpectedly slowed to its lowest level since April 2021. Now, a September Fed rate cut is becoming a realistic possibility. Fed fund futures are quick to react and are pricing in near 90% chance of that. Indeed, Fed policymakers might start to rethink whether there would be one rate cut or two rate cuts this year.
Simultaneously, Yen surged across the board following US CPI data. The scale of Yen's rally against other currencies suggests that Japan might be capitalizing on the current Dollar weakness to intervene and reverse some of Yen's extended depreciations. Japan has been clear about its readiness to intervene at any time of the day. Also, it has record of acting in the markets strategically, and today's US CPI data gives it a golden opportunity to act. Now, focus is on whether Yen's rebound would spiral further higher with other market participants joining in.
Elsewhere in the currency markets, Sterling is currently the second strongest performer. The pound initially led the pack with a rally on stronger-than-expected UK GDP data but has been overshadowed by the ultra-strong Yen. Dollar is the weakest, followed by Canadian Dollar. Other major currencies are finding their positions amid the current high volatility.
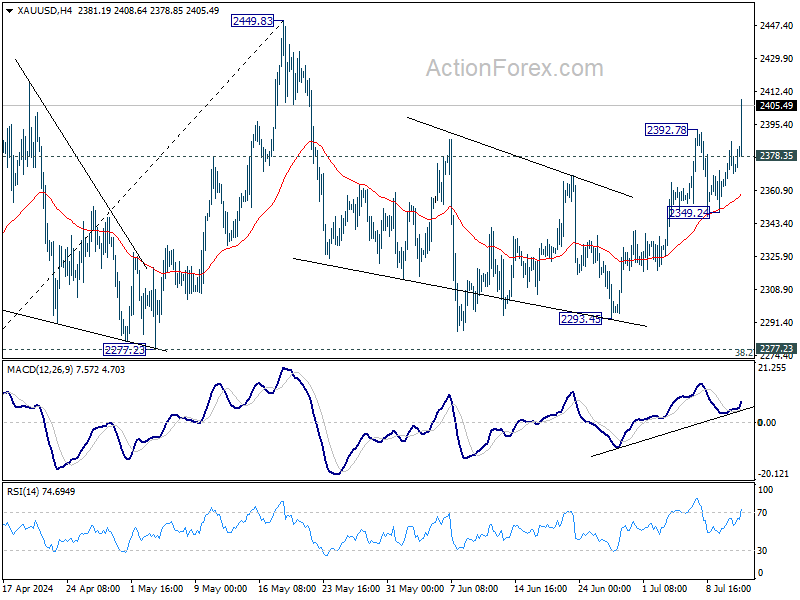
Technically, Gold rally from 2293.45 resumed by breaking through 2392.78 resistance. Current development affirms that case that correction from 2449.83 has completed. Further rise is expected as long as 2378.35 minor support holds. Decisive break of 2449.83 will confirm larger up trend resumption.
In Europe, at the time of writings, FTSE is up 0.36%. DAX is up 0.72%. CAC is up 0.86%. UK 10-year yield is down -0.037 at 4.097. Germany 10-year yield down -0.046 at 2.490. Earlier in Asian, Nikkei rose 0.94%. Hong Kong HSI rose 2.06%. China Shanghai SSE rose 1.06%. Singapore Strait Times rose 0.44%. Japan 10-year JGB yield fell -0.0039 to 1.084.
US core CPI slows to 3.3%, lowest since Apr 2021
In June, US CPI fell -0.1% mom, versus expectation of 0.1% mom rise. Core CPI (all items less food and energy) rose 0.1% mom, below expectation of 0.2% mom rise. Energy index fell -2.0% mom while food index rose 0.2% mom.
For the 12-month period, headline CPI slowed from 3.3% yoy to 3.0%yoy, below expectation of 3.1% yoy. Core CPI slowed from 3.4% yoy to 3.3% yoy, below expectation of being unchanged at 3.4% yoy. Core CPI was also the lowest since April 2021. Energy index was up 1.0% yoy while food index was up 2.2% yoy.
US initial jobless claims falls to 222k vs exp 239k
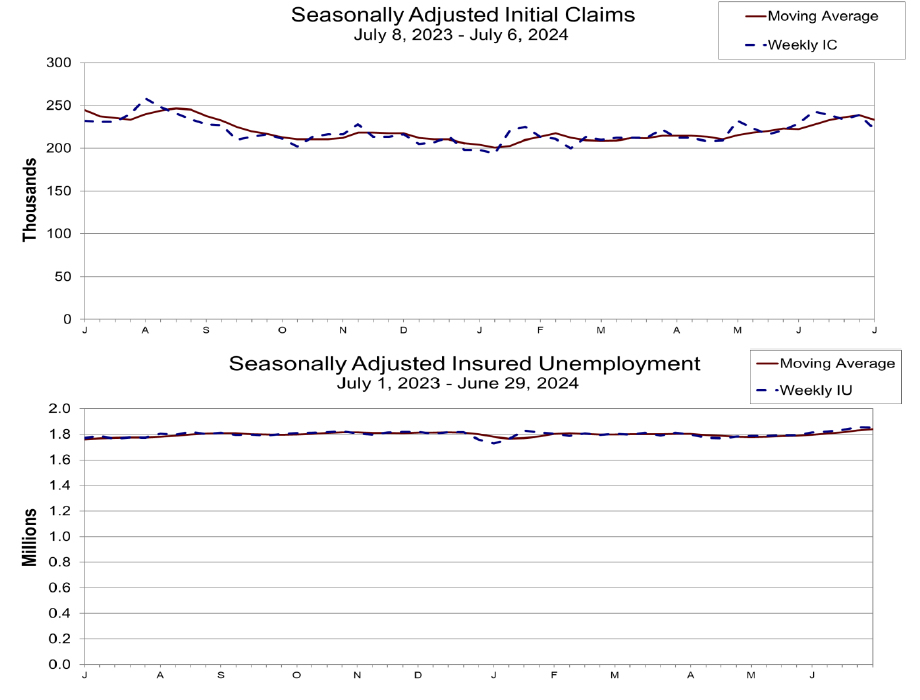
US initial jobless claims fell -17k to 222k in the week ending July 6, below expectation of 239k. Four-week moving average of initial claims fell -4k to 233.5k.
Continuing claims fell -4k to 1852k in the week ending June 29. Four-week moving average of continuing claims rose 10k to 1840k, highest since December 4, 2021.
UK GDP grows 0.4% mom in May, driven by services
UK GDP grew by 0.4% mom in May, surpassing expectations of 0.2% mom increase. The primary driver of this growth was a 0.3% mom rise in services output, which significantly contributed to the overall monthly GDP increase. Additionally, production output grew by 0.2% mom , while construction output saw a substantial jump of 1.9% mom.
On a broader scale, real GDP is estimated to have grown by 0.9% in the three months leading up to May compared to the previous three months ending in February. This growth was predominantly driven by a 1.1% increase in services output. However, production remained stagnant with no growth, and construction output declined by -0.7%.
USD/JPY Mid-Day Outlook
Daily Pivots: (S1) 161.38; (P) 161.59; (R1) 161.93; More...
USD/JPY declines sharply in early US session and breaks 160.25 support decisively. Considering bearish divergence condition in D MACD, fall from 161.49 might already be correcting the whole five-wave rally from 140.25. Intraday bias is back on the downside. Sustained break of 55 D EMA (now at 157.62) will affirm this bearish case. Next target will be 38.2% retracement of 140.25 to 161.94 at 163.65. Meanwhile, rise will now stay on the downside as long as 160.25 support turned resistance holds, in case of recovery.
In the bigger picture, long term up trend is still in progress. Further rise is expected as long as 154.53 support holds. Next target is 100% projection of 127.20 (2023 low) to 151.89 (2023 high) from 140.25 at 164.94. However, sustained break of 154.53 will raise the chance of larger scale correction and target 140.25/151.89 support zone.
Economic Indicators Update
| GMT | Ccy | Events | Actual | Forecast | Previous | Revised |
|---|---|---|---|---|---|---|
| 23:01 | GBP | RICS Housing Price Balance Jun | -17% | -14% | -17% | |
| 23:50 | JPY | Machinery Orders M/M May | -3.20% | 1.00% | -2.90% | |
| 01:00 | AUD | Consumer Inflation Expectations Jul | 4.30% | 4.40% | ||
| 06:00 | EUR | Germany CPI M/M Jun F | 0.10% | 0.10% | 0.10% | |
| 06:00 | EUR | Germany CPI Y/Y Jun F | 2.20% | 2.20% | 2.20% | |
| 06:00 | GBP | GDP M/M May | 0.40% | 0.20% | 0.00% | |
| 06:00 | GBP | Industrial Production M/M May | 0.20% | 0.30% | -0.90% | |
| 06:00 | GBP | Industrial Production Y/Y May | 0.40% | 0.60% | -0.40% | -0.70% |
| 06:00 | GBP | Manufacturing Production M/M May | 0.40% | 0.30% | -1.40% | -1.60% |
| 06:00 | GBP | Manufacturing Production Y/Y May | 0.60% | 1.20% | 0.40% | -0.40% |
| 06:00 | GBP | Goods Trade Balance (GBP) May | -17.9B | -16.1B | -19.6B | -19.4B |
| 12:30 | USD | Initial Jobless Claims (Jul 5) | 222K | 239K | 238K | 239K |
| 12:30 | USD | CPI M/M Jun | -0.10% | 0.10% | 0.00% | |
| 12:30 | USD | CPI Y/Y Jun | 3.00% | 3.10% | 3.30% | |
| 12:30 | USD | CPI Core M/M Jun | 0.10% | 0.20% | 0.20% | |
| 12:30 | USD | CPI Core Y/Y Jun | 3.30% | 3.40% | 3.40% | |
| 14:30 | USD | Natural Gas Storage | 56B | 32B |
US initial jobless claims falls to 222k vs exp 239k
US initial jobless claims fell -17k to 222k in the week ending July 6, below expectation of 239k. Four-week moving average of initial claims fell -4k to 233.5k.
Continuing claims fell -4k to 1852k in the week ending June 29. Four-week moving average of continuing claims rose 10k to 1840k, highest since December 4, 2021.
US core CPI slows to 3.3%, lowest since Apr 2021
In June, US CPI fell -0.1% mom, versus expectation of 0.1% mom rise. Core CPI (all items less food and energy) rose 0.1% mom, below expectation of 0.2% mom rise. Energy index fell -2.0% mom while food index rose 0.2% mom.
For the 12-month period, headline CPI slowed from 3.3% yoy to 3.0%yoy, below expectation of 3.1% yoy. Core CPI slowed from 3.4% yoy to 3.3% yoy, below expectation of being unchanged at 3.4% yoy. Core CPI was also the lowest since April 2021. Energy index was up 1.0% yoy while food index was up 2.2% yoy.
Pound on the Offensive
Positive news for the Pound, beyond the fact that England will play in the Euro-24 final. The monthly estimate showed that the economy grew by 0.4% in May (twice as much as expected) and that growth in the last three months accelerated to 1% year-on-year. That’s the fastest pace since early 2023, although it’s about half of what it was before the pandemic hit.
The services sector continued to drive growth, adding 1.1% over three months. Meanwhile, the construction sector added 1.9% in May (vs 0.5% expected), shifting from -2.1% y/y to +0.8% over the month. Construction and services are non-tradable sectors, and the current situation points to very healthy domestic demand.
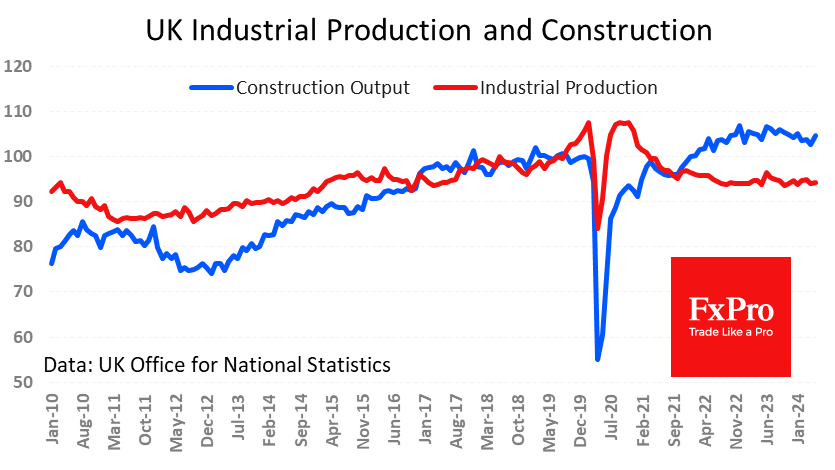
It’s a different story for industry and trade. Industrial production rose by 0.2% in May, a slight rebound after a 0.9% drop in the previous month. The year-over-year gain is 0.4%, extending the index’s stagnation to almost two years after two years of decline.
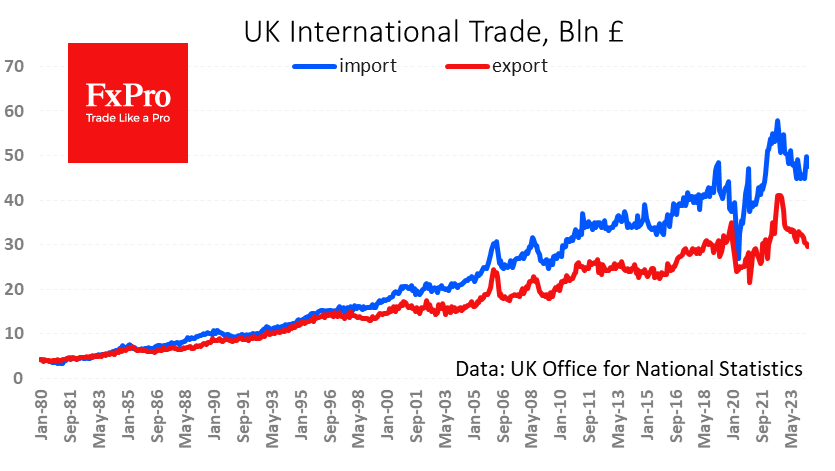
There is also disappointment in the performance of foreign trade, with the value of exports falling to its lowest level since January 2022 at £29.6 billion, the level the UK saw five to six years ago. Imports fell over the month but remain high by historical standards at 47.5B, which is 10% above the average five to six years ago.
So, the current monetary regime moderately restricts services and construction but suppresses industrial production and exports. Inflation is the Bank of England’s priority, so the continued expansion of the services and construction sectors, which together account for around 90% of GDP, may force the central bank to tighten monetary policy in the coming quarters.
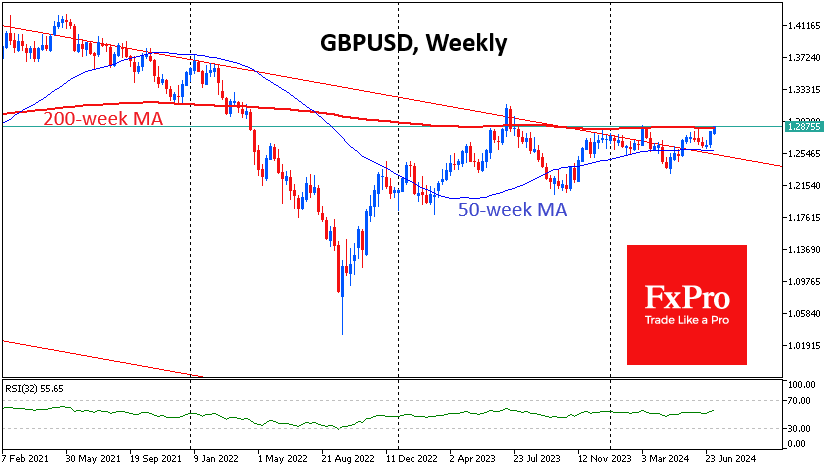
This news is a driver for the pound as it tests 12-month highs and a key long-term trend line, the 200-week moving average against the dollar. A potential break above this resistance could open the way to the next leg of the 1.35-1.40 range.
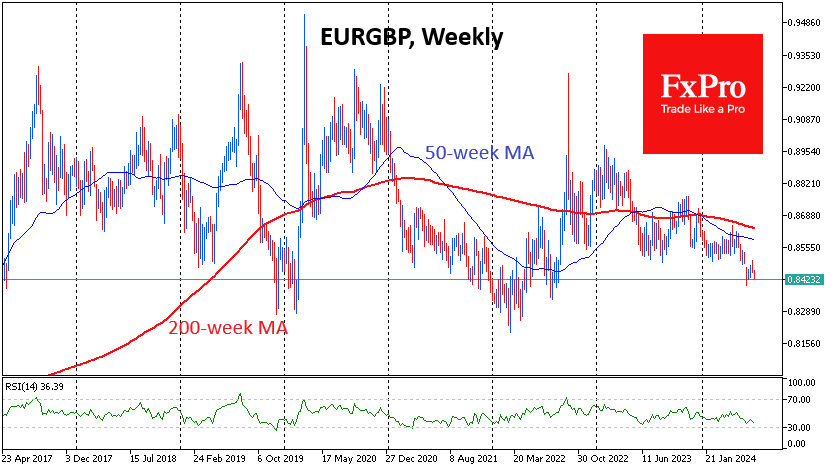
Just as much attention is being paid to the EURGBP, which is making its second plunge to 2-year lows in a month and looks vulnerable to further Euro retreats ahead of the Pound. The pair is now trading near 0.8420 with the potential to test 0.8300, the lower boundary of the important 8-year range.
GBP/USD: Stronger than Expected UK GDP Numbers Lift Cable to Four-Month High
Cable hit new four-month high in European trading on Thursday, lifted by better than expected UK May GDP numbers, which poured cold water on expectations for BoE rate cut next month.
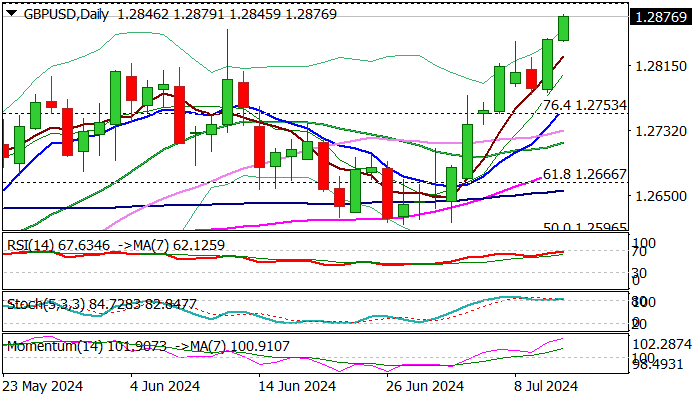
Fresh strength broke through pivotal barriers at 1.2846/60 (200WMA/former top June 12) and pressuring key barrier at 1.2893 (2024 high, posted on March 8).
Firmly bullish technical picture on daily chart (Tenkan/Kijun-sen forming a bull-cross and bullish momentum is strengthening) support the action, though headwinds on approach to 1.2893 could be expected, due to overbought conditions and significance of barrier.
Markets shift focus towards release of US June inflation report which is expected to provide fresh signals.
Weaker than expected US CPI numbers would further boost pound as further easing in consumer prices would bring the Fed one step closer to rate cut and subsequently deflate dollar.
Cable could accelerate through 1.2900 and probably challenge psychological 1.30 barrier, in case of stronger CPI downside miss.
Conversely, bulls may lose traction if US price pressures rise in June.
Session low (1.2845) offer initial support, followed by 1.2800/1.2780 (psychological / daily higher base and 1.2760/53 (rising 10DMA / broken Fibo 76.4% of 1.2893/1.2299).
Res: 1.2893; 1.2900; 1.2950; 1.3000.
Sup: 1.2845; 1.2800; 1.2780; 1.2753.
GBP/USD Hits 4-month High on Strong GDP
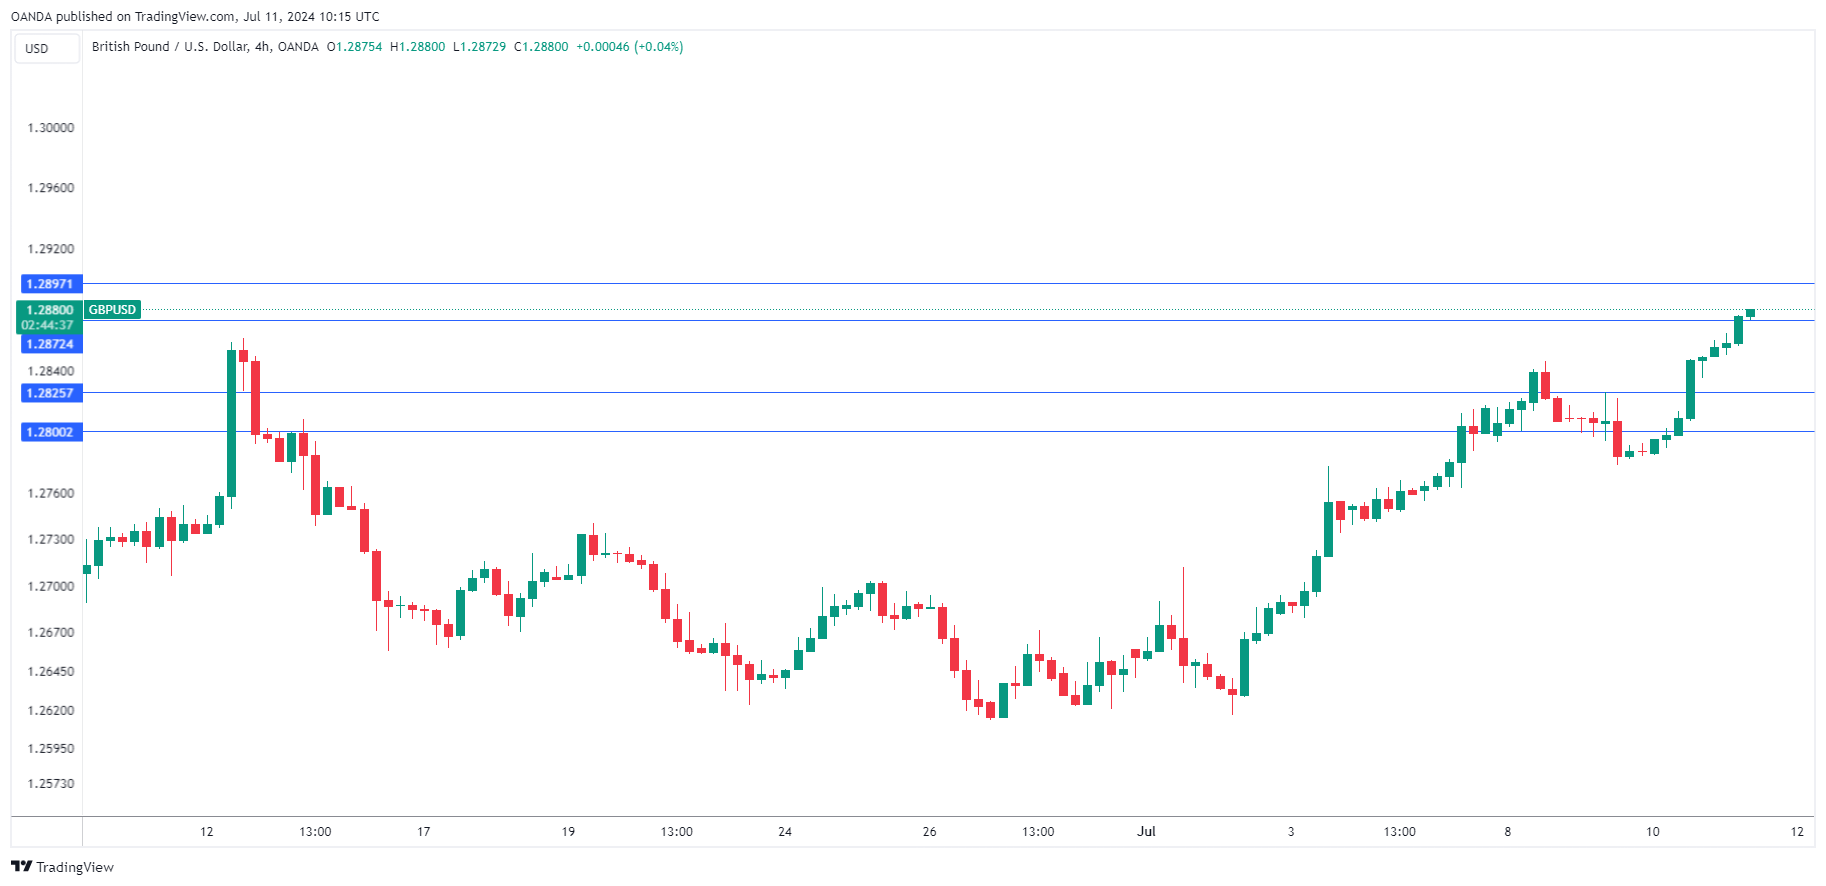
The British pound has extended its gains on Thursday. GBP/USD is trading at 1.2876 in the European session, up 0.22% on the day.
UK GDP beats expectations
The sun is shining in London today and there’s plenty to smile about besides the pleasant weather. England has punched their ticket to the final of the Euro football tournament and UK GDP was stronger than expected. The British pound headed higher and has hit its highest level since March 8.
The UK economy is showing signs of a rebound after slipping into a recession in the second half of 2023. Annualized GDP jumped 1.4% in May, up from a revised 0.6% in April and beating the 1.2% market estimate. Monthly, GDP improved to 0.4% after zero growth in April and above the market estimate of 0.2%.
The weather has played a significant role in the improved data. April was unusually rainy, which dampened consumer spending. May, however, was the warmest on record which revitalized retail sales.
Inflation has declined dramatically, from 11.1% in October 2022 down to 2% in May, matching the Bank of England’s inflation target. This has raised expectations that the BoE will deliver a rate cut but the central bank remains cautious. The BoE meets next on August 1 and markets expectations are a 50/50 coin toss as to whether the Bank will hold or take the plunge and lower rates.
In the US, Federal Reserve Chair Powell wrapped up two days of testimony before US lawmakers. Powell signaled that the Fed was moving closer to a rate cut decision but it was too early to declare victory over inflation and said “more good data” was needed before the Fed would feel confident lowering rates.
GBP/USD Technical
- GBP/USD is testing resistance at 1.2872. Above, there is resistance at 1.2897
- 1.2825 and 1.2800 are the next support levels
USD/CAD Price Outlook: 200-day MA Holds Ahead of US CPI Release
- USD/CAD has been range-bound, reflecting US Dollar Index consolidation and potential rate differential between Canada and the US.
- Canada’s volatile inflation and struggling labor market increase pressure on the Bank of Canada (BoC).
- USD/CAD is positioned between key moving averages, with a tight range suggesting a potential breakout following the inflation data.
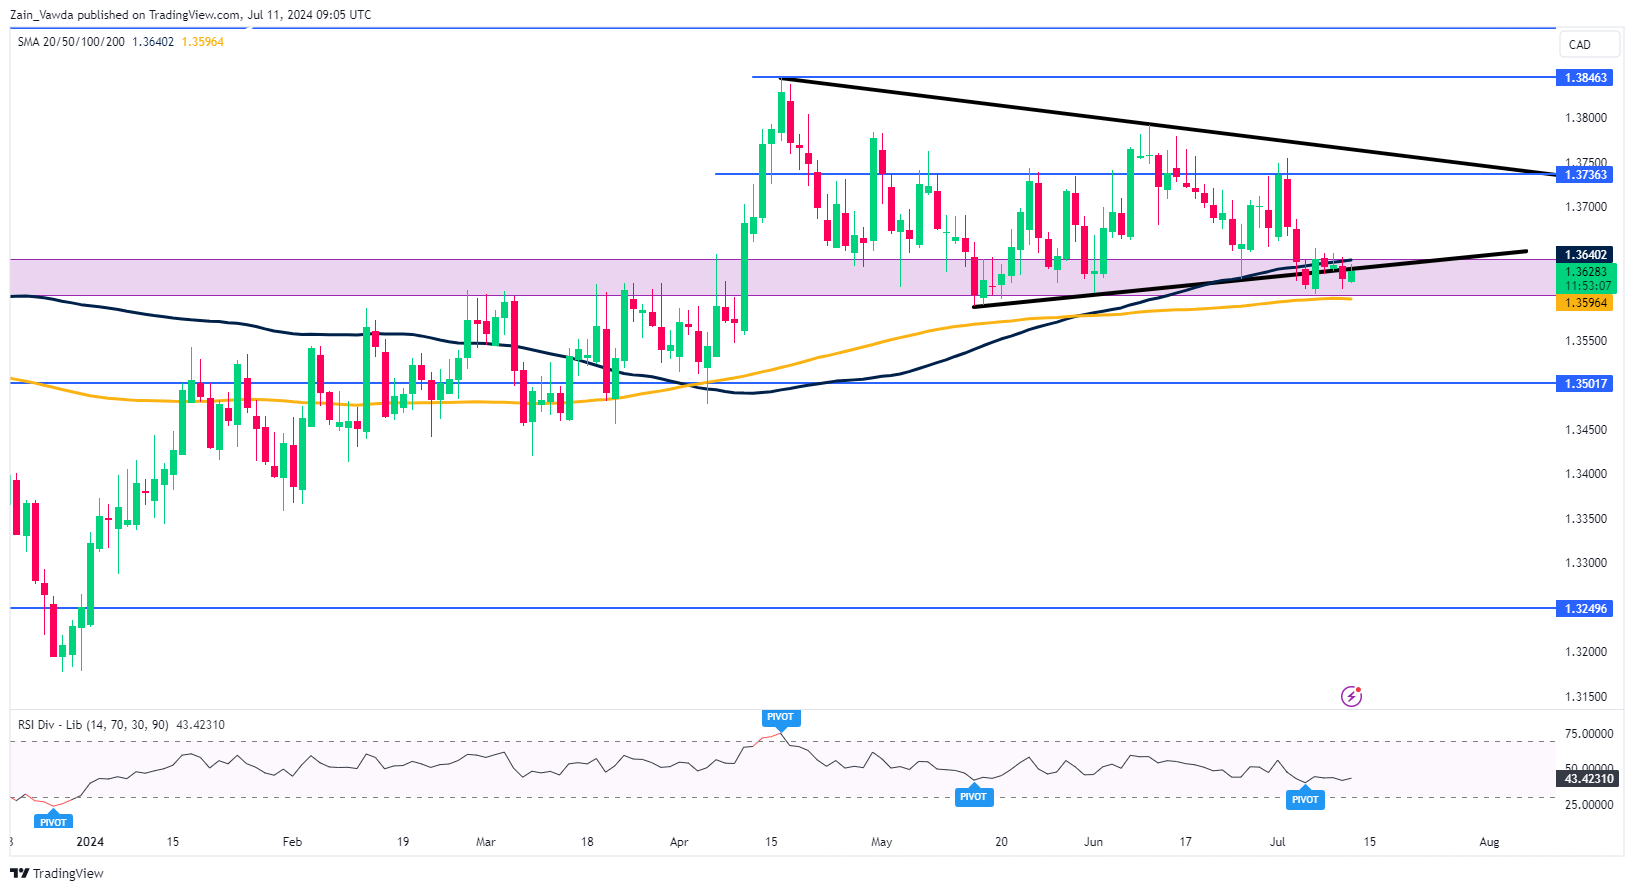
USD/CAD has been confined to a 50-pip range since July 4, reflecting the historical price action and recent consolidation of the US Dollar Index.
The potential for a rate differential between Canada and the US is growing. The US economy has experienced three consecutive declines in headline inflation, contrasting with Canada’s choppy inflation since February, where declines have alternated with increases. This volatility poses a significant challenge for the Canadian Central Bank.
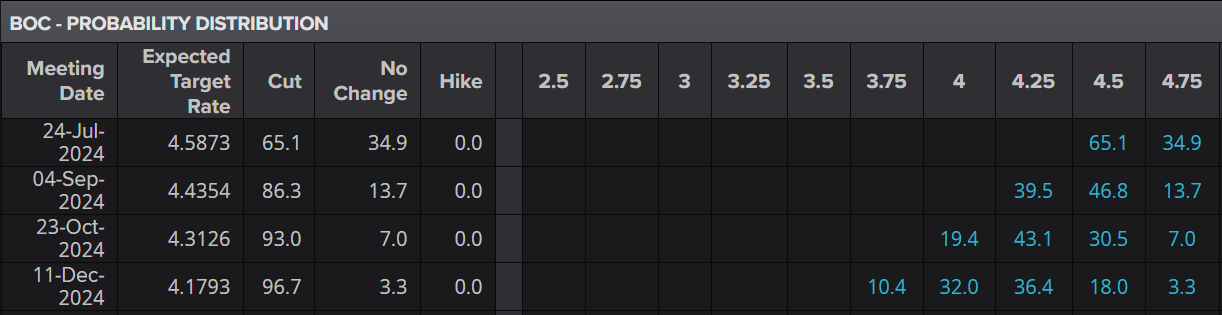
Canada’s labor market is also under strain, further complicating the Central Bank’s decisions. Market expectations for a rate cut are rising; however, if the Central Bank cuts rates while inflation remains elevated, it could lead to significant issues. Markets currently price in a 65.1% chance of a cut at the upcoming BoC meeting on July 24, 2024. A rate cut ahead of the Fed, combined with an unstable inflation picture, could propel USD/CAD to new yearly highs.
Bank of Canada (BoC) Interest Rate Probabilities.
Source: The Kobeissi Letter
US CPI Data
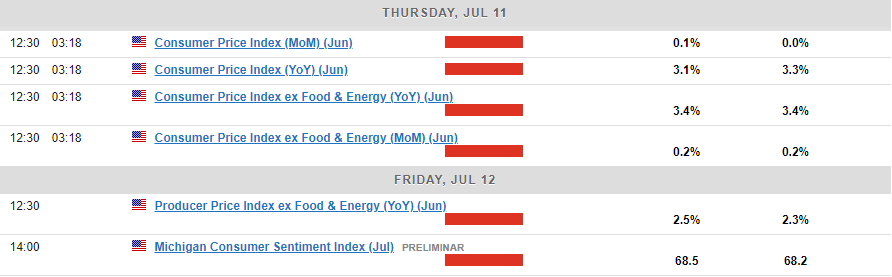
The focus this week has primarily been on the upcoming US inflation release. The data is expected to show that headline inflation moderated to 3.1% in June, down from 3.3%.
A result in line with or below the consensus figure should maintain interest among US Dollar doves. Such a print would likely keep rate cut probabilities at current levels or even increase them, potentially surpassing the 80% mark.
Technical Analysis
From a technical perspective, USD/CAD has remained within a 50-pip range over the past five trading days. Similarly, the US Dollar Index has shown comparable price action as market participants await a potential catalyst.
USD/CAD is currently situated between the 100-day moving average, providing resistance at 1.3640, and the 200-day moving average, offering support at 1.3596. This tight range and consolidation often precede an explosive or impulsive move, which could occur following today’s inflation data.
Support
- 1.3596 (200-day MA)
- 1.3500 (psychological level)
- 1.3450
- 1.3370 (February swing low)
Resistance
- 1.3640
- 1.3736
- 1.3846
- 1.4000 (Psychological level)
USD/CAD Daily Chart, July 11, 2024
Source: TradingView.com (click to enlarge)
Crypto Lacks Bulls
Market picture
It seems that all the market bulls have moved on to US and Japanese equities, avoiding cryptocurrencies. The cryptocurrency market failed to break out of its consolidation, and its capitalisation rolled back 1.3% to $2.13 trillion, inside the range from last Friday. Fear remains the main driver of the market.
Bitcoin pulled back from its 200-day moving average, falling back below the $58K upper boundary of the last six-day range. The first cryptocurrency is under much more pressure than many altcoins, which are making a gradual recovery. A consolidation above $59K would be seen as a local victory for the Bulls.
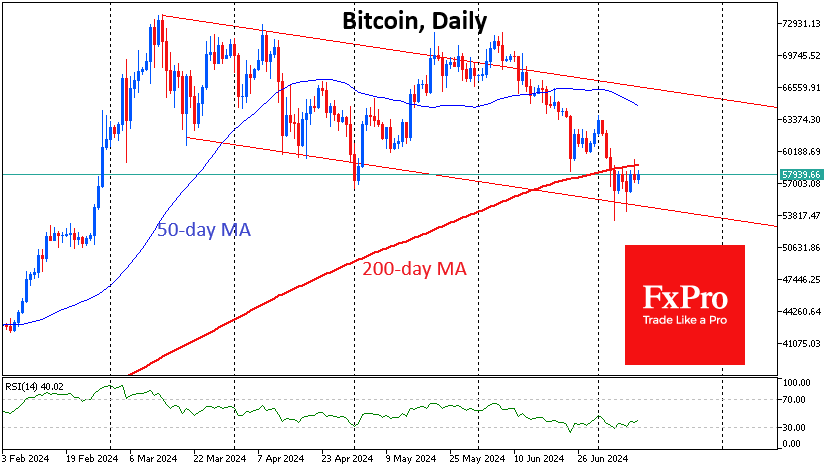
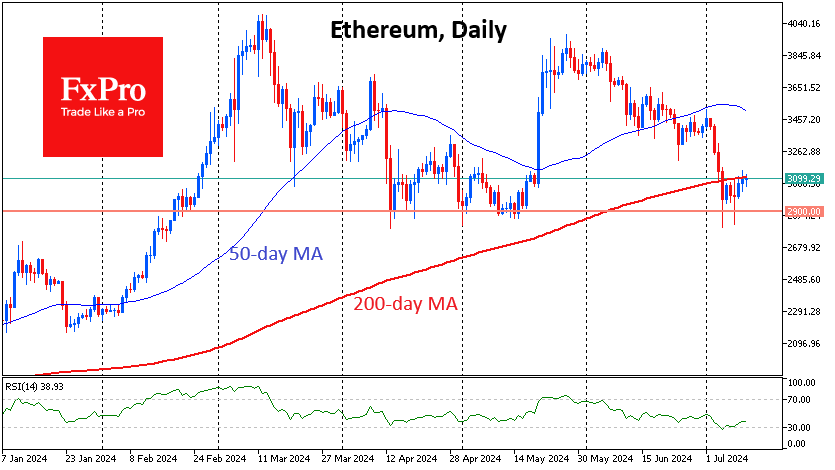
Ethereum is testing its 200-day MA near $3100 for the fourth day. So far, it has failed, but bullish candles are fixed for the third day in a row. Litecoin is also showing positive momentum, although, like Bitcoin, it is under pressure from expected payments to Mt. Gox creditors.
News background
Bitcoin’s most significant correction since late 2022, with a dip below the 200-day moving average (200-DMA), has brought unrealised losses to a significant portion of short-term speculators. Glassnode valued it at $595 million, its highest value since the 2022 cycle low.
Anthony Scaramucci, SkyBridge Capital founder, expects Bitcoin to reach $100K by the end of the year. The growth factor may be the upcoming payment of $16bn to clients of the bankrupt crypto exchange FTX. Scaramucci believes a significant part of these funds will be invested in Bitcoin.
On 10 July, German authorities transferred another 5,103 BTC ($299.8 million) to trading platforms. The German Federal Criminal Police Office (BKA) has 18,860 BTC ($1.11bn) left in its wallet.
In January, German police seized 49,857 BTC from the administrators of the pirate film website Movie2k. Blockchain Research Lab noted that this is standard procedure for confiscated funds. The remaining coins will likely be realized soon.
Bitwise said it has reached “the finish line” on the Ethereum-ETF issue. By now, there are “fewer and fewer” issues related to the S-1 filing between the SEC and the eight potential ETF issuers.