Sample Category Title
Japanese Yen Faces Continued Decline Amid Interest Rate Differentials
The USD/JPY pair has risen to 161.65, with the market cautious ahead of today's US consumer price index release. Despite this, the yen remains weakened by the significant interest rate differential between the Bank of Japan (BoJ) and the Federal Reserve.
Earlier this year, the BoJ abandoned its longstanding negative interest rate policy, adjusting the rate to zero. However, this adjustment has not halted the yen's depreciation, raising concerns about the currency's ongoing decline.
Investors eagerly await the BoJ's meeting in July, where crucial decisions on bond purchases are expected. The outcome of this meeting could mark a significant shift in Japan's monetary policy.
Mixed economic signals from Japan
Morning statistics from Japan showed mixed results. Core machinery orders declined by 3.2% month-on-month in May, following a 2.9% decrease the previous month. However, on an annual basis, these orders increased by 10.8%, surpassing the expected 7.2% growth, suggesting some underlying strength in the industrial sector.
USD/JPY technical analysis
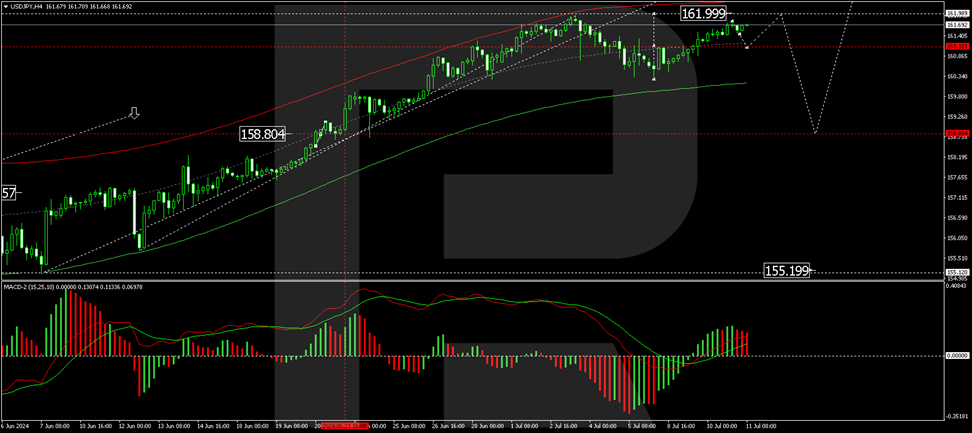
The USD/JPY is establishing a consolidation range around 161.12. The price could reach up to 162.00, considered a local target within the current upward trend. Following this level, a correction to 158.80 is anticipated, which could lead to another growth phase targeting 163.30. This bullish outlook is supported technically by the MACD indicator, where the signal line is prominently above zero and oriented upward.
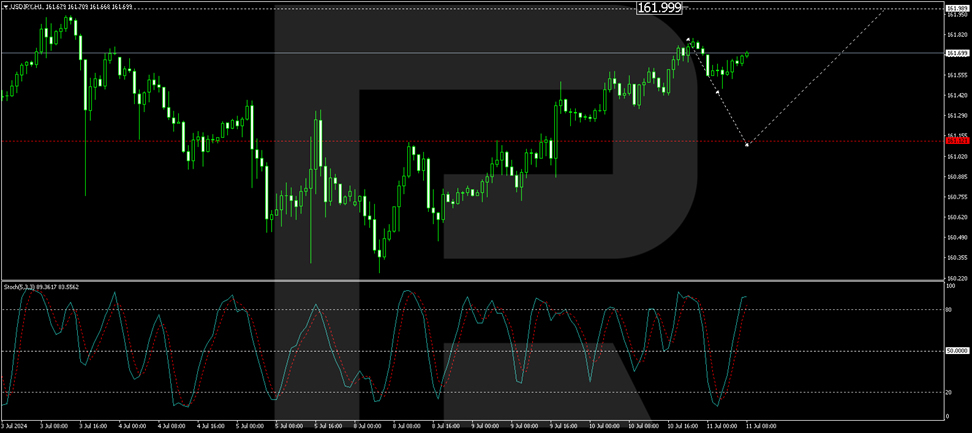
On the H1 chart, the pair has completed a growth structure reaching 161.79. Currently, a downward impulse to 161.47 has been observed. A continuation of this correction to 161.12 is expected, which should precede another rise to 162.00. This analysis is corroborated by the Stochastic oscillator, with the signal line poised to drop from above 80 to 20, indicating potential short-term pullbacks before further gains.
Investors and traders will closely monitor upcoming data releases and central bank communications to gauge the potential directions for both the yen and broader currency markets.
AUDUSD Posts a Fresh 6-month High
- AUDUSD breaks decisively above sideways pattern
- The price jumps to its highest since January 2024
- Oscillators are flagging overbought conditions
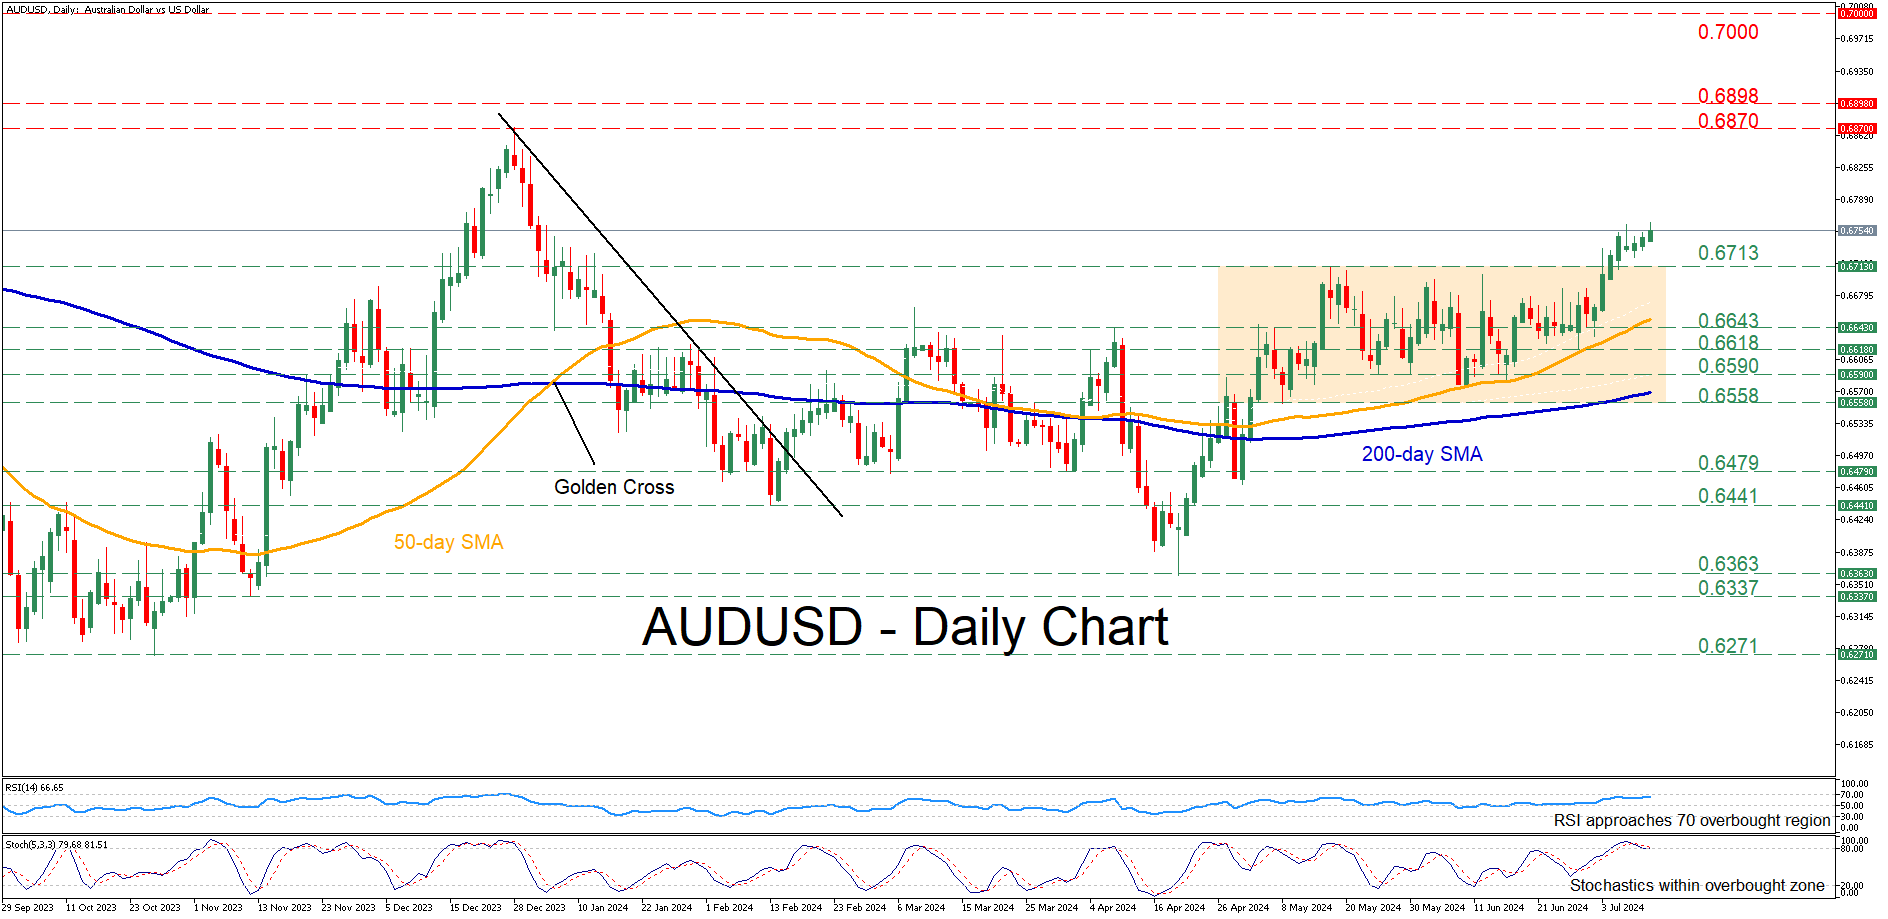
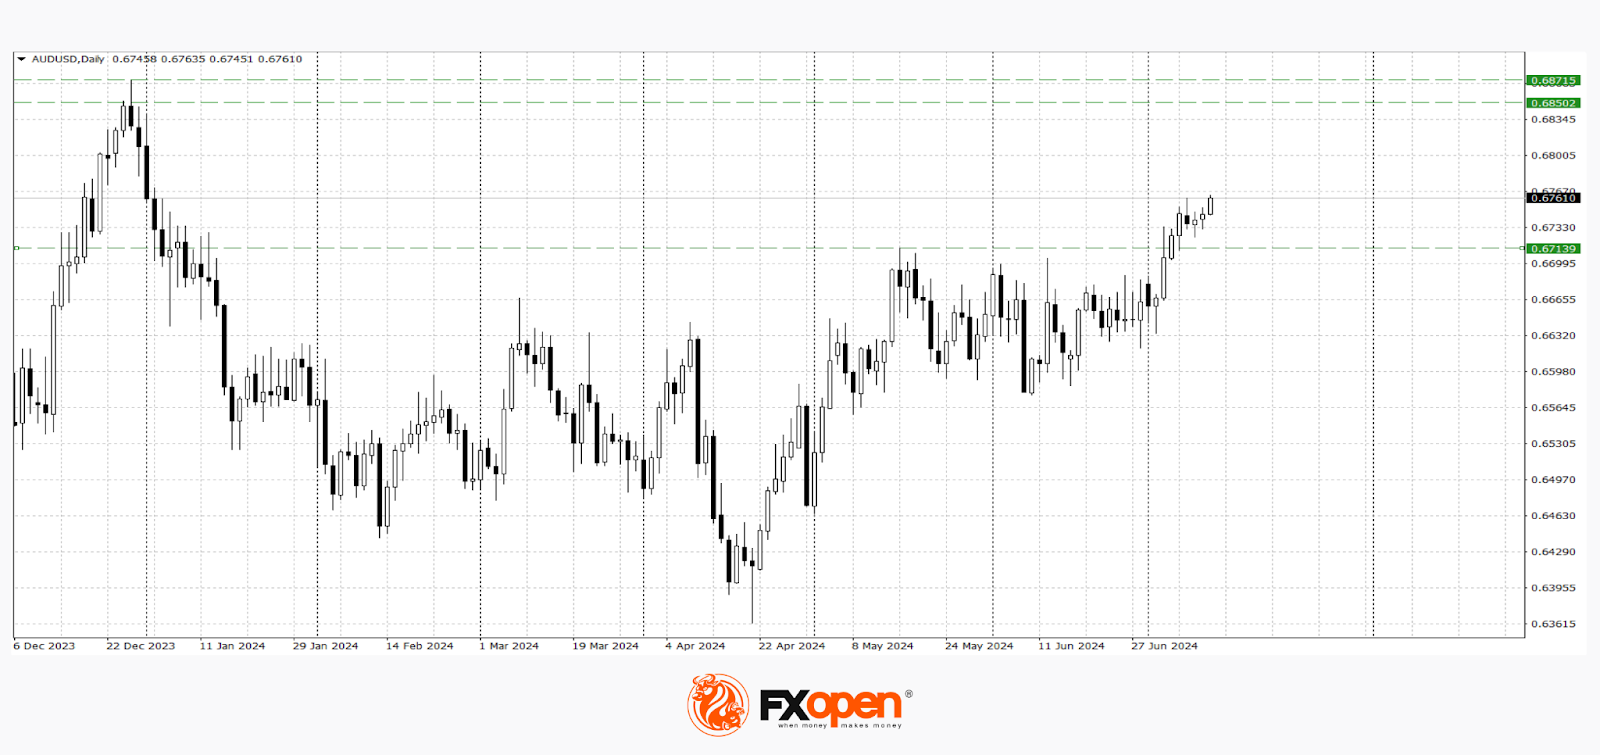
AUDUSD had been trading in a neutral range for more than two months, unable to adopt a clear directional impetus. However, in the last few sessions, the bulls have managed to propel the pair above that rangebound structure, sending it to a six-month high on Thursday.
If the pair marches towards fresh highs, there is no prominent resistance until the December 2023 peak of 0.6870. Failing to halt there, the pair may advance towards the double top region of 0.6898, registered last summer. Higher, the 0.7000 psychological mark might come under examination.
On the flipside, should the pair reverse lower, immediate support could be found at the May resistance of 0.6713. A violation of that hurdle could send the price back within its neutral structure, where the April-May resistance of 0.6643 could now serve as support. Further declines could then come to a halt at the June support of 0.6618.
In brief, AUDUSD has gained momentum after the break above its neutral structure, storming to a fresh six-month peak. However, the risk of an impending pullback is evident as both the RSI and stochastics are warning of an overstretched advance.
Markets Awaiting US Inflation Data: What is the Probability of Trend Reversals?
The major currency pairs are in a holding pattern following the release of the latest US labour market data and Jerome Powell's testimony before Congress. The Fed Chair noted that the Federal Reserve has made "significant progress" in its mission to combat inflation, but emphasized the need for "more good data" before lowering interest rates. Judging by the movements of the major currency pairs, the market appears sceptical of the Fed Chair's statements:
- The AUD/USD pair has refreshed the May highs of the current year and strengthened above 0.6700.
- The USD/CAD pair is trading near strategic support at 1.3610.
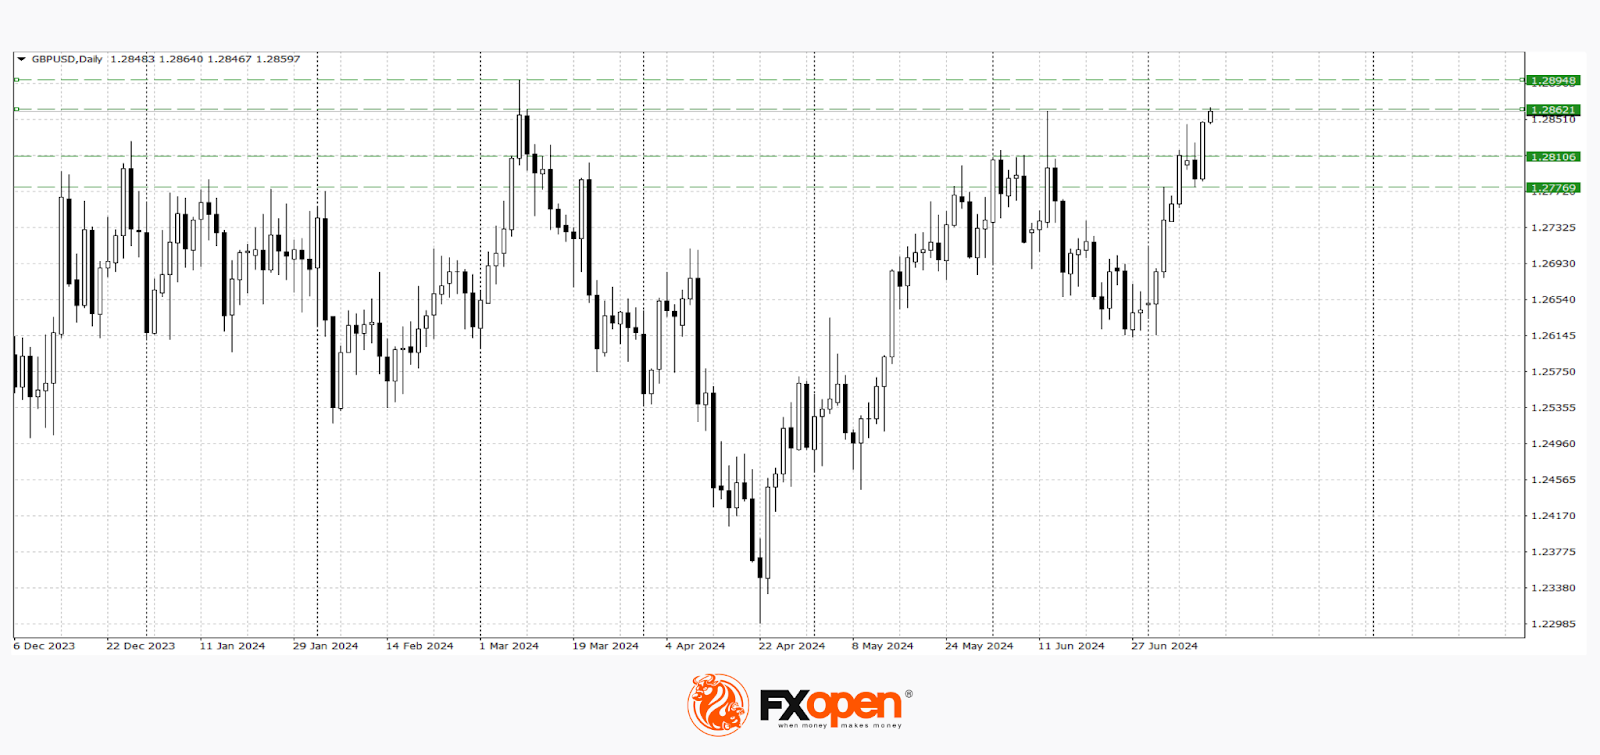
- The GBP/USD pair is approaching the March highs near 1.2900.
As we can see, the US dollar is slowly but surely losing ground in many directions, but by the end of the week, existing trends could either slow down or change direction dramatically.
AUD/USD
Technical analysis of the AUD/USD pair indicates the possibility of continued growth, as the May high of the current year has been refreshed, and the price has managed to strengthen above the significant resistance level of 0.6700. The nearest area for consolidation is the range of 0.6870-0.6850. In the event of a corrective pullback, the pair may test 0.6720-0.6700. The following events could increase the pair's volatility:
- Today at 15:30 (GMT +3), the release of the US Consumer Price Index (CPI) for June.
- Today at 15:30 (GMT +3), the weekly release of initial jobless claims in the US.
- Tomorrow at 04:00 (GMT +3), the release of the MI Inflation Expectations in Australia.
GBP/USD
Buyers of the GBP/USD pair have managed to refresh the May high of the current year and are directing the price towards significant resistance at 1.2900. If this level transitions to support, the price could continue to rise towards 1.3100-1.3000. The nearest levels for a downward pullback are located around 1.2800-1.2760.
This morning, we are expecting the UK GDP data for May. At 15:00 (GMT +3), attention should be paid to the release of the NIESR monthly GDP tracker for the UK.
Trade over 50 forex markets 24 hours a day with FXOpen. Take advantage of low commissions, deep liquidity, and spreads from 0.0 pips. Open your FXOpen account now or learn more about trading forex with FXOpen.
This article represents the opinion of the Companies operating under the FXOpen brand only. It is not to be construed as an offer, solicitation, or recommendation with respect to products and services provided by the Companies operating under the FXOpen brand, nor is it to be considered financial advice.
Market Analysis: EUR/USD Jumps, USD/JPY Bulls Seem Unstoppable
EUR/USD is climbing higher above the 1.0800 level. USD/JPY surged above the 160.00 and 161.40 resistance levels.
Important Takeaways for EUR/USD and USD/JPY Analysis Today
- The Euro started a decent increase above the 1.0780 pivot level.
- There is a key bullish trend line forming with support near 1.0820 on the hourly chart of EUR/USD at FXOpen.
- USD/JPY climbed higher above the 160.50 and 161.40 levels.
- There is a connecting bullish trend line forming with support near 161.55 on the hourly chart at FXOpen.
EUR/USD Technical Analysis
On the hourly chart of EUR/USD at FXOpen, the pair started a fresh increase from the 1.0710 zone. The Euro cleared a few key hurdles near 1.0780 to move into a positive zone against the US Dollar.
The pair settled above the 1.0800 level and the 50-hour simple moving average. A high was formed at 1.0845 and the pair is now consolidating gains. There was a test of the 23.6% Fib retracement level of the upward move from the 1.0710 swing low to the 1.0845 high.
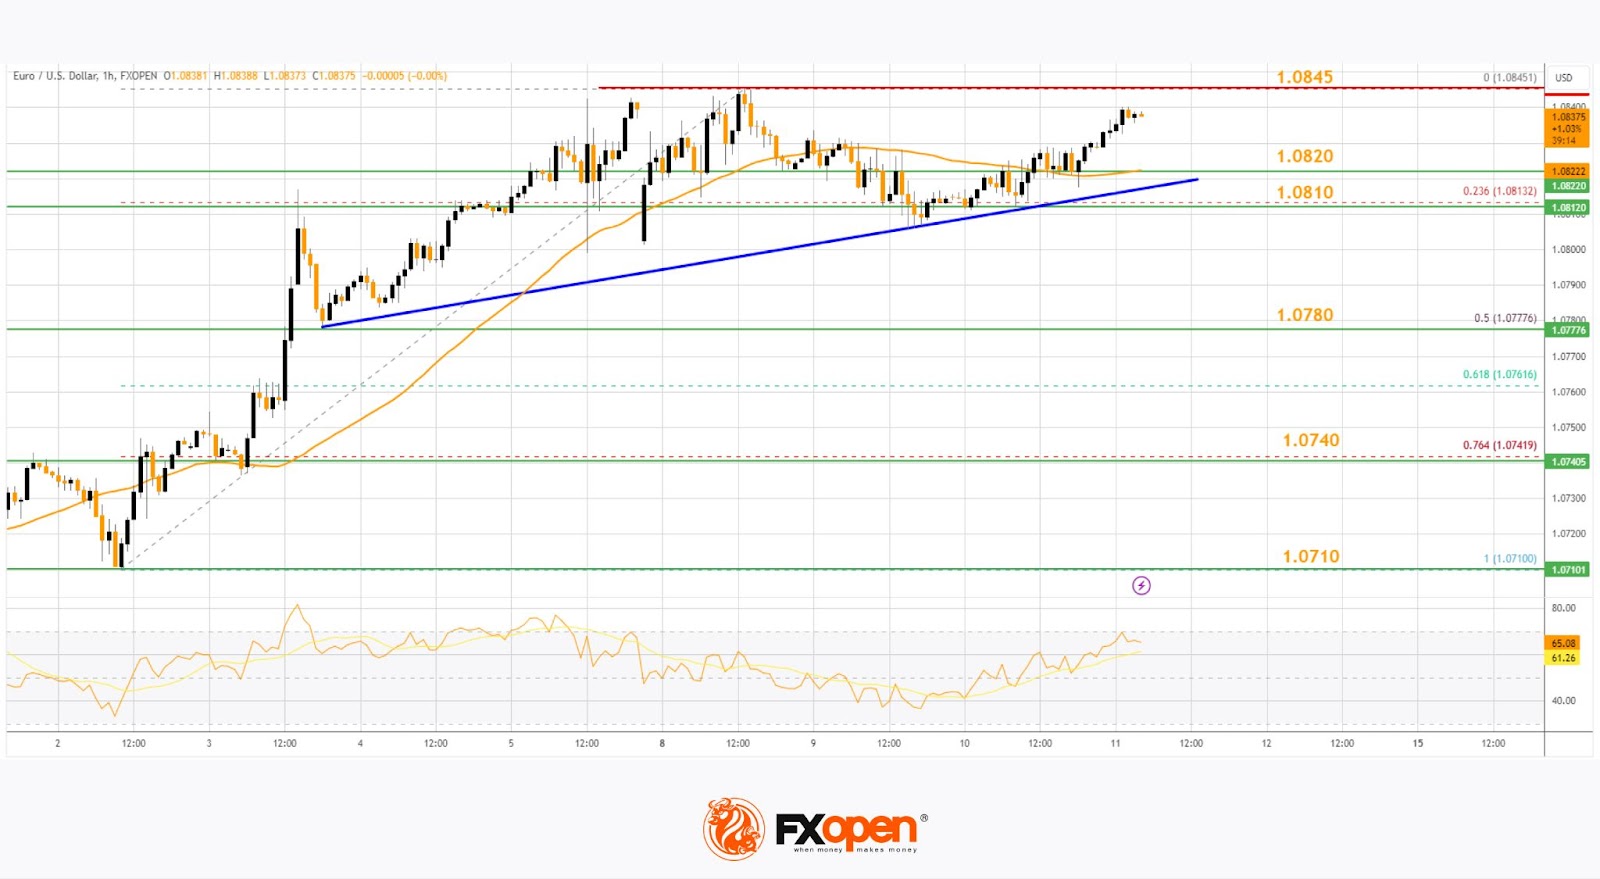
However, the bulls are active above the 1.0800 zone. Immediate support is near a key bullish trend line at 1.0820. The first major support on the EUR/USD chart is near 1.0820.
The next key support is near the 50% Fib retracement level of the upward move from the 1.0710 swing low to the 1.0845 high at 1.0780. If there is a downside break below 1.0780, the pair could drop toward 1.0740. The next support is near 1.0710, below which the pair could start a major decline.
On the upside, the pair is now facing resistance near the 1.0845 zone. The next major resistance is near 1.0880. An upside break above 1.0880 could set the pace for another increase. In the stated case, the pair might rise toward 1.0920.
USD/JPY Technical Analysis
On the hourly chart of USD/JPY at FXOpen, the pair started a major increase from the 160.25 zone. The US Dollar gained bullish momentum above 160.80 against the Japanese Yen.
It settled above the 50-hour simple moving average and 161.40. The upward move was such that the pair cleared the 61.8% Fib retracement level of the last key decline from the 161.95 swing high to the 160.25 low.
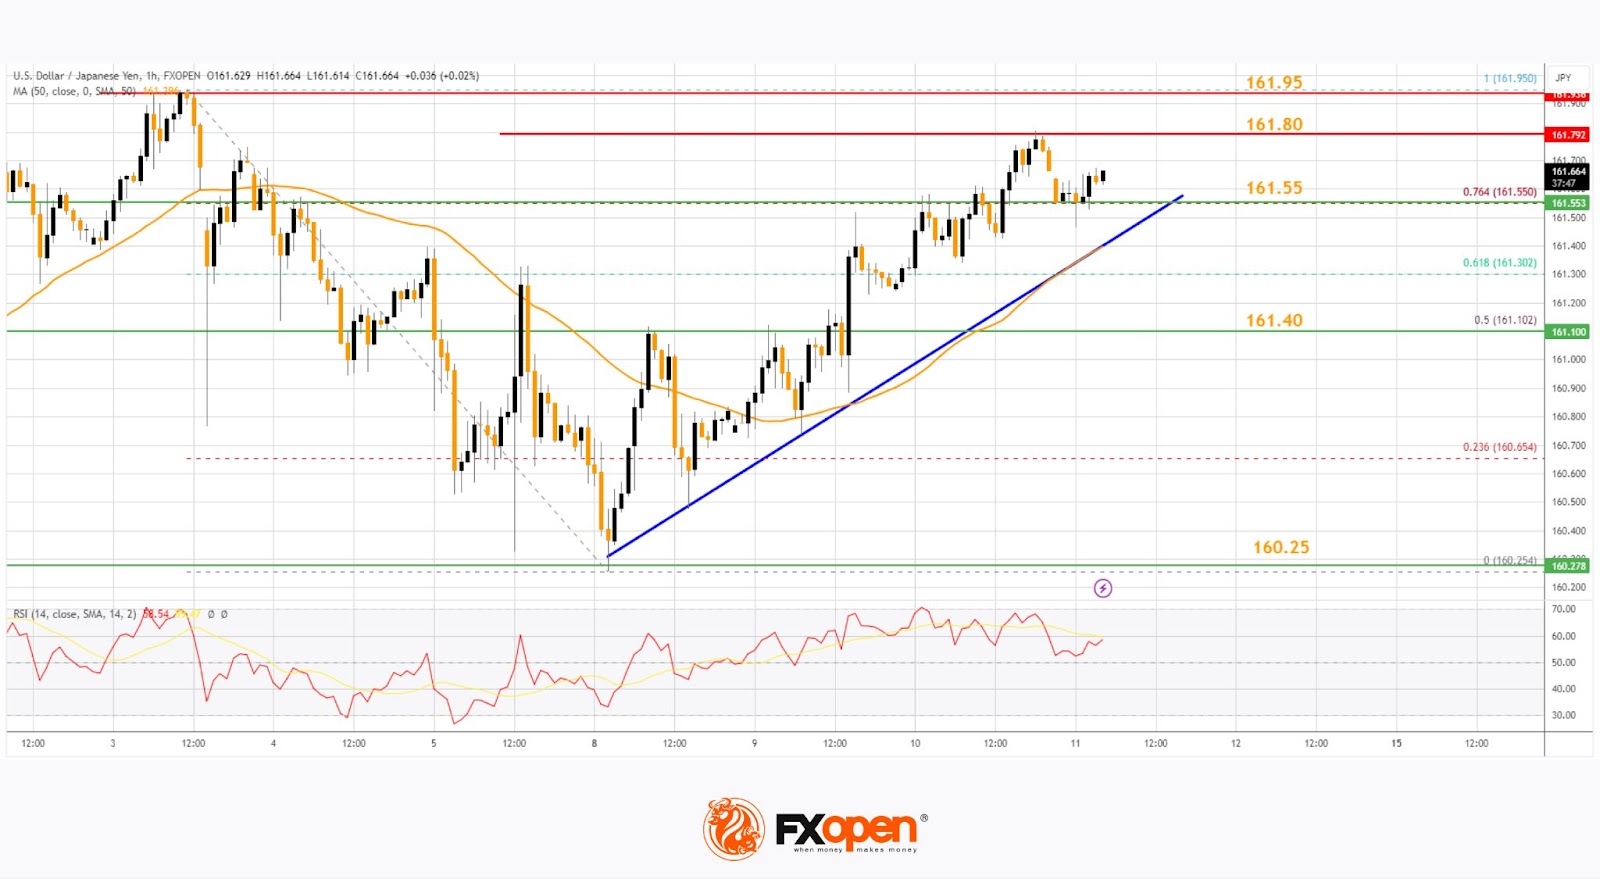
The current price action is positive, and the pair seems to be consolidating above the 76.4% Fib retracement level of the last key decline from the 161.95 swing high to the 160.25 low, suggesting more upsides.
Immediate resistance on the USD/JPY chart is near 161.80. The first major resistance is near 161.95. If there is a close above the 161.95 level and the RSI moves above 60, the pair could rise toward 162.50.
The next major resistance is near 163.20, above which the pair could test 165.00 in the coming days. On the downside, the first major support is near the trend line at 161.55. The next major support is near the 161.40 pivot level.
If there is a close below the 50-hour simple moving average and 161.40, the pair could decline steadily toward 160.25. In the stated case, the pair might drop toward 158.80. The next major support sits at 156.50.
This article represents the opinion of the Companies operating under the FXOpen brand only. It is not to be construed as an offer, solicitation, or recommendation with respect to products and services provided by the Companies operating under the FXOpen brand, nor is it to be considered financial advice.
Trade over 50 forex markets 24 hours a day with FXOpen. Take advantage of low commissions, deep liquidity, and spreads from 0.0 pips. Open your FXOpen account now or learn more about trading forex with FXOpen.
This article represents the opinion of the Companies operating under the FXOpen brand only. It is not to be construed as an offer, solicitation, or recommendation with respect to products and services provided by the Companies operating under the FXOpen brand, nor is it to be considered financial advice.
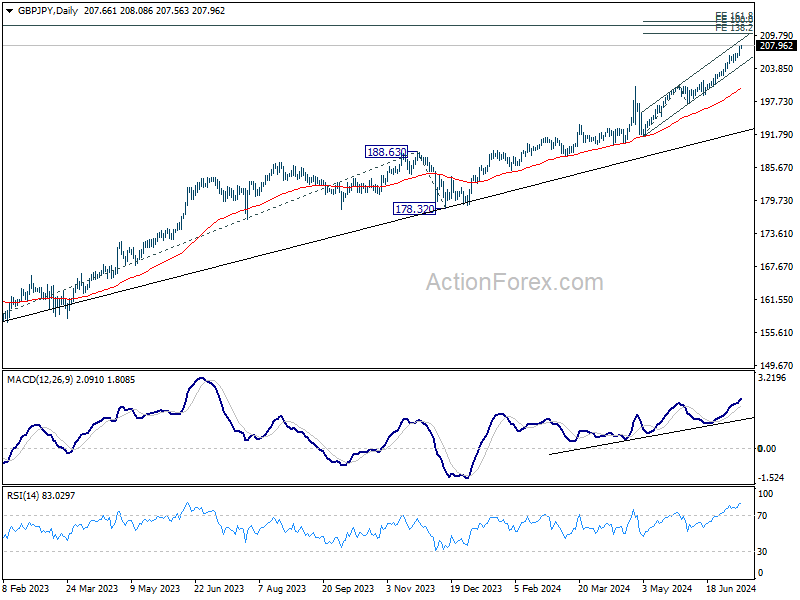
GBP/JPY Daily Outlook
Daily Pivots: (S1) 206.68; (P) 207.25; (R1) 208.34; More...
GBP/JPY's rally resumed and hits as high as 208.08 so far. Intraday bias is now on the upside for 138.2% projection of 191.34 to 200.72 from 197.18 at 210.17. On the downside, below 206.12 minor support will turn intraday bias neutral and bring consolidations first.
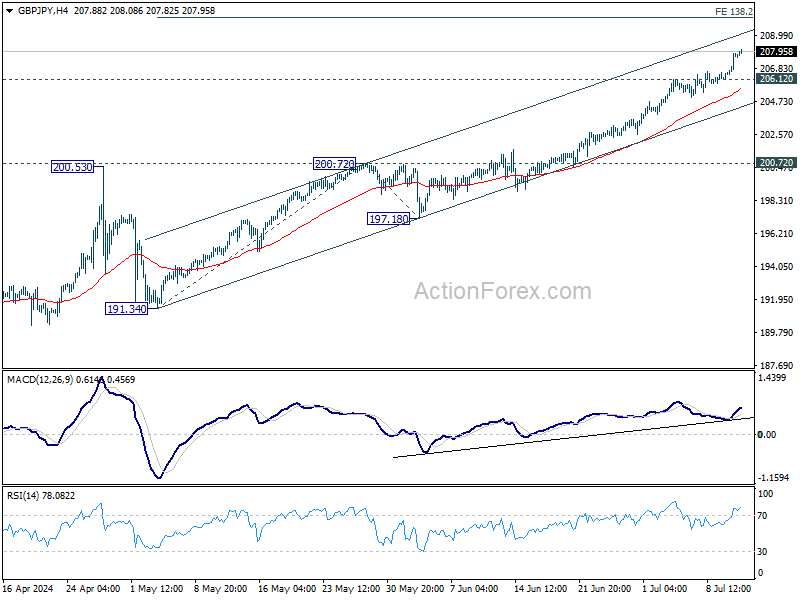
In the bigger picture, long term up trend is still in progress. Next target is 100% projection of 155.33 to 188.63 from 178.32 at 211.62. Outlook will stay bullish as long as 200.72 resistance turned support holds, even in case of deep pullback.
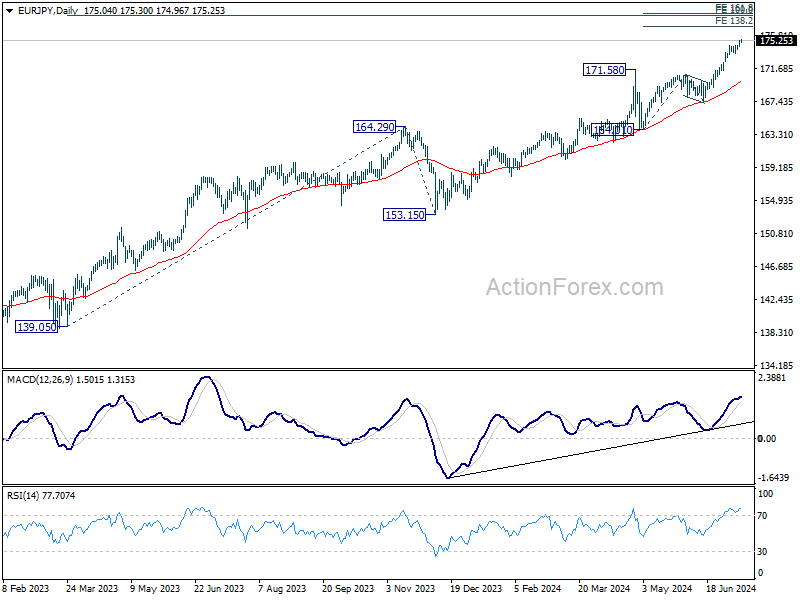
EUR/JPY Daily Outlook
Daily Pivots: (S1) 174.50; (P) 174.83; (R1) 175.45; More...
EUR/JPY's rally continues today and intraday bias remains on the upside. Current up trend should target 138.2% projection of 164.01 to 170.87 from 167.52 at 177.00. For now, outlook will remain bullish as long as 173.50 support holds, in case of retreat.
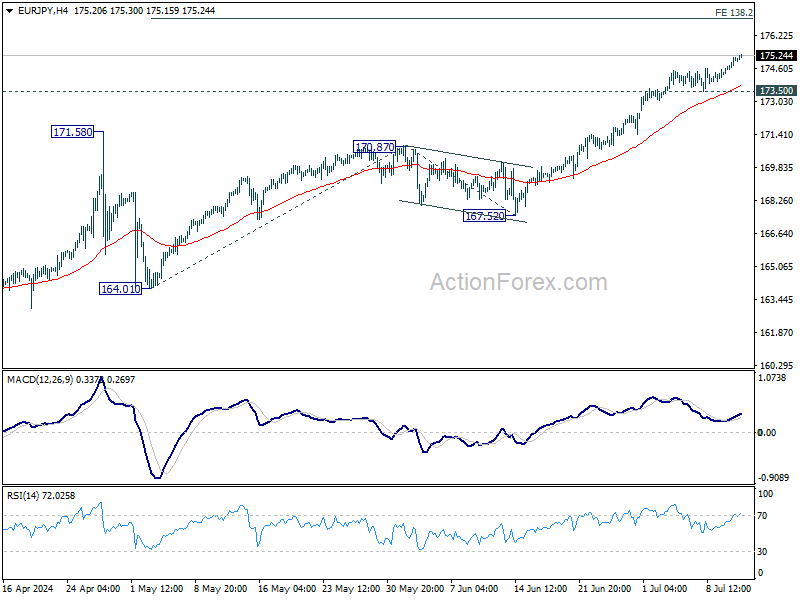
In the bigger picture, long term up trend is still in progress. Next target is 100% projection of 139.05 to 164.29 from 153.15 at 178.38. For now outlook will stay bullish as long as 170.7 resistance turned support holds, even in case of deep pullback.
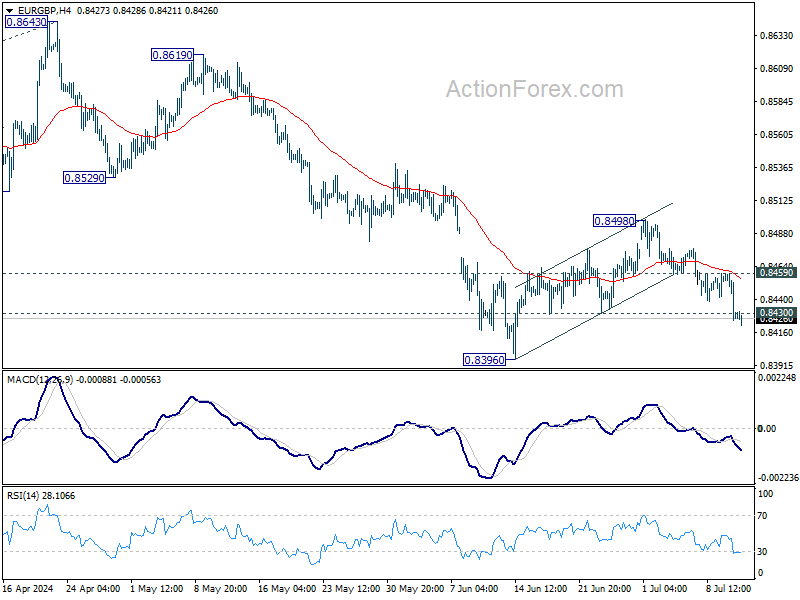
EUR/GBP Daily Outlook
Daily Pivots: (S1) 0.8417; (P) 0.8438; (R1) 0.8452; More....
EUR/GBP's break of 0.8430 support suggests that corrective recovery from 0.8396 has completed at 0.8498, after rejection by 55 D EMA. Intraday bias is back on the downside for 0.8396 support first. Firm break there will resume larger down trend. On the upside, above 0.8459 will delay the bearish case and turn intraday bias neutral first.
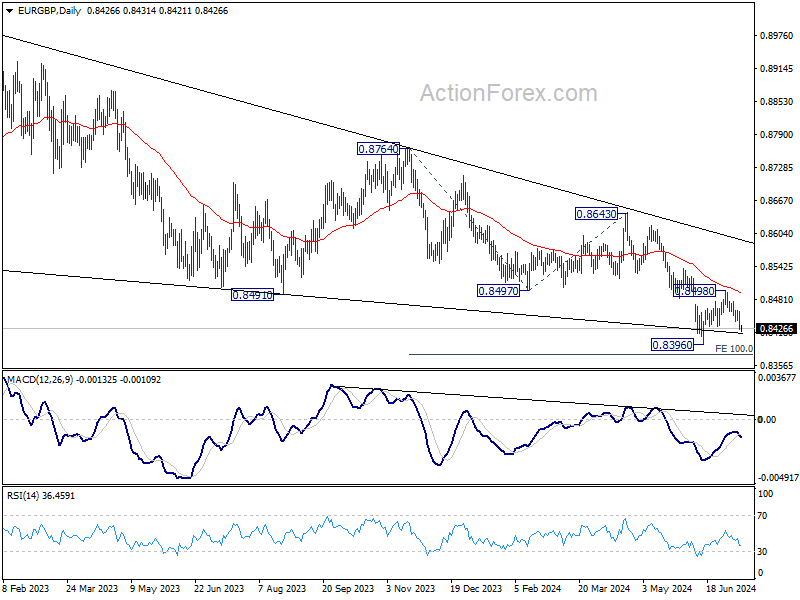
In the bigger picture, down trend from 0.9267 (2022 high) is in progress. Next target is 100% projection of 0.8764 to 0.8497 from 0.8643 at 0.8376. Sustained break there will target 161.8% projection at 0.8211 next. For now, outlook will remain bearish as long as 0.8643 resistance holds, even in case of stronger rebound.
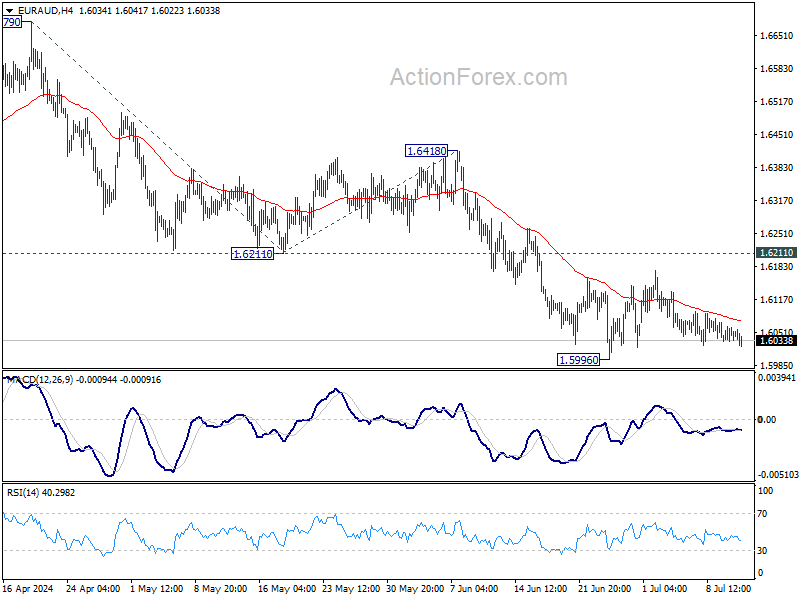
EUR/AUD Daily Outlook
Daily Pivots: (S1) 1.6037; (P) 1.6050; (R1) 1.6067; More...
EUR/AUD is staying in range above 1.5996 and intraday bias remains neutral. More consolidations could be seen but outlook will remain bearish as long as 1.6211 support turned resistance holds. On the downside, break of 1.5996 will target 100% projection of 1.6679 to 1.6211 from 1.6418 at 1.5950. Firm break there will target 1.5846 key support next.
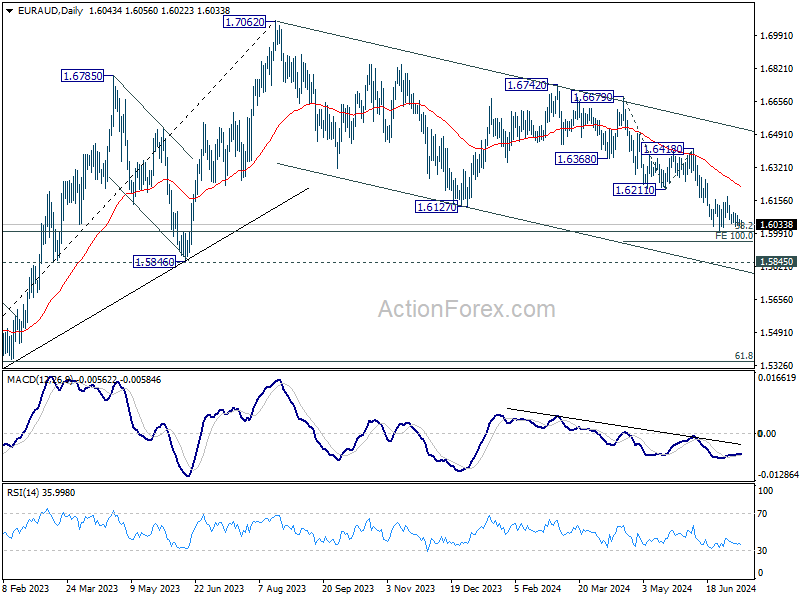
In the bigger picture, fall from 1.7062 medium term top is seen as a correction to the up trend from 1.4281 (2022 low) only. Strong support is still expected between 1.5846 and 38.2% retracement of 1.4281 to 1.7062 at 1.6000 to bring rebound. Break of 1.6148 resistance will argue that the correction has completed.
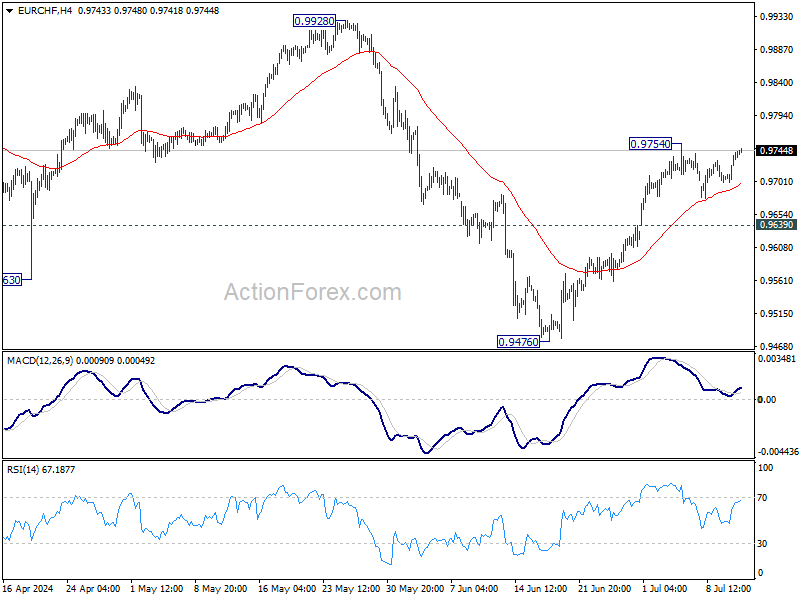
EUR/CHF Daily Outlook
Daily Pivots: (S1) 0.9714; (P) 0.9728; (R1) 0.9757; More....
EUR/CHF is staying in range below 0.9754 and intraday bias remains neutral for the moment. Further rally is expected with 0.9639 support intact. On the upside, above 0.9754 will resume the rebound from 0.9476 to retest 0.9928 high. Nevertheless, break of 0.9639 will turn bias back to the downside for 0.9476 low instead.
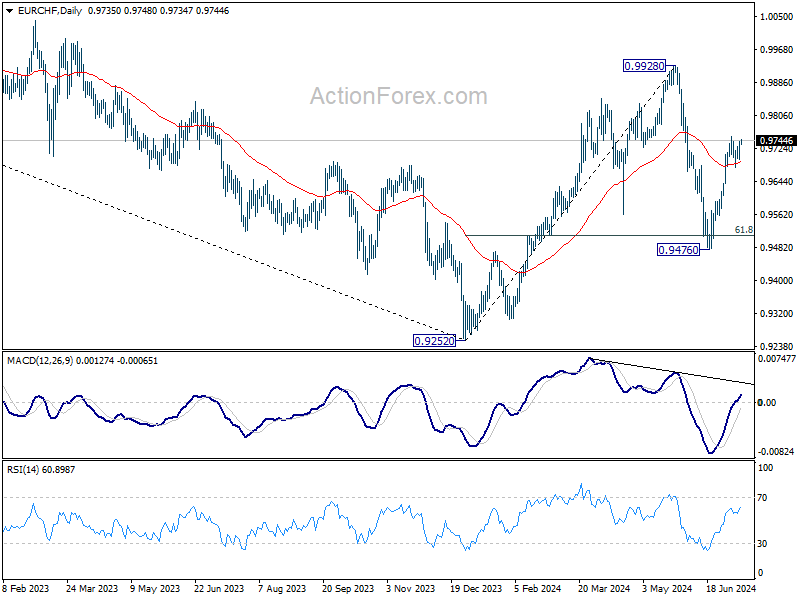
In the bigger picture, rebound from 0.9252 medium term bottom might not be completed yet. But even in case of resumption, strong resistance could emerge from 1.0095 to limit upside. Medium term outlook will be neutral at best as long as 1.0094 structural resistance holds. Meanwhile, break of 0.9476 will bring retest of 0.9252 low.
EUR/USD Daily Outlook
Daily Pivots: (S1) 1.0817; (P) 1.0824; (R1) 1.0838; More....
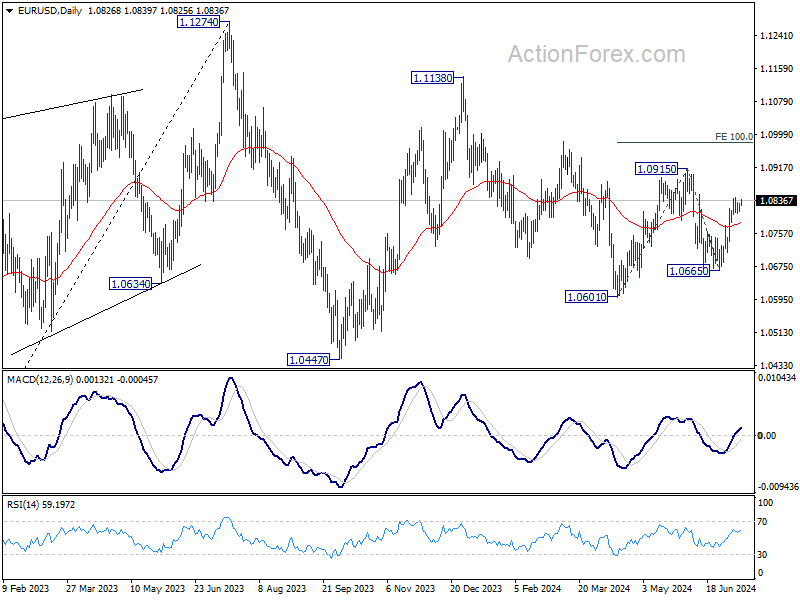
Range trading continues in EUR/USD and intraday bias remains neutral. Further rally is in favor as long as 55 4H EMA (now at 1.0796) holds. On the upside, above 1.0844 will resume the rebound from 1.0665 to retest 1.0915 resistance. Firm break there will target 100% projection of 1.0601 to 1.0915 from 1.0665 at 1.0919 next. However, sustained break of 55 4H EMA will bring deeper fall back to 1.0665 support.
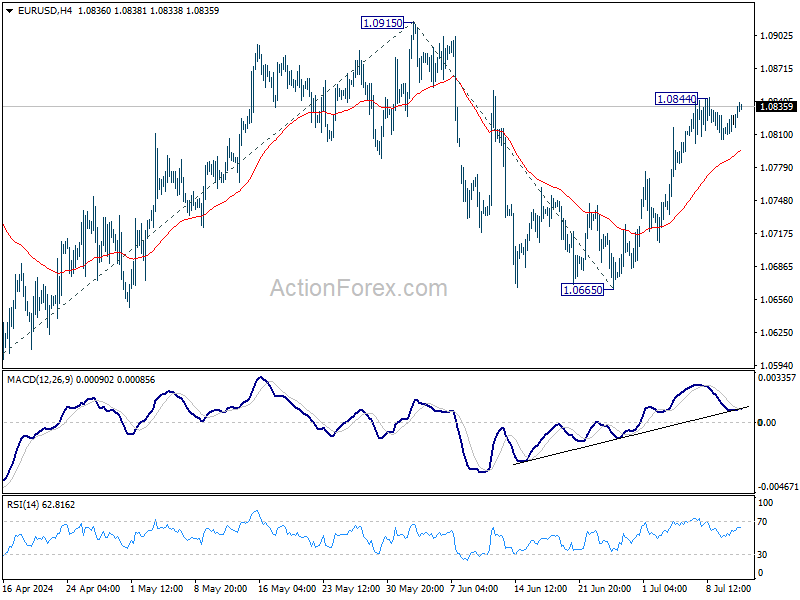
In the bigger picture, price actions from 1.1274 are viewed as a corrective pattern that's still in progress. Break of 1.0601 will target 1.0447 support and possibly below. On the upside, firm break of 1.0915 resistance will start another rising leg back to 1.1138 resistance instead.