Sample Category Title
US CPI Preview: US Dollar Index (DXY) Looks for Guidance from Inflation Data
- Anticipation is high for the release of US CPI data, which is expected to influence market movements, especially the US Dollar Index (DXY).
- The market has priced in an 71.8% chance of a September rate cut, and if inflation aligns with or falls below forecasts, this likelihood could increase.
- Technically, the DXY is range-bound, hovering between 104.80 and 105.20, with support at the 100-day and 200-day moving averages and resistance at 105.63 and 106.00.
US CPI data is set to be released tomorrow, promising to stir volatility in an otherwise quiet week. Market participants are eagerly awaiting the data, as evidenced by the recent indecision in the markets.
The US Dollar Index (DXY) exemplifies this uncertainty with significant sideways price action this week. The inflation data follows a series of underwhelming data releases from the US, leading market participants to price in nearly an 71.8% chance of a rate cut in September.
Markets are expecting further moderation in tomorrow’s inflation data. If inflation moves closer to the Fed’s 2% target, it will bolster hopes of a rate cut, especially after Fed Chair Powell’s testimony this week. Powell emphasized that the Fed doesn’t want to wait until inflation reaches 2% to ease policy, explaining that the Fed seeks greater confidence in inflation trends.
Let us take a look at what Investment Banks are forecasting for tomorrow’s inflation print.
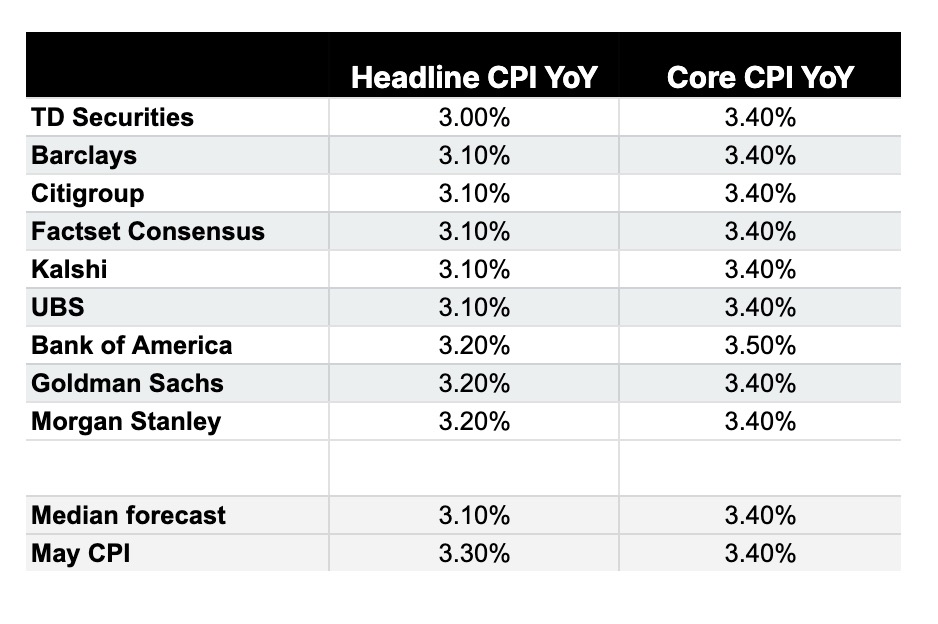
Source: The Kobeissi Letter
These comments will undoubtedly influence market participants as they approach tomorrow’s release. Should inflation match forecasts or come in lower, it could finally lead to sustainable market movements. This year has been characterized by quick, volatile moves quickly reversed in the days following. However, if inflation dips below the 3% mark, though unlikely, the market reaction could be markedly different this time.
Technical Analysis
From a technical standpoint, the DXY has been rangebound for quite sometime. The last few days however has seen very little in terms of price movement, as the price has hovered between 104.80 and 105.20.
The DXY is at somewhat of a critical juncture as the ascending trendline, 100 and 200-day MAs rest just below current price. Inflation data may serve as a catalyst for a break below the long-term trendline or finally facilitate a move toward the multi-month resistance at 107.00.
Either way, market participants will hope for volatility and secondly some medium term direction.
Support
- 105.00 (100-day MA)
- 104.47 (200-day MA)
- 104.00
- 103.00
Resistance
- 105.63
- 106.00
- 107.00
US Dollar Index (DXY) Daily Chart, July 10, 2024
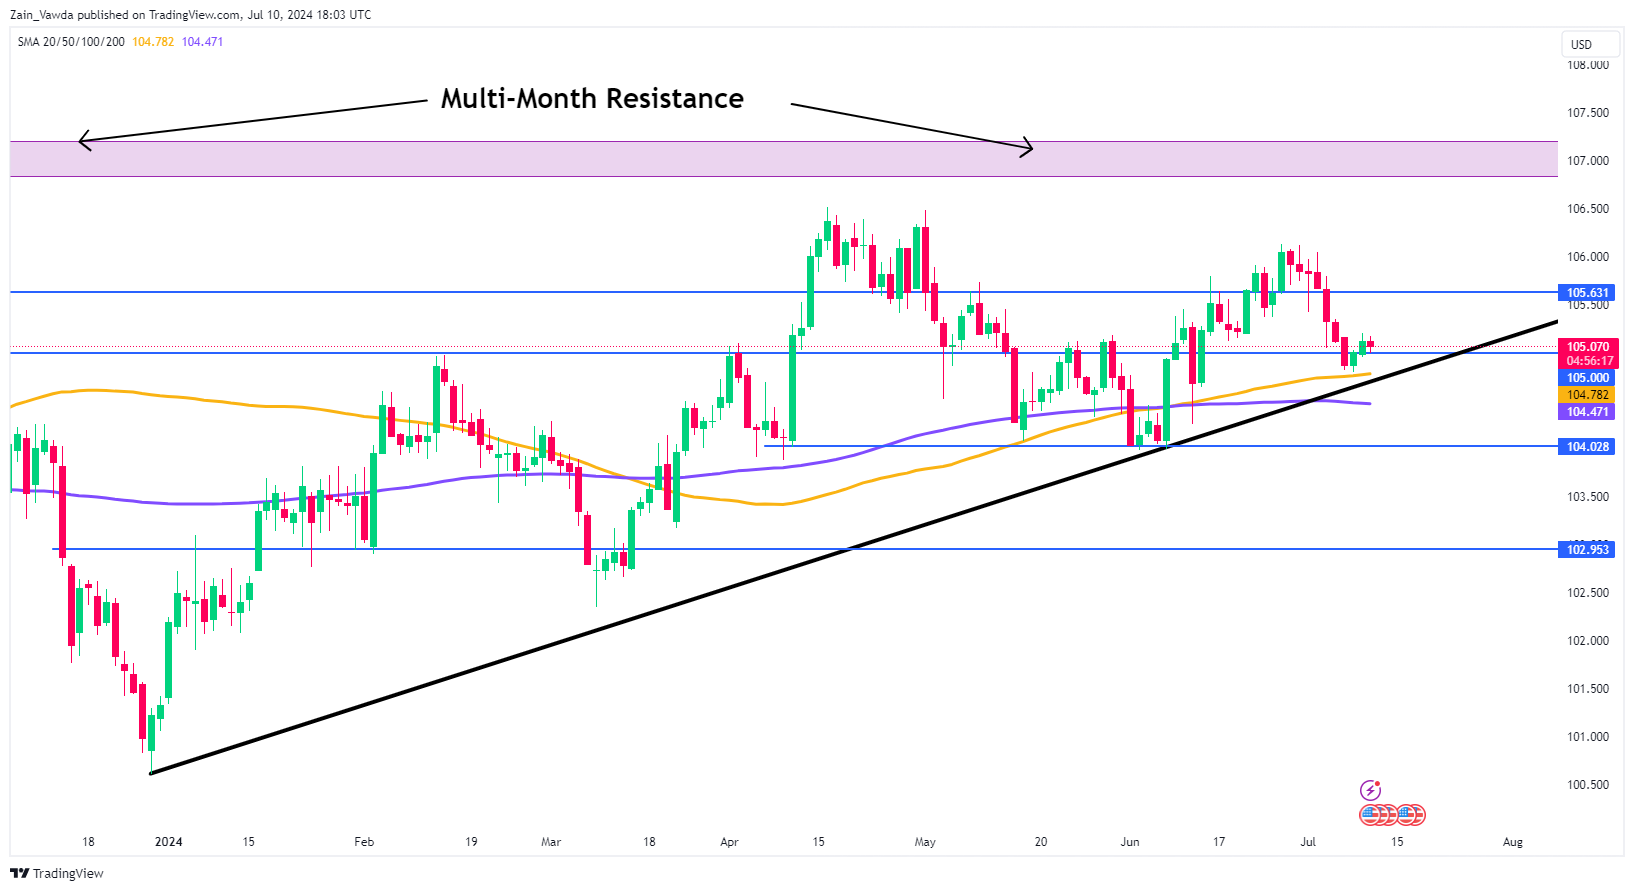
Source: TradingView.com (click to enlarge)
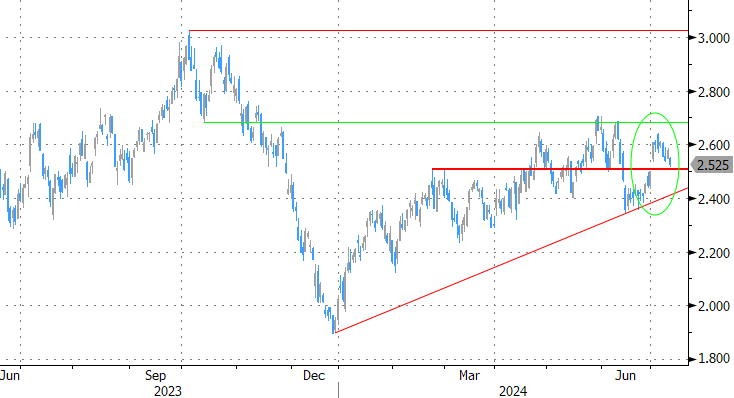
Silver Price Outlook: Will Strong Demand and Tight Supply Keep Prices Shining?
- Silver prices have risen due to a supply and demand gap, with demand outstripping supply for the fifth consecutive year.
- Industrial demand, driven by green energy, AI, and EVs, now accounts for 64% of global silver demand.
- A potential slowdown in China’s economy and prolonged high interest rates could dampen silver prices.
- Bullish Pennant pattern breakout hints at further upside. Will inflation data halt the move?
Silver prices have seen a remarkable rise this year, and with six months still to go, many are wondering just how high they could climb. One key factor to watch is the supply and demand dynamics, as demand for silver continues to outstrip supply.
According to the World Silver Survey, 2024 is the fifth year in a row with a silver shortage. In 2023, silver demand was higher than supply, leading to a market deficit of over 142 million ounces. By the end of 2024, this shortfall is expected to nearly double to 265 million ounces because of increasing industrial demand.
Silver Supply (Orange Line) and Demand (Green Line), 2019-2024
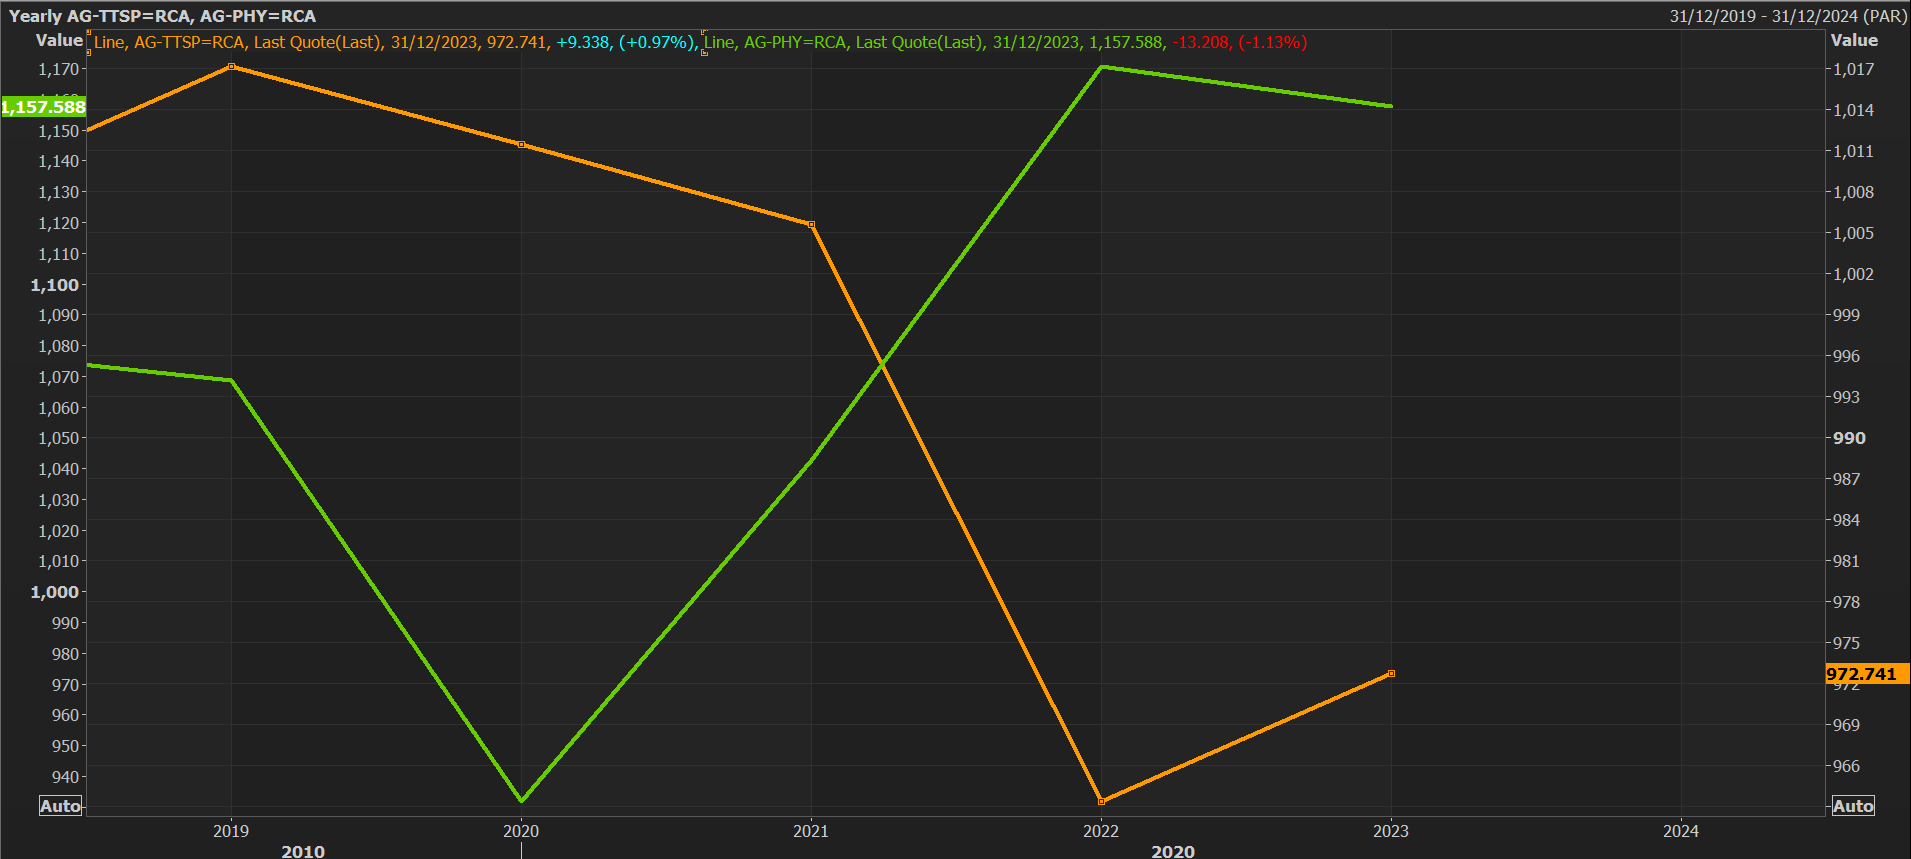
Source: LSEG
Historically, half of the demand for silver was for industrial use and the other half for investment. Recently, industrial demand has grown significantly, now making up 64% of global silver demand, up 19% from last year.
This trend shows no signs of slowing. The primary drivers of the silver supply squeeze are the Green Energy Transition, particularly solar energy, and the high demand from the Artificial Intelligence and electric vehicle (EV) sectors. These industries are among the fastest-growing in the world today.
The only worry has been a recent dip in demand from China and the possibility of a slowdown in the Chinese economy. This could help balance the demand and supply gap. Prolonged higher interest rates from Central Banks could also dampen silver prices and possibly stop the rally. The sooner the US Federal Reserve cuts rates, the better it would be for silver prices.
The Week Ahead
The US CPI data has the potential to provide silver a shot in the arm and provide some impetus from a move away from the psychological 30.00 handle. A hot inflation print tomorrow could have the opposite impact and push Silver below the 30.00 handle in the short term, but the overall bullish trend is likely to remain intact.
Technical Analysis
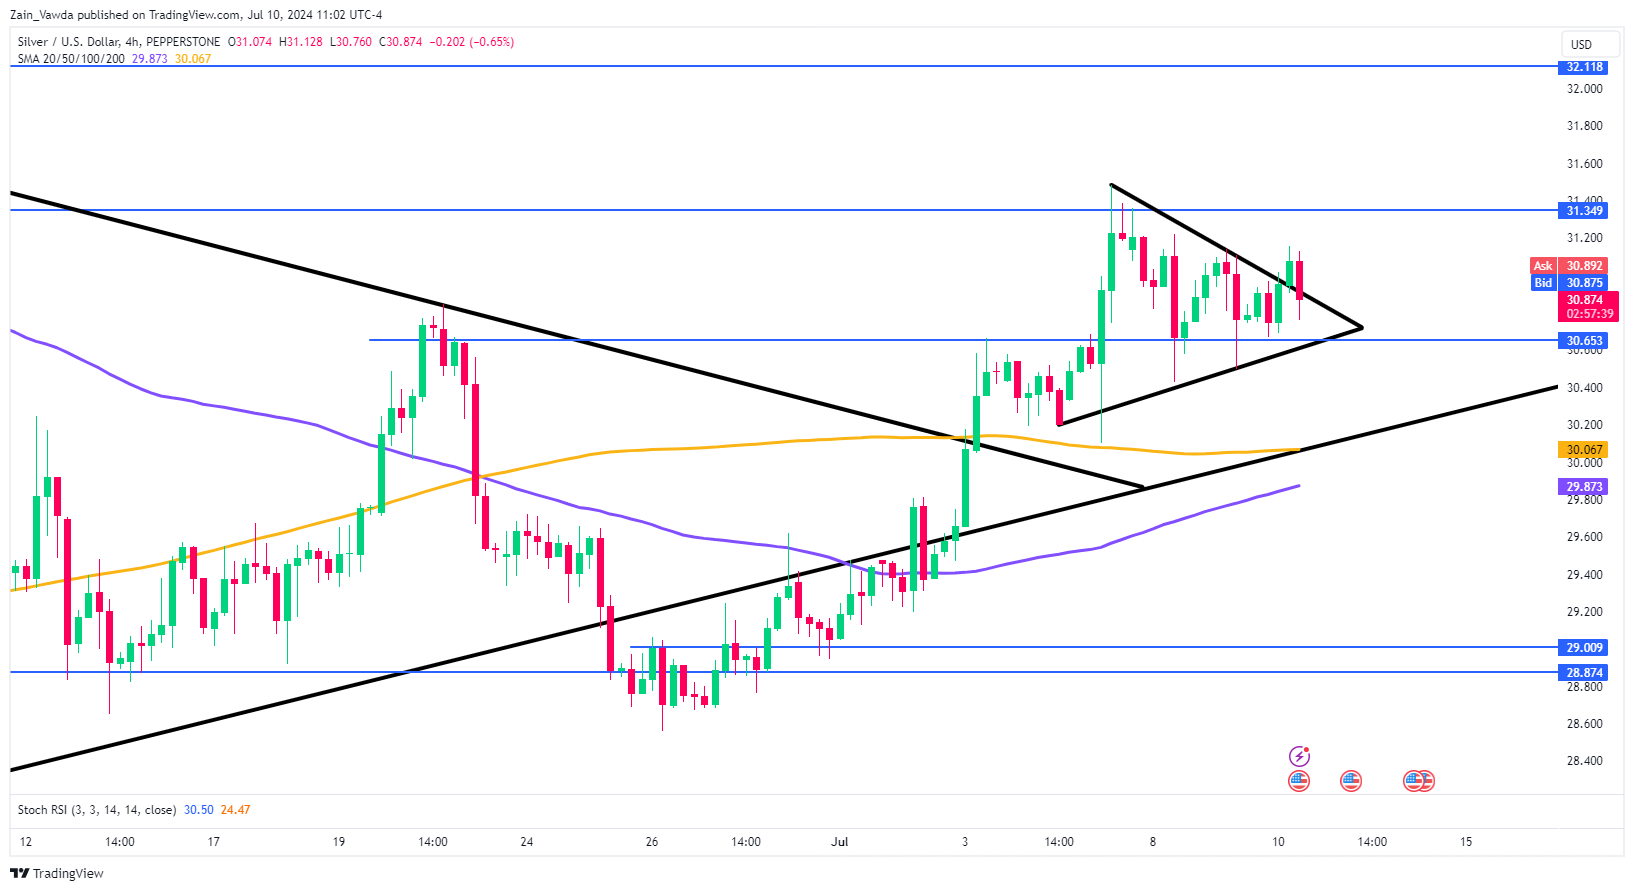
From a technical standpoint, silver broke out of a bullish pennant pattern on the daily chart on July 3, which led to a rally up to around 31.50 before entering a pullback and consolidation phase.
Since then, silver has been forming lower highs and higher lows, creating a new bullish pennant pattern. Another important factor to watch is the moving averages; the 100-day MA is nearing a golden cross with the 200-day MA, suggesting further upside and bullish momentum.
However, if a 4-hour candle closes below the 30.600 level, it would signal a change in structure, invalidating the current bullish setup.
Support
- 30.60
- 30.20
- 30.00 (psychological level)
Resistance
- 31.35
- 31.70
- 32.00
Silver (XAG/USD) Daily Chart, July 10, 2024
Source: TradingView.com (click to enlarge)
S&P 500 Wave Analysis
- S&P 500 broke key resistance level 5500.00
- Likely to rise to resistance level 5700.00
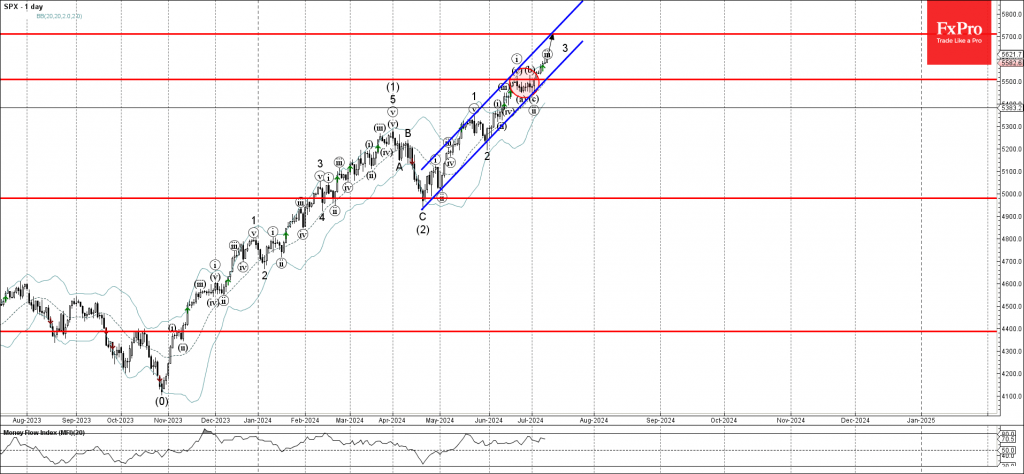
S&P 500 Index is under the bullish pressure after the price broke above the key resistance level 5500.00, which stopped the previous waves i and b at the end of June.
The breakout of the resistance level 5500.00 continues the active multi-impulse sequence made of the different-dimension nested impulse waves – iii, 3 and (3).
Given the clear daily uptrend, S&P 500 Index can be expected to rise further to the next resistance level 5700.00 (target price for the completion of the active impulse wave 3).
EURJPY Wave Analysis
- EURJPY broke the key resistance level 174.30
- Likely to rise to the resistance level 176.00
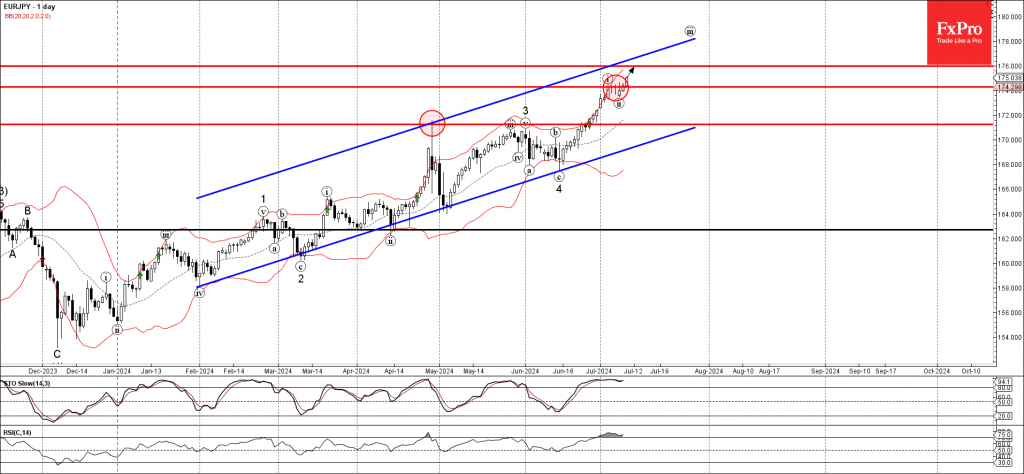
EURJPY currency pair recently broke above the key resistance level 174.30, which stopped the previous impulse wave I at the start of July.
The breakout of the resistance level 174.30 accelerated the active impulse wave iii of the higher upward impulse wave 5 from the middle of June.
Given the clear daily uptrend and widespread yen sales, EURJPY currency pair can be expected to rise further to the next resistance level 176.00.
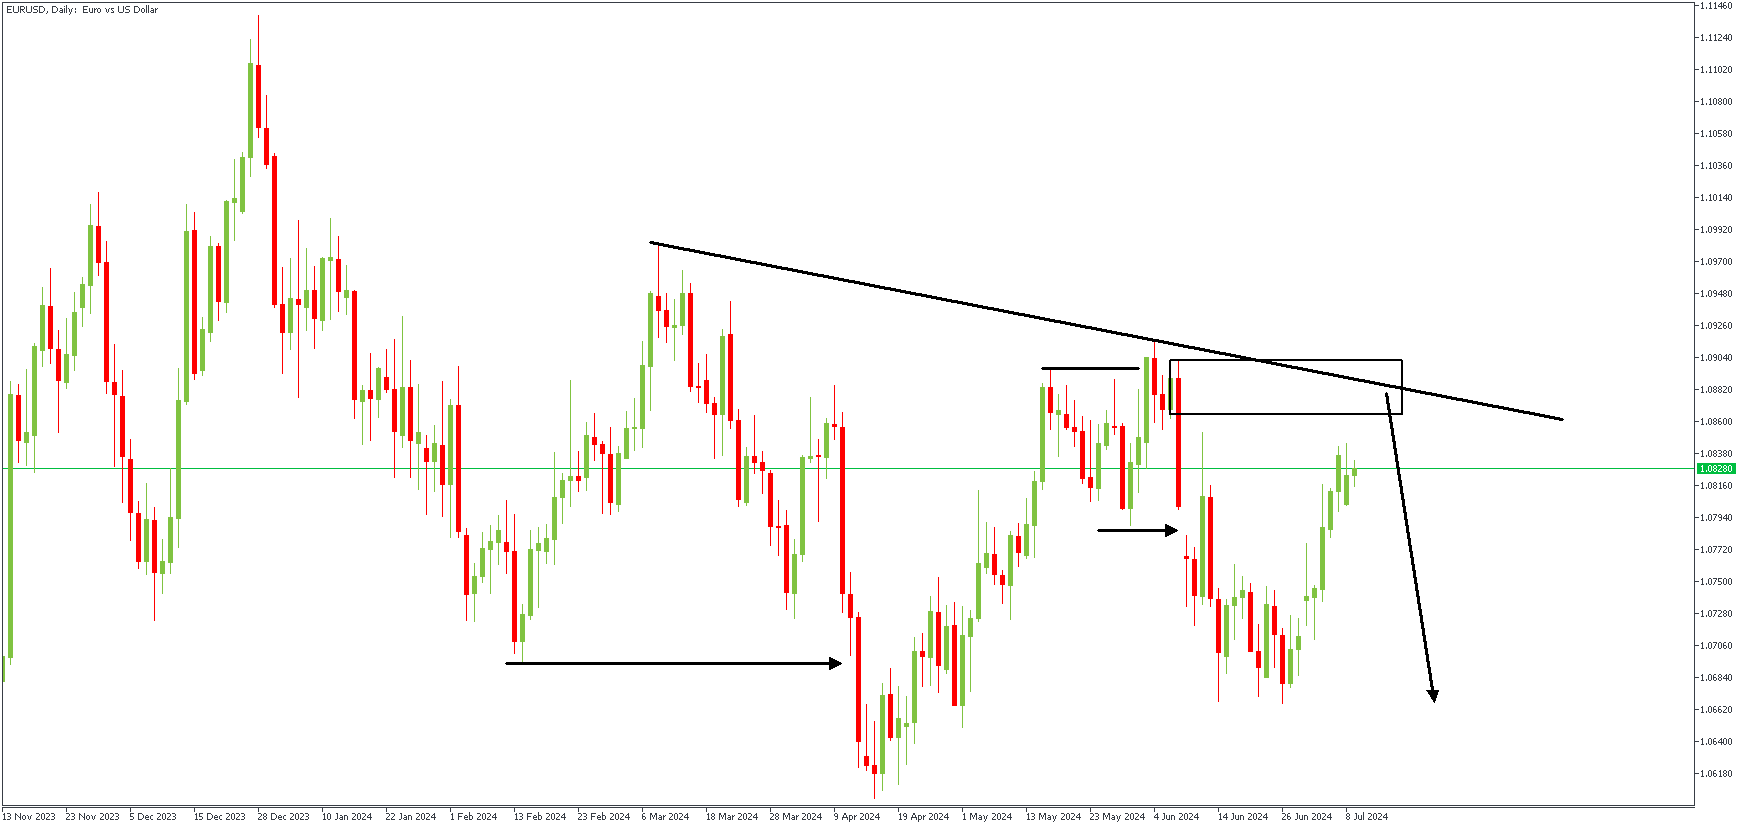
EURUSD: Bearish Delivery For CPI?
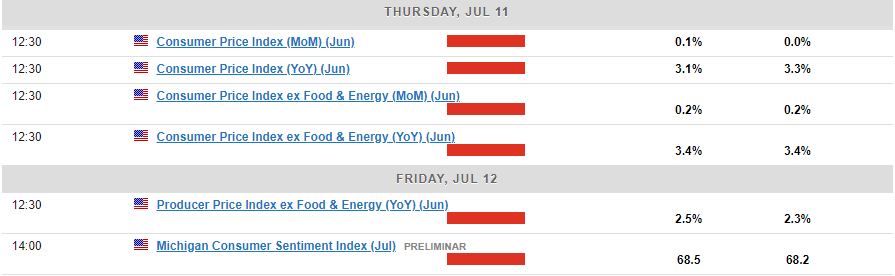
On Wednesday, the EURUSD pair remained steady around 1.0820, confined within a narrow range as the US Dollar continued its subdued trend. Federal Reserve Chairman Jerome Powell's testimony before Congress did little to provide clear market direction, despite his return to a hawkish stance on monetary policy. Market participants remain uncertain, as US economic indicators—growth, employment, and inflation—are progressing steadily without necessitating Fed intervention. Focus now shifts to Thursday's US Consumer Price Index (CPI) release, with annual inflation expected to rise by 3.1% in June and core CPI to remain unchanged at 3.4%. Additionally, speeches from Fed policymakers, including another testimony from Powell, will be closely watched for further insights.
EURUSD – D1 Timeframe
On the Daily timeframe chart as attached, we see the resistance trendline, as well as the SBR (Sweep-Break-Retest) pattern that seems to be the intent of the current price action. The supply zone is also pretty obvious, as it falls within the 76%-88% region of the Fibonacci retracement tool. To further confirm the bearish sentiment, let’s take a look at the lower timeframe price action.
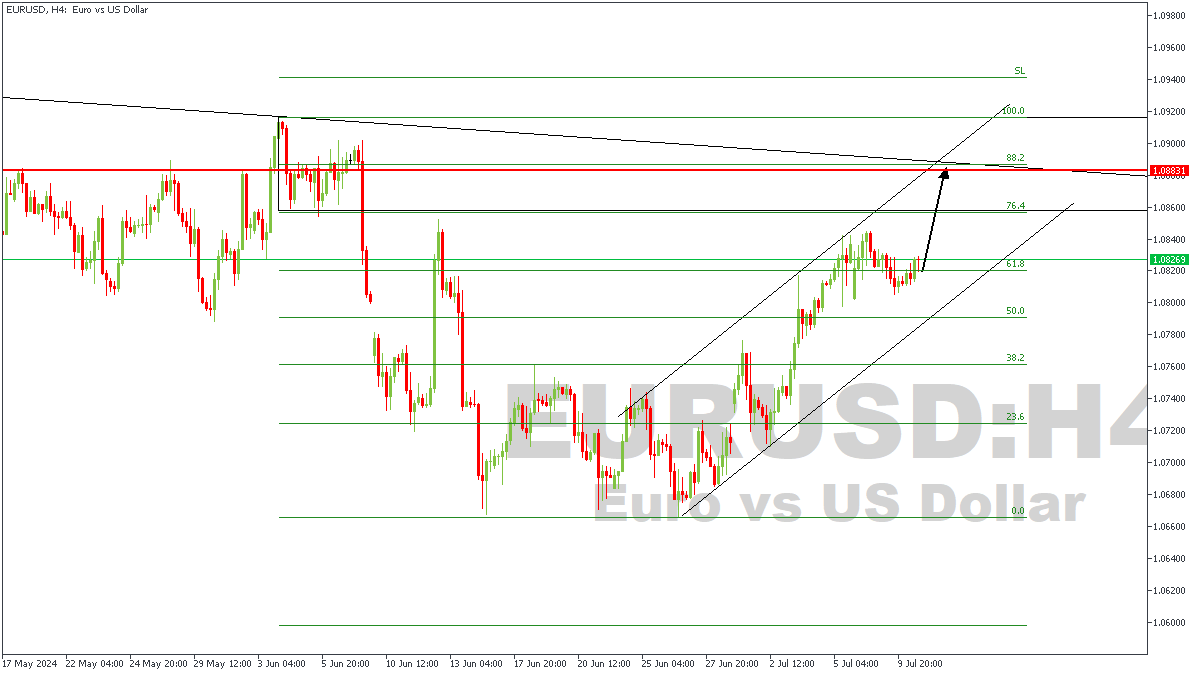
EURUSD – H4 Timeframe
Viewing the lower timeframe (the 4-hour chart) of EURUSD, we see price currently trading within an ascending channel as it heads for the resistance trendline that cuts across the 88% Fibonacci retracement level. On this basis, an aggressive initial entry can be taken from the area of confluence of the 3 lines, while a more conservative approach would be to wait for the break below the trendline support of the ascending channel before taking a shot at it.
Analyst’s Expectations:
- Direction: Bearish
- Target: 1.07060
- Invalidation: 1.09195
UK Data Eyed as Pound Celebrates Labour Win
- Monthly GDP and production figures for June on tap
- Strong data might hurt August rate cut expectations
- Pound flirts with $1.28 ahead of Thursday’s release (06:00 GMT)
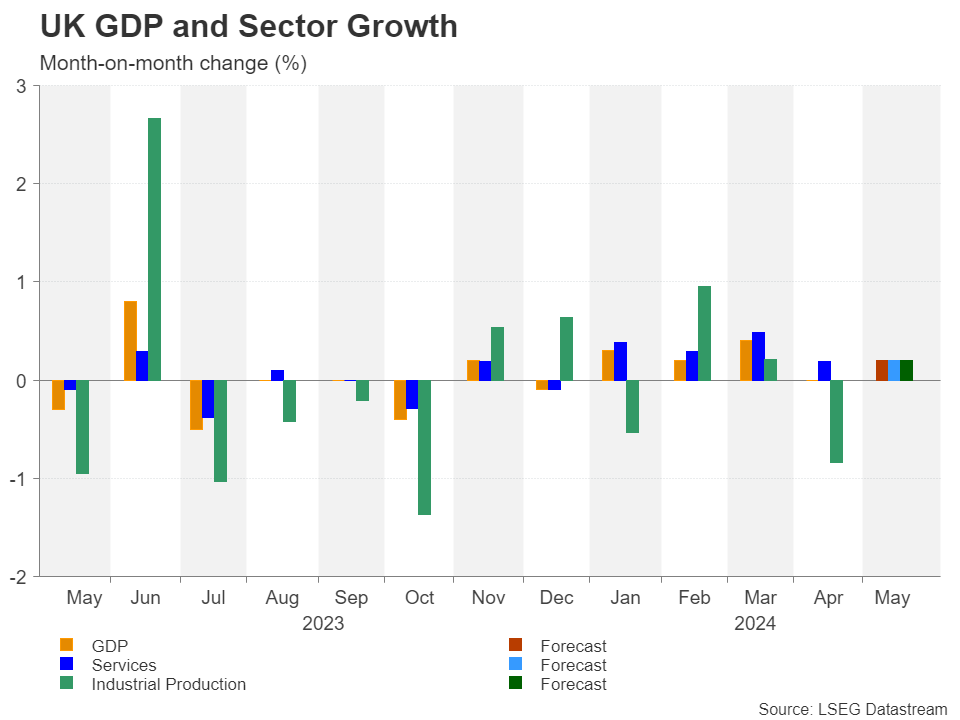
Uptick in GDP expected
The UK economy got off to a solid start this year, emerging strongly from a technical recession in the second half of 2023. GDP grew by an impressive 0.7% quarter-on-quarter in the January-March period. But growth came to a halt in April and investors will be watching the May data to see whether that was a blip or if the economy hit another soft patch in the second quarter.
Analysts are forecasting GDP to have risen by 0.2% month-on-month in May, pushing the annual rate up to 1.2%. The services sector and industrial production are also expected to have expanded by 0.2% m/m.
UK still a G7 laggard
Despite the turnaround, however, GDP growth has yet to return to its pre-Covid trend and Britain fares only better than Germany among the big, advanced economies when it comes to the post-pandemic recovery.
Hence, the UK economy is far from being in danger of overheating and unless there’s a notable upside surprise, the May figures are unlikely to pose a significant obstacle to the Bank of England starting its easing cycle soon. Investors have priced in around a 60% probability of a 25-basis-point rate cut at the August 1 meeting, with one additional cut expected before the year-end.
A brighter outlook?
The likelihood of the BoE cutting rates before the Fed hasn’t been too damaging to the pound. The British currency is the second-best performer of 2024 so far, behind only the US dollar. This is partly attributed to the brightening economic outlook, which may improve further now that the UK has a new government.
Prime Minister Keir Starmer and his Labour government have set boosting economic growth as one of their top priorities, while the political stability that their large parliamentary majority is expected to provide is also positive for sterling.
The pound is currently attempting to secure a foothold above the $1.2800 level after several sessions of testing the level. An upbeat set of data on Thursday could help its cause, bringing the March peak of $1.2893 back into scope.
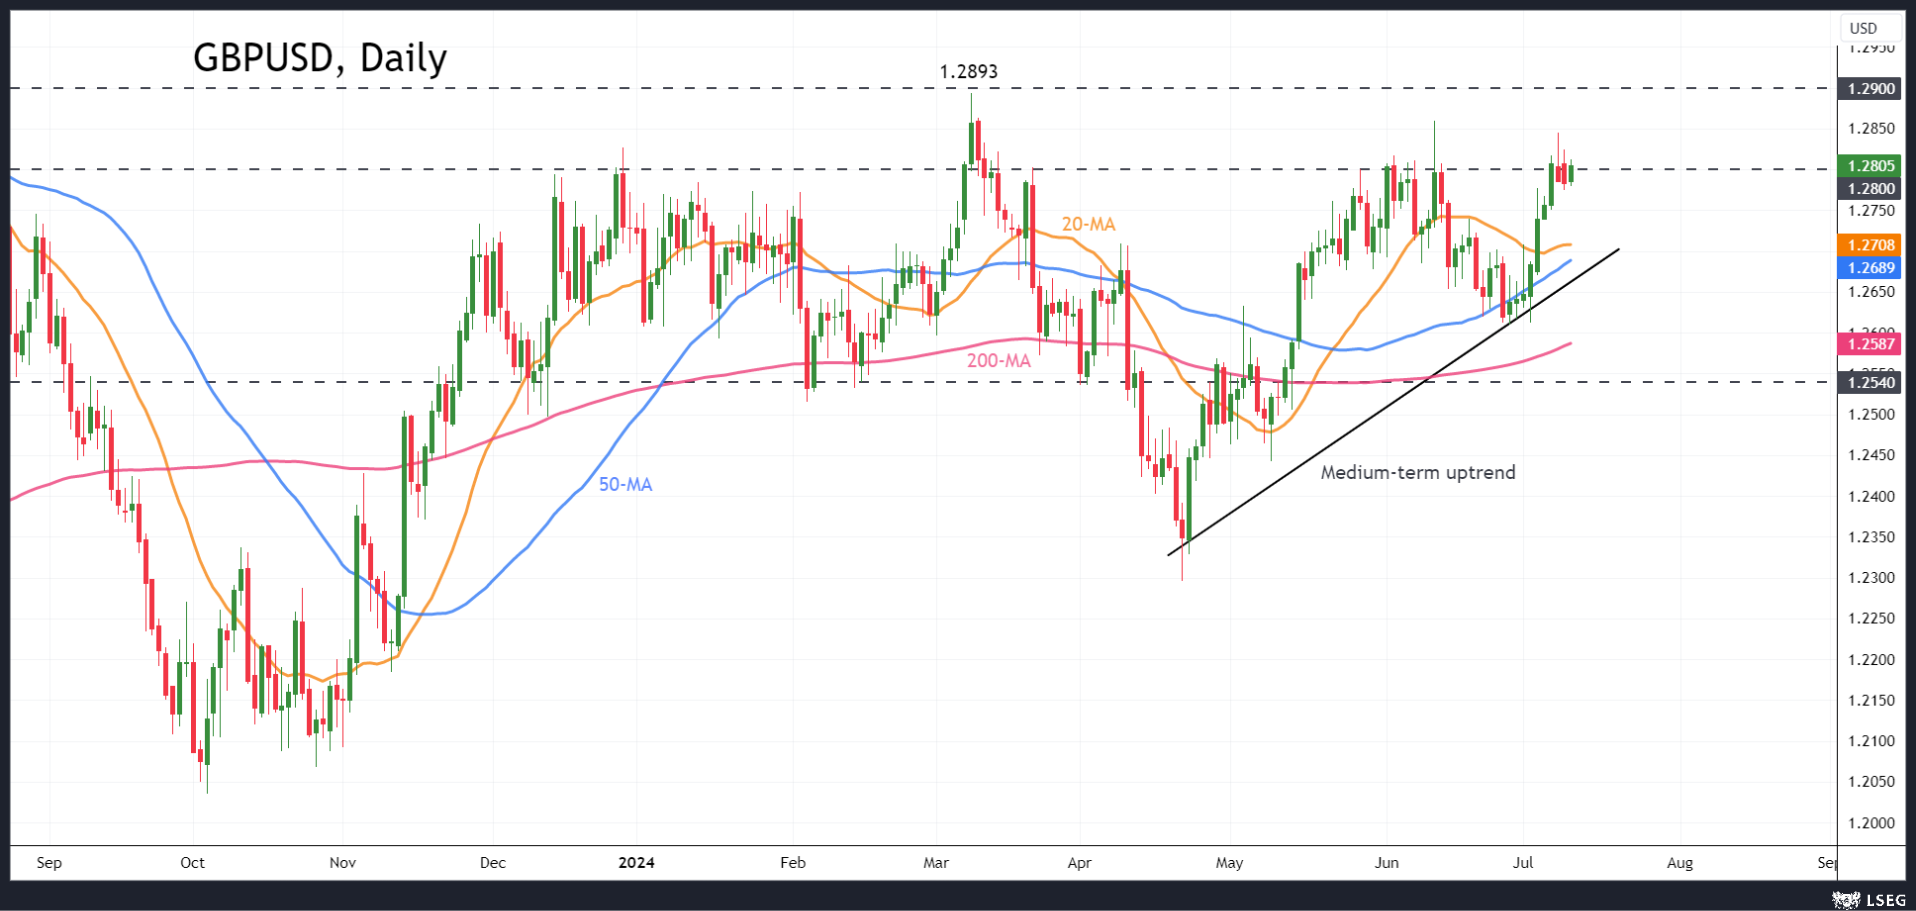
However, if the growth numbers disappoint, bolstering expectations of an August rate cut, the pound could dip all the way towards its 50-day moving average, currently at $1.2689.
On the whole, the GDP readings are not anticipated to be hugely consequential for BoE rate cut bets, especially as the CPI numbers for June are due a week later on July 17. If the CPI report shows headline inflation remaining close to 2.0% and the core rate declining further, that could seal the deal for an August move by the Bank of England.
GBPAUD Holds Above Key Support Area
- GBPAUD consolidates above key support zone
- RSI and MACD detect negative momentum
- But a break below 1.8900 is needed to darken the outlook
- A rebound above 1.9350 may invite more bulls
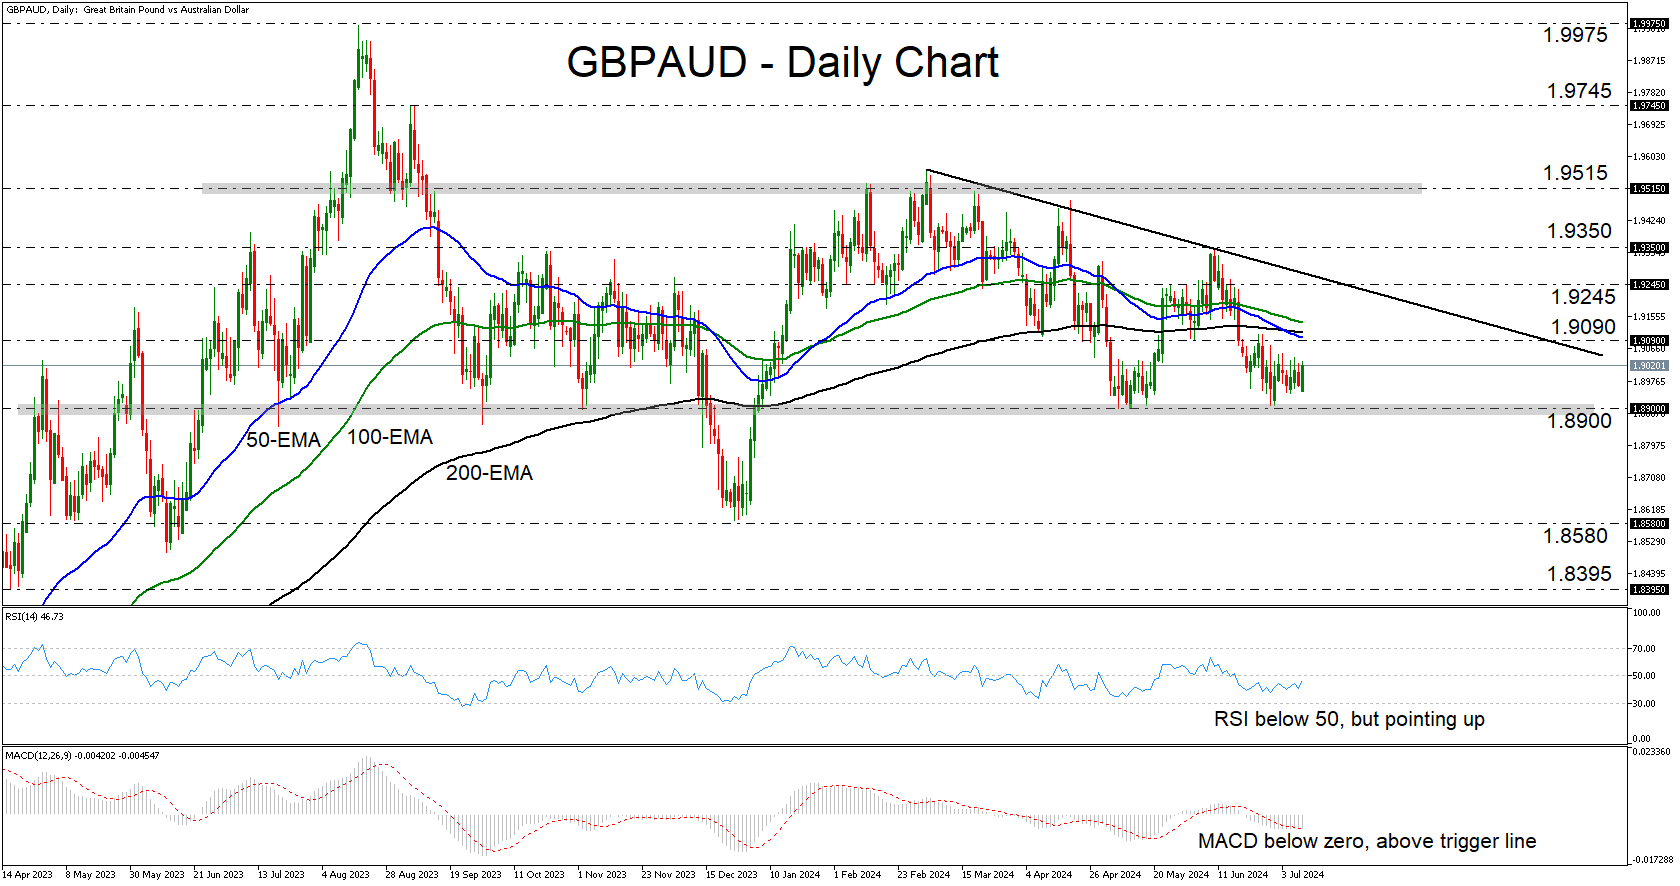
GBPAUD has been trading in a consolidative manner lately staying above the key support area of 1.8900, which prevented the bears from drifting south on several occasions during the last 12 months. However, the pair is also trading below a downward sloping trendline, suggesting that it may be a matter of time before we see a dip below 1.8900.
The RSI is lying below 50, but it is pointing up, while the MACD, although negative, has bottomed and crossed above its trigger line. Both indicators detect negative momentum, but they corroborate the notion that it is too early to start examining the case of further declines.
A break below 1.8900 could be the move that will give the green light to the bears, perhaps allowing extensions towards the low of December 27, at around 1.8580. A break lower could aim for the 1.8395 zone, marked by the low of April 18.
For the picture to start looking positive, a move above 1.9350 may be needed. GBPAUD would already be above the aforementioned downtrend line, and the bulls may feel confident to climb towards the key resistance zone of 1.9515.
Summarizing, GBPAUD is hovering above the key support zone of 1.8900, the break of which may invite more bears into the action.
Weak Inflation in China Clears the Way for Global Easing
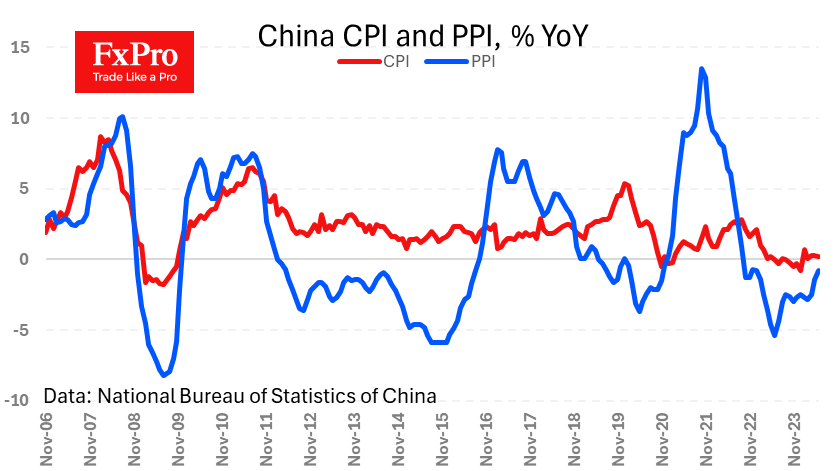
China’s consumer inflation slowed from 0.3% y/y to 0.2% instead of the expected acceleration to 0.4%, bringing investors’ attention back to weak demand. Meanwhile, manufacturing price deflation slowed from -1.4% y/y to -0.8% y/y, staying in negative territory for the past 20 months since October 2022.
China is once again spreading deflation around the world, as it did before 2018. However, the global effect is radically reduced by a slew of import duties that are raising domestic prices in developed countries to support alternative producers. Growing de-globalisation is the new pro-inflationary factor after waves of supply problems and energy price hikes in 2022.
When applied to the FX market, weak inflation is negative for the currency, suggesting monetary policy easing is a likely reaction from the Central Bank or acting as a manifestation of a weak economy. Prices in China also have an impact on a global level, so a fresh batch of rather soft figures suggests a further slowdown in price growth in the US and Europe, which is positive for global demand for risk assets.
Sunset Market Commentary
Markets
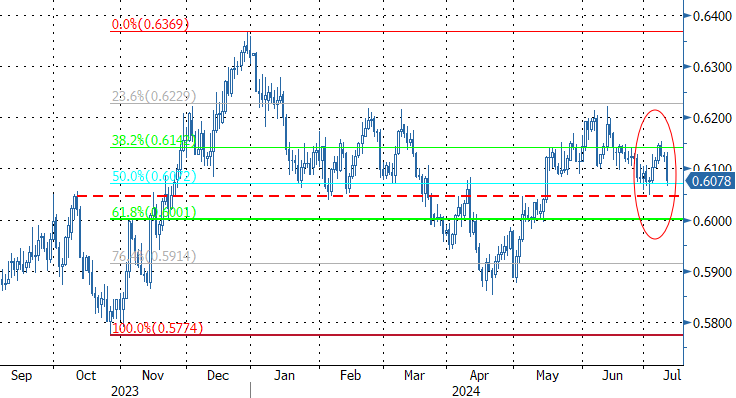
In today’s extremely dull trading session, some volatility in the New Zealand dollar, Norwegian krone and Czech koruna are keeping us somewhat entertained. You’ll find the latter two in the section down below. NZD is under pressure (NZD/USD 0.6078) following this morning’s central bank meeting. Its remarkable dovish pivot from a hawkish stance in May didn’t go unnoticed. Swap yields tumbled almost 20 bps at the front end of the curve and markets are now taking a first rate cut already in August into serious consideration (>50%). The sharp repricing followed after the RBNZ suddenly (i.e. without new actual data) sees inflation entering the target range already in the second half of the year, high domestically generated price pressures aren’t as much of a persistent problem as they thought less than two months ago and the economy is weakening according to unspecified “high frequency indicators”. This culminated in an addition to the policy statement saying that “The extent of this [monetary] restraint will be tempered over time consistent with the expected decline in inflation pressures.”, a clear hint for (near-term?) rate cuts.
There’s not much happening in core markets, not for obvious reasons anyways. Bunds underperform US Treasuring in a reversal of yesterday’s dynamics. German yields decline between 2.7 and 5.1 bps across the curve. US rates drop less than 2 bps ahead of Powell appearing before the House. If his Senate performance yesterday was already a non-event, then we don’t know how exactly to describe today’s do-over. Tonight’s $39 bn 10-yr bond auction is worth mentioning, to be followed by the $22 bn 30-yr one tomorrow, along with the June CPI release. Currencies other than the ones above trade listless.
News & Views
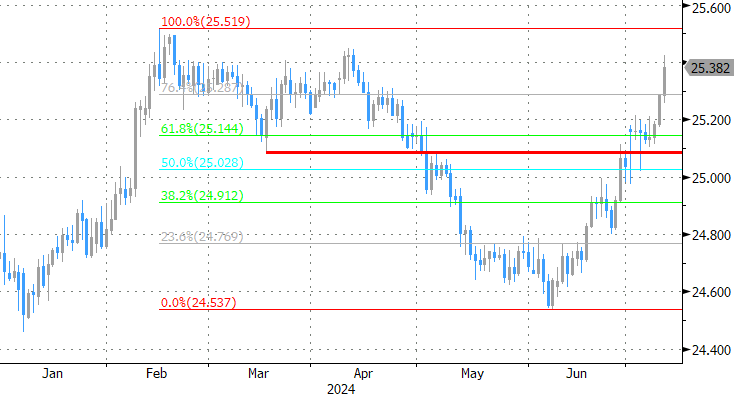
Inflation in the Czech Republic in June decelerated much faster than both markets and the Czech national bank (CNB) expected. Prices declined 0.3 M/M In June. Y/Y headline inflation dropped back from 2.6% to 2.0%, exactly returning to the CNB target. Monthly price decline occurred in several subcategories but with major contributions from transport (-1.2% M/M) and food and beverages (-0.6% M/M). Recreation and culture (+0.4%) and restaurants and hotels (0.5%) still recorded higher prices in a monthly perspective. In its spring forecast published early May, the CNB forecasted June inflation at 2.4% Y/Y. KBC expects headline inflation to decline further below the target in coming months taking into account announced summer and autumn energy price cuts. The CNB at its June meeting surprised at least part of the market as it maintained a 50 bps cutting pace (to 4.75%). However at that time, the bank indicated that from now it intended to slow the pace of further rate cuts or even make a pause if necessary. Given the June inflation data, the latter probably won’t be necessary anytime soon. Markets now discount additional 25 bps cuts at each of the remaining meetings this year. The expected loss of interest rate support continues to weigh on the Czech koruna. At EUR/CZK 25.38, the Czech currency is again with striking distance of the weakest levels of 2024 touched early February (EUR/CZK 25.52).
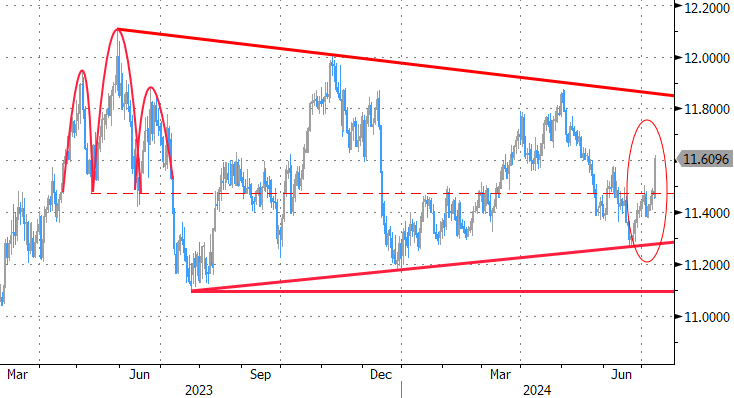
Inflation in Norway also slowed more than expected in June. Headline inflation printed at 0.2% M/M and 2.6% Y/Y from 3.0% in May. CPI-ATE inflation (adjusted for tax changes and excluding energy) eased to 0.2% M/M and 3.4% Y/Y (from 4.1% and 3.6% expected). Prices decreased in recreation and culture (-0.8% M/M), furnishings and household equipment (-0.4%) and clothing and footwear (-0.3%). Prices for restaurants & hotels (0.6%) and food and non-alcoholic beverages (1.9%) still rose. The slowdown in inflation should give some comfort to the Norges bank. At the June meeting it still was worried that wages could keep inflation higher than hoped for, potentially requiring tight policy for longer than it previously anticipated. NB indicated that the policy rate might be kept at 4.5% for the remainder of the year. The NB probably won’t be in a hurry to aggressively change guidance, but markets now see a growing chance (<50%) for an inaugural rate cut in December. The krone after the CPI release weakened sharply from EUR/NOK 11.47 to 11.59.
Graphs
EUR/NOK: Norwegian krone slips after CPI eases more than expected, questioning the central bank’s hawkish guidance
EUR/CZK closing in on the 2024 highs as unexpected monthly price drop brings Y/Y measure to CNB target
NZD/USD: kiwi dollar takes a hit from RBNZ’s remarkable dovish pivot
German 10-yr yield reverses yesterday’s rise, on track for a test of first support