
Sample Category Title
EUR/AUD Daily Outlook
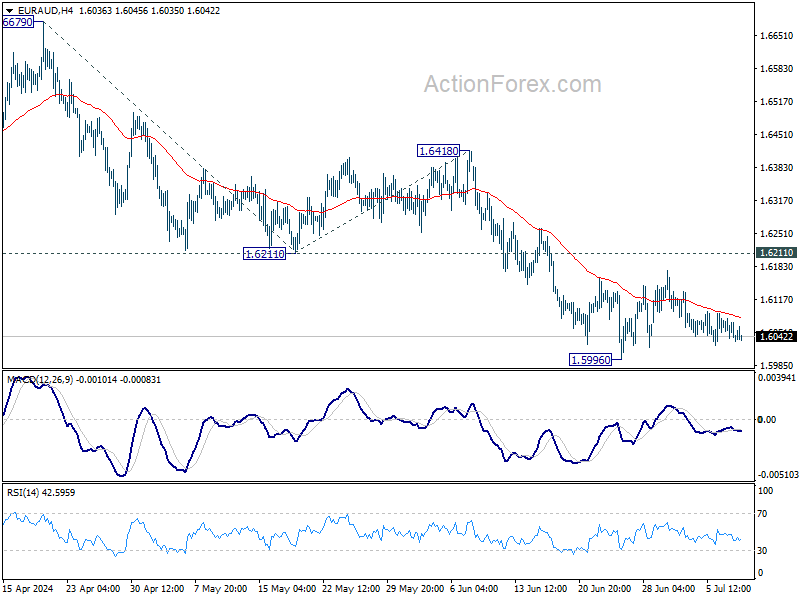
Daily Pivots: (S1) 1.6024; (P) 1.6053; (R1) 1.6071; More...
Intraday bias in EUR/AUD remains neutral for the moment. Consolidation from 1.5996 could extend further. Outlook will remain bearish as long as 1.6211 support turned resistance holds. On the downside, break of 1.5996 will target 100% projection of 1.6679 to 1.6211 from 1.6418 at 1.5950. Firm break there will target 1.5846 key support next.
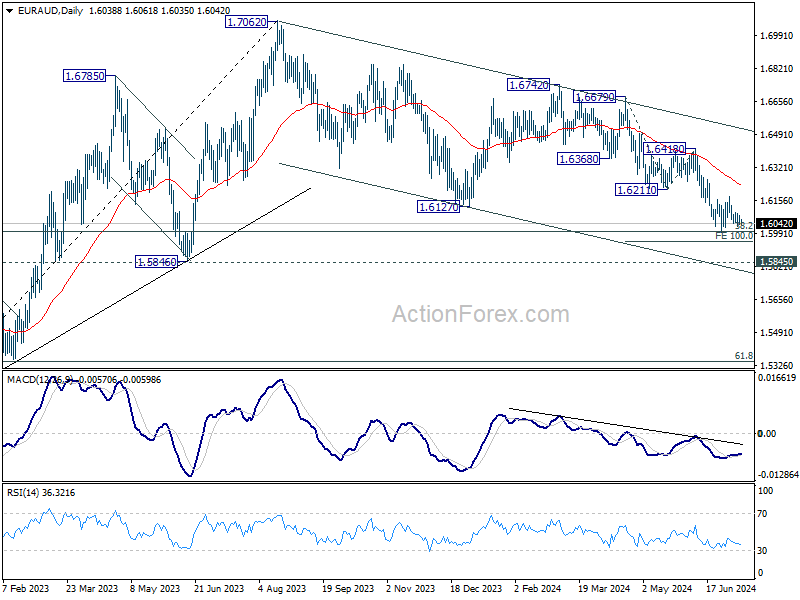
In the bigger picture, fall from 1.7062 medium term top is seen as a correction to the up trend from 1.4281 (2022 low) only. Strong support is still expected between 1.5846 and 38.2% retracement of 1.4281 to 1.7062 at 1.6000 to bring rebound. Break of 1.6148 resistance will argue that the correction has completed.
EUR/CHF Daily Outlook
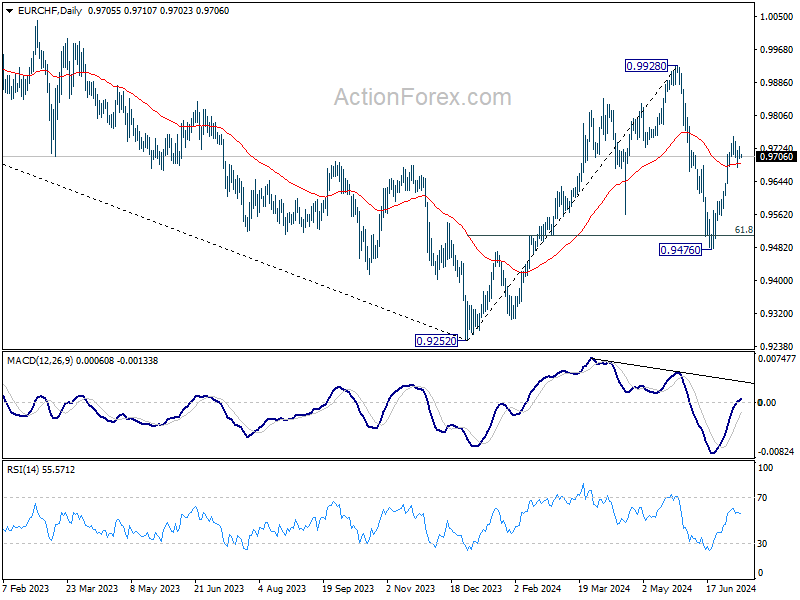
Daily Pivots: (S1) 0.9696; (P) 0.9714; (R1) 0.9727; More....
Intraday bias in EUR/CHF stays neutral at this point, as consolidation from 0.9754 is extending. Further rally is expected with 0.9639 support intact. On the upside, above 0.9754 will resume the rebound from 0.9476 to retest 0.9928 high. Nevertheless, break of 0.9639 will turn bias back to the downside for 0.9476 low instead.

In the bigger picture, rebound from 0.9252 medium term bottom might not be completed yet. But even in case of resumption, strong resistance could emerge from 1.0095 to limit upside. Medium term outlook will be neutral at best as long as 1.0094 structural resistance holds. Meanwhile, break of 0.9476 will bring retest of 0.9252 low.
USD/CAD Daily Outlook
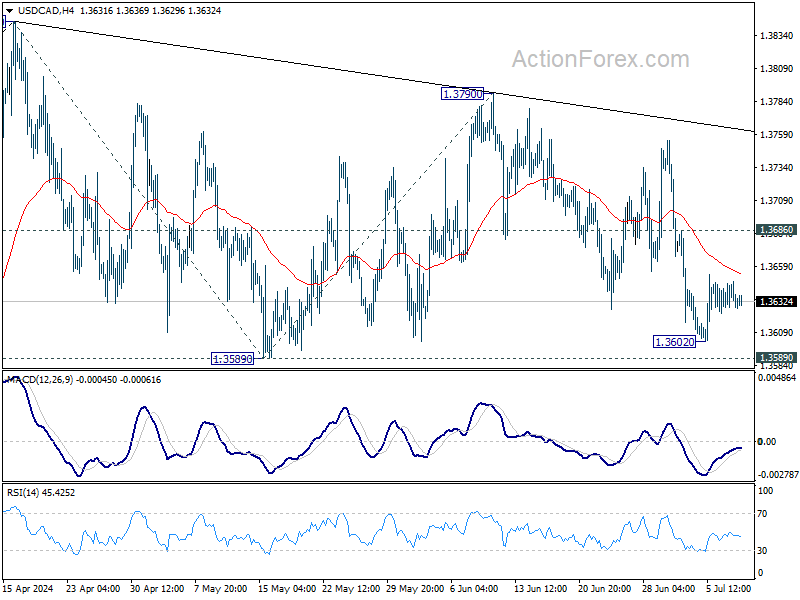
Daily Pivots: (S1) 1.3624; (P) 1.3636; (R1) 1.3647; More...
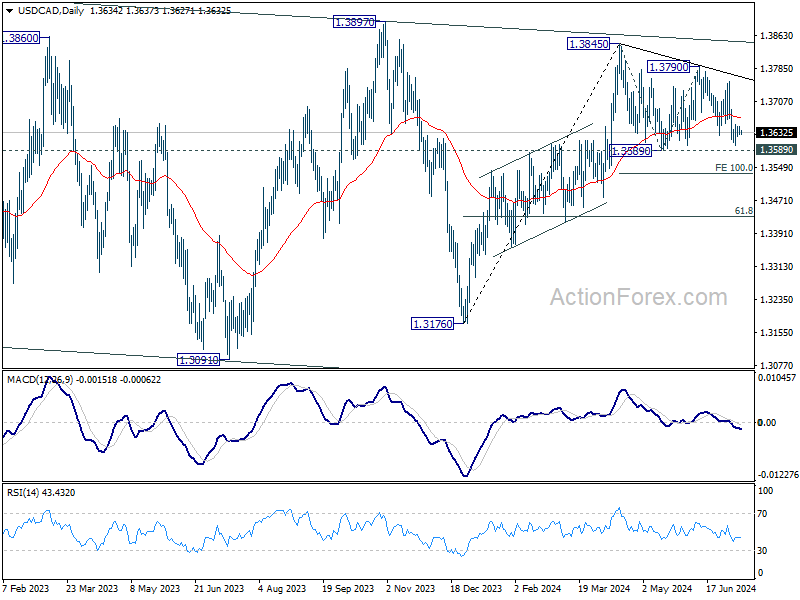
Outlook in USD/CAD remains unchanged and intraday bias stays neutral first. Corrective pattern from 1.3845 could still extend. Break of 1.3589 will target 100% projection of 1.3845 to 1.3589 from 1.3790 at 1.3534. Strong support would be seen there to bring rebound. On the upside, above 1.3686 minor resistance will turn bias back to the upside for 1.3790 resistance instead.
In the bigger picture, price actions from 1.3976 (2022 high) are viewed as a corrective pattern. In case of another fall, strong support should emerge above 1.2947 resistance turned support to bring rebound. Firm break of 1.3976 will confirm up resumption of whole up trend from 1.2005 (2021 low). Next target is 61.8% projection of 1.2401 to 1.3976 from 1.3176 at 1.4149.
AUD/USD Daily Report
Daily Pivots: (S1) 0.6727; (P) 0.6738; (R1) 0.6751; More...
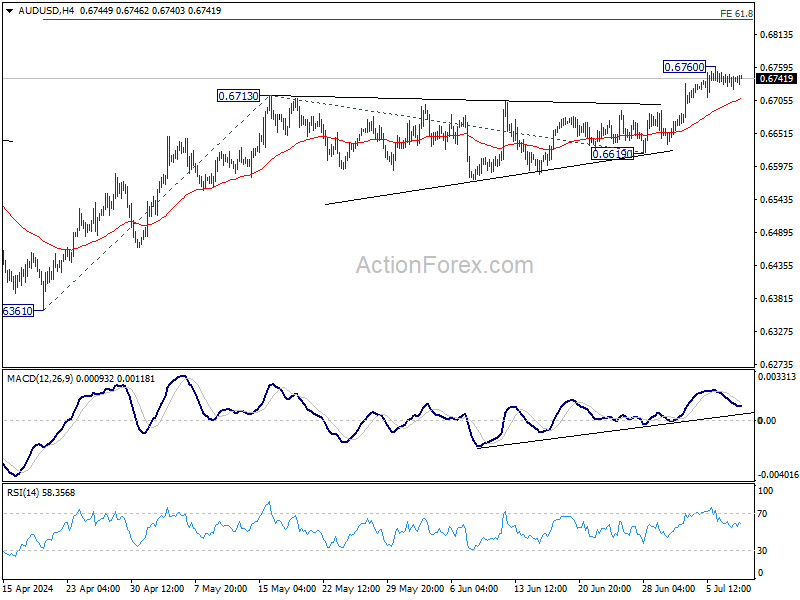
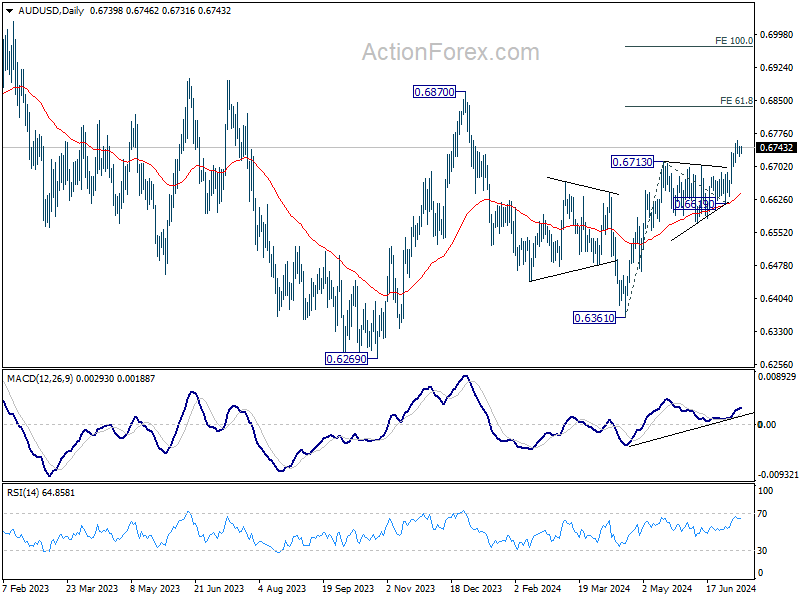
Intraday bias in AUD/USD remains neutral for consolidations below 0.6760 temporary top. Outlook will stay bullish as long as 0.6619 support holds. On the upside, break of 0.6760 will resume the whole rally from 0.6361. Next target is 61.8% projection of 0.6361 to 0.6713 from 0.6619 at 0.6837.
In the bigger picture, price actions from 0.6169 (2022 low) are seen as a medium term corrective pattern to the down trend from 0.8006 (2021 high). Fall from 0.7156 (2023 high) is seen as the second leg, which could have completed at 0.6269 already. Rise from there is seen as the third leg which is now trying to resume through 0.6870 resistance.
USD/JPY Daily Outlook
Daily Pivots: (S1) 160.85; (P) 161.18; (R1) 161.63; More...
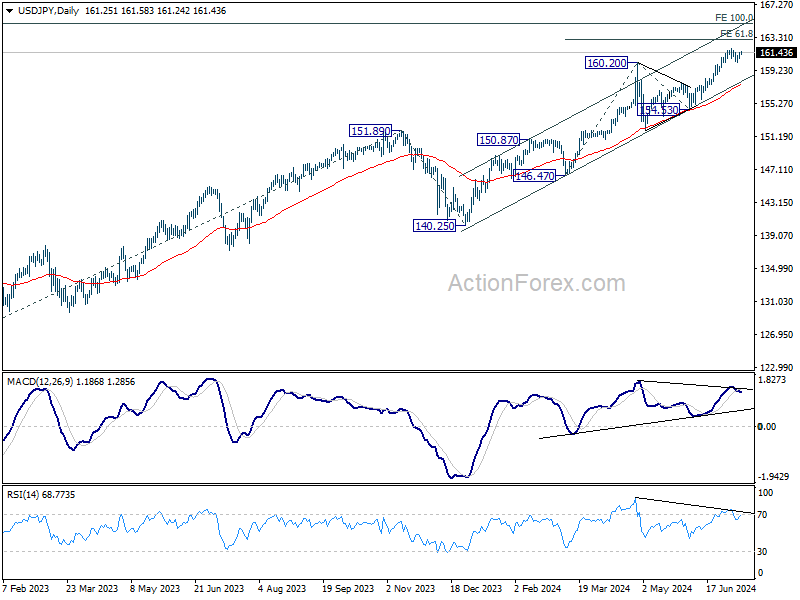
Intraday bias in USD/JPY remains neutral as range trading continues below 161.94. Further rally is expected with 160.25 minor support intact. On the upside, break of 161.94 will resume larger up trend to 61.8% projection of 146.47 to 160.20 from 154.53 at 163.01. Nevertheless, break of 160.25 will turn bias to the downside for deeper pullback.
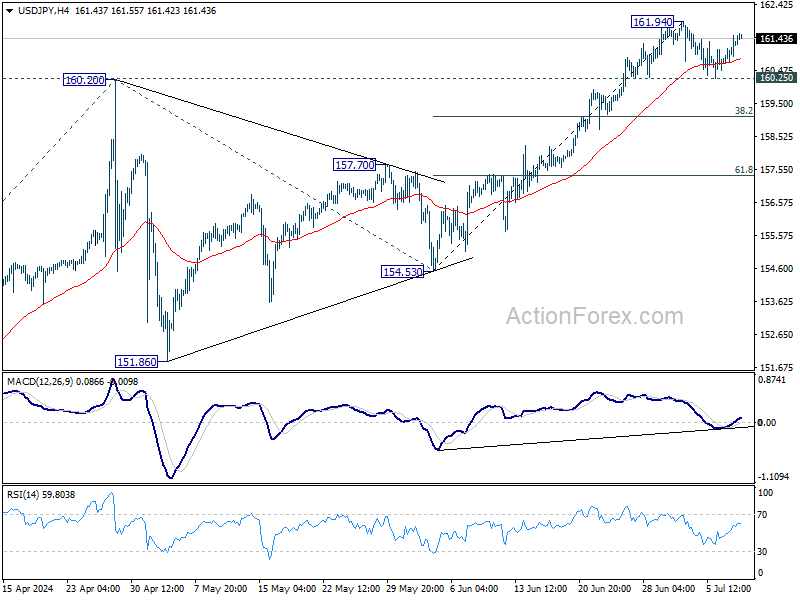
In the bigger picture, long term up trend is still in progress. Further rise is expected as long as 154.53 support holds. Next target is 100% projection of 127.20 (2023 low) to 151.89 (2023 high) from 140.25 at 164.94.
USD/CHF Daily Outlook
Daily Pivots: (S1) 0.8965; (P) 0.8978; (R1) 0.8991; More…
Intraday bias in USD/CHF remains neutral and outlook is unchanged. As noted before, rebound from 0.8825 could have completed at 0.9049, after rejection by falling channel resistance. Below 0.8942 will bring deeper fall to 0.8825 support. Nevertheless, break of 0.9049 will revive near term bullishness and resume the rebound from 0.8825 instead.

In the bigger picture, focus remains on 0.9223/9243 resistance zone. Decisive break there would suggest larger bullish trend reversal and turn outlook bullish. Nevertheless, rejection by 0.9223/43 will keep medium term outlook neutral at best, for more range trading between 0.8332/9243 first.

GBP/USD Daily Outlook
Daily Pivots: (S1) 1.2768; (P) 1.2797; (R1) 1.2815; More...
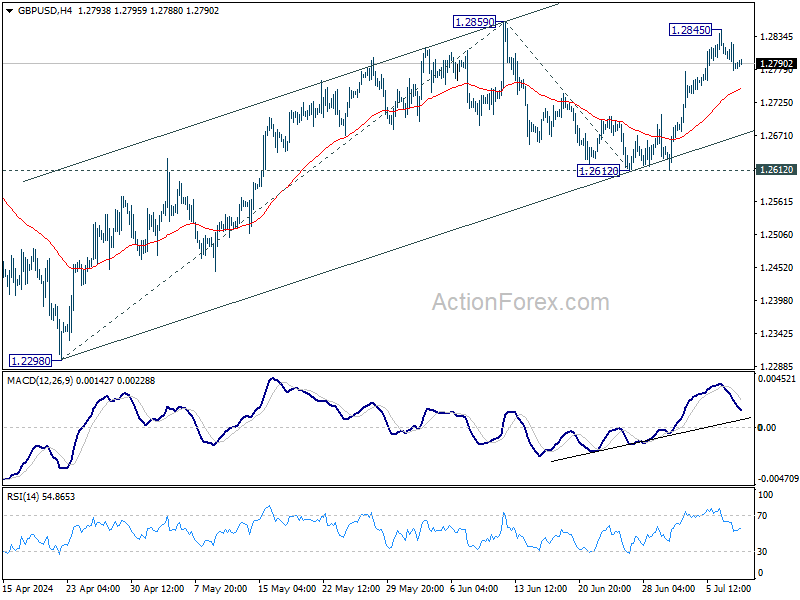
GBP/USD is staying in consolidation below 1.2845 temporary top and intraday bias remains neutral. Further rally is expected as long as 55 4H EMA (now at 1.2748) holds. Firm break of 1.2859 will resume the rally from 1.2298 and target 61.8% projection of 1.2298 to 1.2859 from 1.2612 at 1.2959. However, sustained break of 55 4H EMA will turn bias back to the downside for 1.2612 support instead.
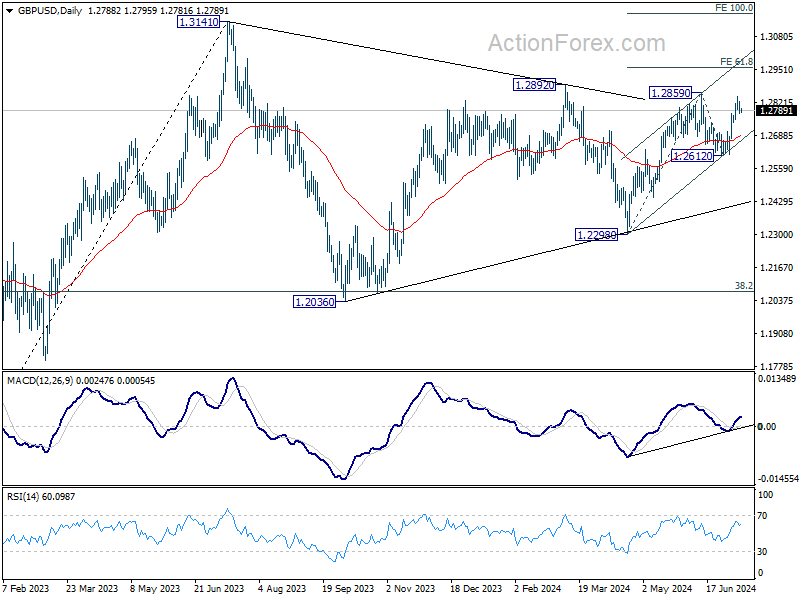
In the bigger picture, price actions from 1.3141 medium term top are seen as a corrective pattern which might still extend. Break of 1.2612 support will bring another fall to 1.2298 support and possibly below. Nevertheless, break of 1.2892 resistance will argue that larger up trend from 1.0351 might be ready to resume through 1.3141.
Inflation No Longer the Only Risk
Federal Reserve (Fed) Chair Jerome Powell’s testimony yesterday wasn’t overly optimistic but it revived the expectation that a rate cut could come sooner rather than later.
In the first day of his semiannual testimony before Senators, Powell said – for the first time in three years – that inflation is no longer the only threat to the US economy but the cooling jobs market also is. Although he didn’t want to offer a clear timeline when asked when the Fed would lower interest rates, Powell said that the latest jobs report sent a ‘pretty clear signal’ of a cooler labor market.
The main takeaway is that, moving forward, the jobs data will generate as much euphoria as the inflation numbers and investors will be more eager to put an accidental uptick, or less ideal inflation numbers, in perspective and remain confident that things – in terms of rate cut expectations – are moving toward the right direction.
As such, and with a strong sale of 3-year notes, the US 2-year yield didn’t take another dive but consolidated its advance to the south following last Friday’s soft jobs data near the 4.60%, the 10-year yield consolidated near 4.30% but the US dollar didn’t ease.
A selloff hit the euro after Moody’s warned France that its sovereign rating is at risk if its finances get any worse. The French 10-year yield jumped yesterday, but the spread with the German 10-year yield further eased. The EURUSD tested but found support near 1.08, while the European equities didn’t have a good session. The French CAC 40 dropped 1.56%, the German DAX fell 1.28, while the British FTSE 100 – which has nothing to do with the political shenanigans on the continent and which is, on the contrary, promising a much warmer and pleasant political weather, fell 0.65% as BP shed 20 points to the index following a 4.30% fall after predicting a writedown on the value of a plant in Germany of $1-2bn and warnings of ‘significantly lower’ refining margins. The news comes just a day after Exxon also gave a lower guidance for Q2 earnings – hurt by weaker gas prices and compressed refining margins. Exxon is also under a rising pressure these days, the stock price lost more than 10% since the April peak.
In energy, US crude cleared a minor Fibonacci support yesterday, the MACD turned negative for the first time in more than a month hinting that trend and momentum indicators are now in favour of a further downside correction. But oil is still in the medium-term positive trend that’s building since the beginning of June and support to this bullish trend sits near the $80pb. And there is a good chance that we see dipbuyers return to the market at this level as rising rate cut expectations are positive for reflation assets and oil is one of them.
Nat gas has been unable to stop the bleeding that started a month ago. Trend and momentum indicators remain bearish, but the market is approaching oversold market territory, which had, back in February, triggered a decent rebound.
Elsewhere, the rising rate cut expectations sent the S&P500 and Nasdaq to fresh records yesterday. Bank and tech stocks were particularly cheery. Bank stocks gained as Powell said that the regulators are close to changing their plan to force big banks to hold significantly more capital.
On the flip side of the world, inflation in China came in below expectations, while the Reserve Bank of New Zealand (RBNZ) maintained its policy rate unchanged at 5.5% for the 8th straight meeting and said that the policy will remain restrictive to make sure that inflation returns to their 1-3% target range. But, the bank hinted that the degree of restraint will be gradually adjusted to the expected decline in inflationary - which is expected to happen in the second half of the year. The kiwi-dollar tested the 200-DMA to the upside, but could well find support at this level if tomorrow’s US CPI update brings the Fed doves and the dollar bears back in charge.
EUR/USD Daily Outlook
Daily Pivots: (S1) 1.0802; (P) 1.0824; (R1) 1.0845; More....
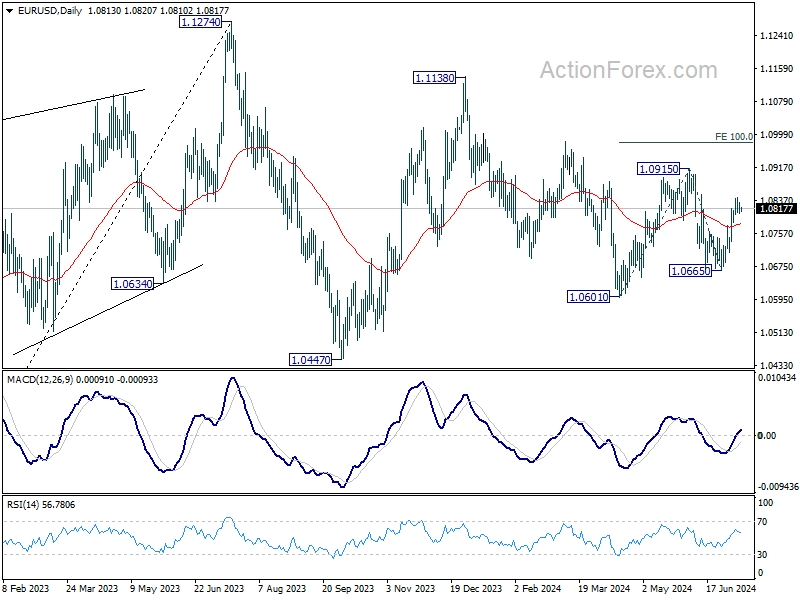
EUR/USD is extending consolidation below 1.0844 temporary top, and intraday bias remains neutral for the moment. Further rally is in favor as long as 55 4H EMA (now at 1.0786) holds. On the upside, above 1.0844 will resume the rebound from 1.0665 to retest 1.0915 resistance. Firm break there will target 100% projection of 1.0601 to 1.0915 from 1.0665 at 1.0919 next. However, sustained break of 55 4H EMA will bring deeper fall back to 1.0665 support.
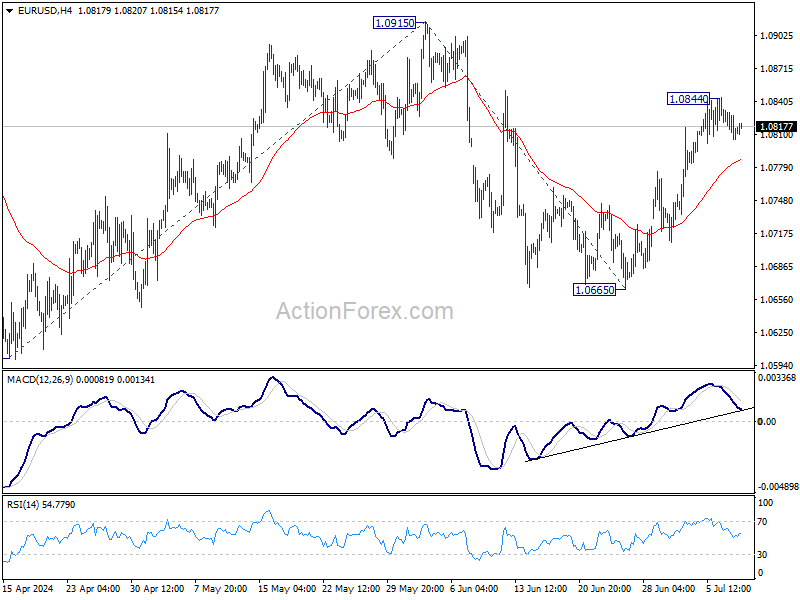
In the bigger picture, price actions from 1.1274 are viewed as a corrective pattern that's still in progress. Break of 1.0601 will target 1.0447 support and possibly below. On the upside, firm break of 1.0915 resistance will start another rising leg back to 1.1138 resistance instead.
NZD Tumbles on RBNZ Rate Cut Hints; Markets Largely Ignore Fed’s Powell
New Zealand Dollar plunged sharply after RBNZ's more dovish than expected statement caught the market off guard. RBNZ's indication of potential future rate cuts was unexpected, even though it's not a hint on an imminent move.
The central bank's timing of this shift in tone is puzzling, as Q2 CPI data will only be available next week and updated economic forecasts are expected in August. There is no apparent urgency for RBNZ to tweak the statement at this meeting.
Traders quickly adjusted their expectations, now betting on rate cuts later this year. While August might be too soon, November now appears to be a more probable timeframe for the first reduction.
In the broader currency markets, Yen is also suffering, continuing its recent selloff. Dollar is the third worst performer today at this point. Markets showed little reaction to Fed Chair Jerome Powell's first day of semiannual testimony overnight, instead turning their focus to the upcoming US CPI release tomorrow. Swiss Franc leads the gains for the day, followed by Euro and Sterling, with Australian Dollar and Canadian Dollar trading in the middle.
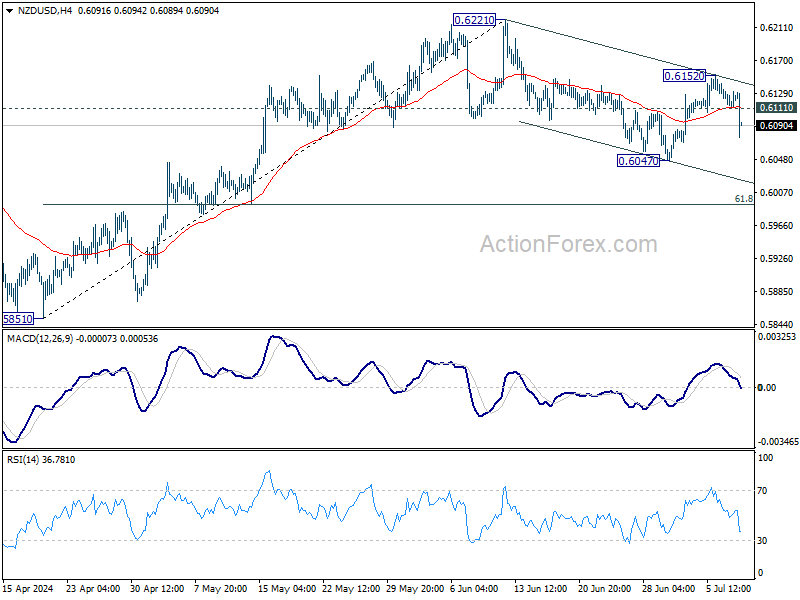
Technically, NZD/USD's steep fall suggests that recovery from 0.6047 has completed at 0.6152 already. Corrective decline from 0.6221 might be ready to resume. Deeper fall is expected as long as 0.6111 minor resistance holds. Break of 0.6047 will target 61.8% retracement of 0.5851 to 0.6221 at 0.5992.
In Asia, at the time of writing, Nikkei is up 0.43%. Hong Kong HSI is down -0.07%. China Shanghai SSE is down -0.50%. Singapore Strait Times is up 0.62%. Japan 10-year JGB yield is up 0.012 at 1.088. Overnight, DOW fell -0.13%. S&P 500 rose 0.07%. NASDAQ rose 0.14%. 10-year yield rose 0.031 to 4.300.
RBNZ holds rates at 5.50%, softens hawkish tone
RBNZ left OCR unchanged at 5.50%, as widely expected. The central bank softened its hawkish stance in the accompanying statement, indicating that the extent of monetary restriction "will be tempered over time consistent with the expected decline in inflation pressures." Markets interpreted this as a signal that RBNZ is moving closer to lowering interest rates.
RBNZ also acknowledged that its restrictive monetary policy has "significantly reduced consumer price inflation," with headline inflation expected to return to the 1-3% target band "in the second half of this year." This decline in inflation reflects both receding domestic pricing pressures and lower inflation for imported goods and services. Additionally, labor market pressures have eased.
While domestically generated price pressures "remain strong," RBNZ said there are signs that "inflation persistence will ease in line with the fall in capacity pressures and business pricing intentions."
AUD/NZD soars after RBNZ, more upside if policy diverges with RBA
AUD/NZD soars sharply higher after RBNZ softened its hawkish stance, incorporating language in its latest statement that suggests a shift towards monetary easing. This change has created prospects for stronger rally in the cross, driven by policy divergence between RBNZ and RBA.
In particular, if RBNZ moves to cut interest rates sooner than previously projected, while RBA raises rates in response to strong Q2 Australian inflation data, AUD/NZD could see even more significant gains in the medium term.
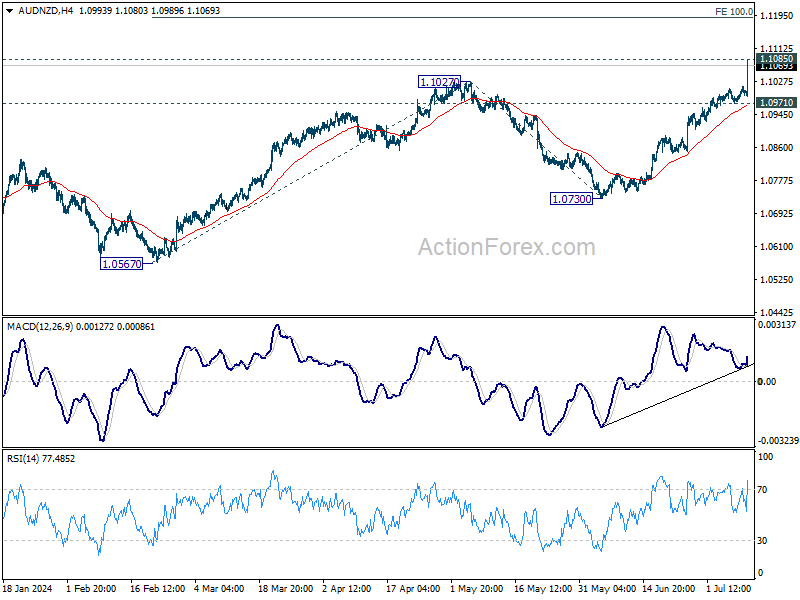
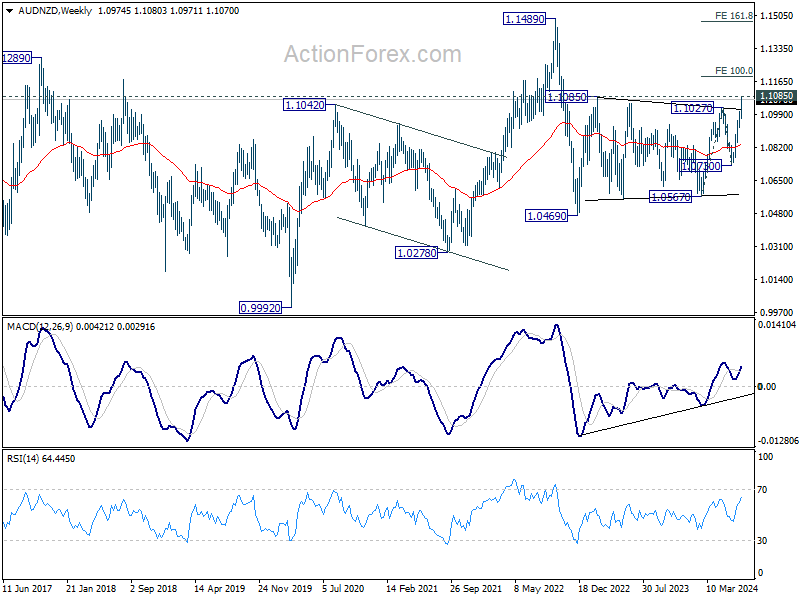
Technically, immediate focus is now on 1.1085 key medium term resistance (2023 high). Firm break there will confirm whole rebound from 1.0469 (2022 low). Next target will be 100% projection of 1.0567 to 1.1027 from 1.0730 at 1.1190.
Strong break of 1.1190 would bring upside acceleration to 161.8% projection at 1.1474 in the medium term. In any case, near term outlook will stay bullish as long as 1.0971 support holds for now.
China's CPI slows to 0.2% in Jun, PPI negative for 21st month
China's CPI slowed to 0.2% yoy in June, down from 0.3% yoy in May, missing expectations of a 0.4% yoy increase. Core CPI, which excludes volatile food and energy prices, rose by 0.6% yoy, unchanged from May, but slightly slower than the 0.7% increase observed in the first half of the year.
On a month-on-month basis, inflation remained negative in June, with CPI falling by -0.2%, following a -0.1% decrease in May. This continued negative trend reflects ongoing deflationary pressures in the economy.
PPI fell by -0.8% yoy, improving from the prior month's -1.4% yoy decline and matching market expectations. Despite the slight improvement, PPI has remained negative for the 21st consecutive month, indicating persistent weakness in industrial prices.
Looking ahead
Italy industrial production will be released in European session. US will release wholesale inventories final, and crude oil inventories. That's it for economic data. Nevertheless, some focuses could be put on BoE Chief Economist Huw Pill's speech as well as Fed Chair Jerome Powell's testimony day 2.
EUR/USD Daily Outlook
Daily Pivots: (S1) 1.0802; (P) 1.0824; (R1) 1.0845; More....
EUR/USD is extending consolidation below 1.0844 temporary top, and intraday bias remains neutral for the moment. Further rally is in favor as long as 55 4H EMA (now at 1.0786) holds. On the upside, above 1.0844 will resume the rebound from 1.0665 to retest 1.0915 resistance. Firm break there will target 100% projection of 1.0601 to 1.0915 from 1.0665 at 1.0919 next. However, sustained break of 55 4H EMA will bring deeper fall back to 1.0665 support.
In the bigger picture, price actions from 1.1274 are viewed as a corrective pattern that's still in progress. Break of 1.0601 will target 1.0447 support and possibly below. On the upside, firm break of 1.0915 resistance will start another rising leg back to 1.1138 resistance instead.
Economic Indicators Update
| GMT | Ccy | Events | Actual | Forecast | Previous | Revised |
|---|---|---|---|---|---|---|
| 23:50 | JPY | PPI Y/Y Jun | 2.90% | 2.90% | 2.40% | 2.60% |
| 01:30 | CNY | CPI Y/Y Jun | 0.20% | 0.40% | 0.30% | |
| 01:30 | CNY | PPI Y/Y Jun | -0.80% | -0.80% | -1.40% | |
| 02:00 | NZD | RBNZ Interest Rate Decision | 5.50% | 5.50% | 5.50% | |
| 08:00 | EUR | Italy Industrial Output M/M May | 0.20% | -1.00% | ||
| 14:00 | USD | Wholesale Inventories May F | 0.60% | 0.60% | ||
| 14:30 | USD | Crude Oil Inventories | 0.7M | -12.2M | ||
| 18:00 | USD | Fed's Beige Book |