
Sample Category Title
Euro Shrugs as Investor Confidence Tumbles
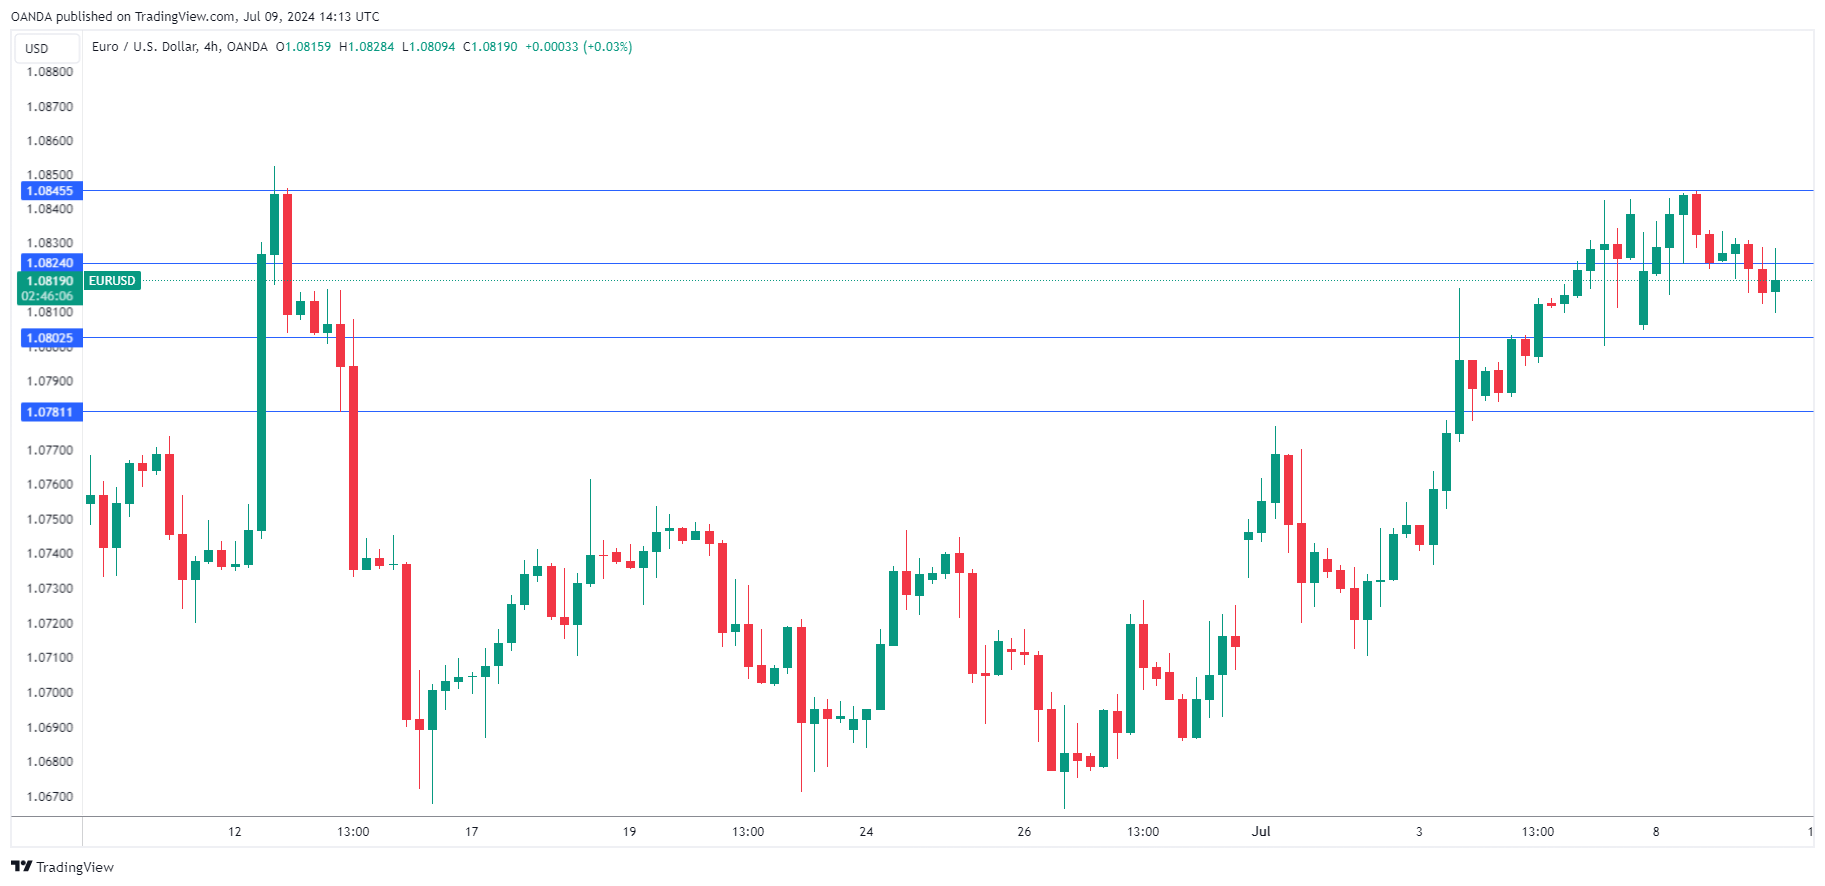
The euro is showing little movement on Tuesday. EUR/USD is trading at 1.0819, up 0.05% on the day.
The eurozone Sentix Investor Confidence index resumed its losing ways on Monday. The index slid to -7.3 in July, after a 0.3 gain in June. Prior to the June reading, the index had declined continuously since March 2022. There have been signs that the eurozone economy is finding its feet but investors aren’t showing any optimism over the eurozone’s economic outlook.
The inflation picture has improved greatly in the eurozone. The ECB’s steep rate-tightening cycle has slashed inflation from double-digits down to 2.5% in June. Inflation is still above the ECB’s inflation target of 2% but the central bank took the plunge and lowered rates last month, confident that inflation will move lower.
ECB Vice President Luis de Guindos said last week that he expected a “bumpy road” for inflation in the coming months and that there was no predetermined path for rate decisions. The markets have priced in a cut at the July 18 meeting at 33% but see a strong chance of two rate cuts before the end of the year. Whether that forecast materializes will depend to a large extent on inflation data. ECB policy makers are particularly concerned about services inflation, which is running at a 4.1% clip.
Fed’s Powell testifies on Capitol Hill
Fed Chair Powell is testifying about monetary policy before a Senate banking committee and the markets will be looking for clues about a September rate cut. Powell sounded hawkish at the ECB forum in Portugal last week, reiterating that the Fed needs to see further evidence that inflation will continue to fall before hitting the rate-cut button. The markets are more optimistic and smell a September cut. The probability of such a move has climbed to 72%, compared to 63% a week ago and just 46% one month ago, according to the CME’s FedWatch tool.
EUR/USD Technical
- EUR/USD is testing resistance at 1.0824. Above, there is resistance at 1.0845
- 1.0802 and 1.0781 are providing support
Fed’s Powell highlights risks beyond elevated inflation
In his prepared remarks for the semiannual testimony to Congress, Fed Chair Jerome Powell reiterated that it is not appropriate to cut interest rate until there is "greater confidence" that inflation is moving sustainably toward 2%.
Nevertheless, He noted that recent inflation readings have shown "modest further progress," and that "more good data" would strengthen this confidence.
Powell emphasized the Fed's "meeting by meeting" decision-making process, warning that reducing policy restraint "too soon or too much" could "stall or even reverse the progress" on inflation.
Yet, he also acknowledged that, with significant progress made in lowering inflation and cooling the labor market over the past two years, "elevated inflation is not the only risk" faced by the Fed. Delaying policy adjustments "too late or too little" could "unduly weaken economic activity and employment."
Sunset Market Commentary
Markets
European markets were captured in an indecisive trading pattern yesterday, in the wake of the surprise win of the left alliance in the French elections. Spreads of France (and other peripheral EMU countries) initially tightened marginally as none of the extreme parties secured a majority to implement uncontrolled spending. However, from a longer term perspevtive, the fiscal situation in most semi-core and peripheral countries remains challenging. Today most intra-EMU spreads (including of France) again (partially) reversed yesterday’s tentative narrowing (France +2 bps vs Bunds, Spain & Belgium also +2 bps) . The European fiscal premium is here to stay (cf infra). In technical trading, German yields added between 1.5 bps (2-y) and 2.5 bps (30-y). At least for now, investors stay cautious to push for a more aggressive pricing on further ECB interest rate cuts (September not yet fully discounted). US markets in the meantime almost fully discount two 25 bps Fed rate cuts toward the end of the year in the wake of recent softer price and labour market data. In this respect markets at least expect some opening from Fed Chair Powell at the hearing before the Senate Banking Committee that recent data, if confirmed, might give the Fed more confidence to cut rates earlier than what was guided by the June Fed dots (one 25 bps cut this year, four next year). At the time of writing, no text of Powell’s appearance is available yet. US yields are are rising marginally (< 2.0 bps) going into Powells’ hearing. European equities remain in the defensive (EuroStoxx 50 -0.9%). US equities (S&P +0.2%, Nasdaq + 0.35%) are holding near/at record levels.
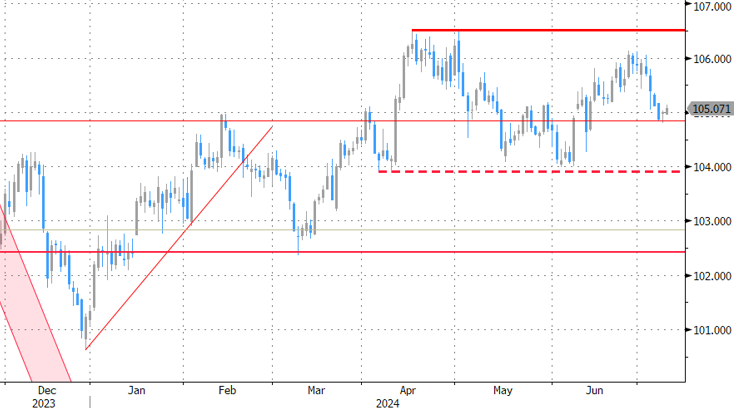
Very little to report on the major FX cross rates. The dollar gains marginally (DXY 105.1). EUR/USD fails to buid on recent constructive momentum (EUR/USD 1.082). The yen again weakens north of USD/JPY 161 (1). Sterling (Cable 1.281) also takes a breather ahead of key resistance (1.2860/94).
News & Views
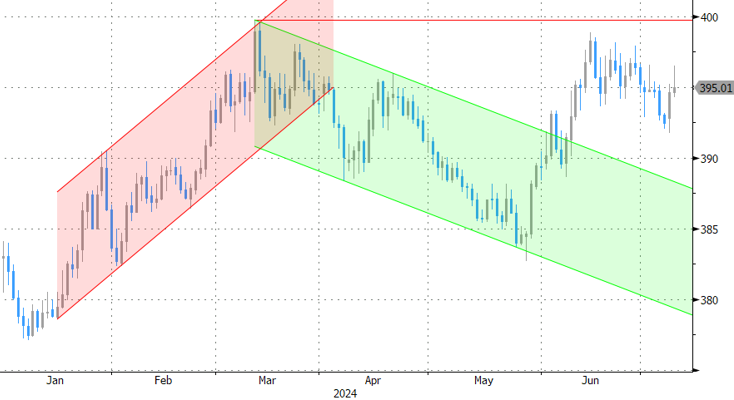
Hungarian inflation came in slower than expected in June. Prices were unchanged on a monthly basis, missing the bar for a 0.2% rise. The y/y figure as a result eased from 4% to 3.7% vs 3.9% consensus, thereby revisiting the upper range of the central bank’s 3% +/- 1 ppts target. Declining prices for food (-0.3% m/m) and for electricity, gas and other fuels (-2.3% m/m) were compensated by higher prices for alcoholic beverages and tobacco (+1%) and services (+1%). Core inflation across all gauges is still above target, ranging from 4.1% to 5.6%. High core CPI is one of the Hungarian central bank’s key worries, along with fears that sharp (real) wage gains could reignite already elevated inflation again. It downshifted the cutting pace to 25 bps (to 7%) last month and hinted it entered a different monetary phase where it won’t cut rates at each and every next meeting. The bumpy inflation path, delayed Fed & slow ECB cuts as well as a generally weak forint mean the central bank has to tread cautiously. Hungarian swap yields do drop around 7.5 bps in the wake of today’s release. Money markets assume around three more 25 bps cuts by the end of the year, in line with the KBC scenario. EUR/HUF is hovering around 395.
Rating agency Moody’s said the outcome of the French parliamentary elections is a negative for the country’s credit rating. "In light of the constraints that any future government faces, we are unlikely to see expenditure-based fiscal consolidation in 2025," Moody's said in a note referring to the fiscal implications of a hung parliament. Further tax hikes are also unlikely, it added, noting that the country’s tax-to-GDP is already the highest in the OECD. France enjoys a Aa2 rating with a stable outlook at Moody’s. In its first comment since Labour’s landslide victory in the UK, rating agency S&P pointed out that stronger economic growth is key to stabilize the country’s rising public debt. S&P forecasts the UK’s debt ratio to hit 100% ratio next year and expects the new government to uphold a commitment to improve public finances. The country’s AA rating with a stable outlook at S&P is one notch higher than at rating peers Fitch (AA-) and Moody’s (Aa3-).
Graphs
EUR/HUF: forint stays in the defensive as soft June CPI data keep debate on further rate cuts alive.
US 2-y yield: dropped below 4.70% support as markets see the Fed giving more weight to softer labour data.
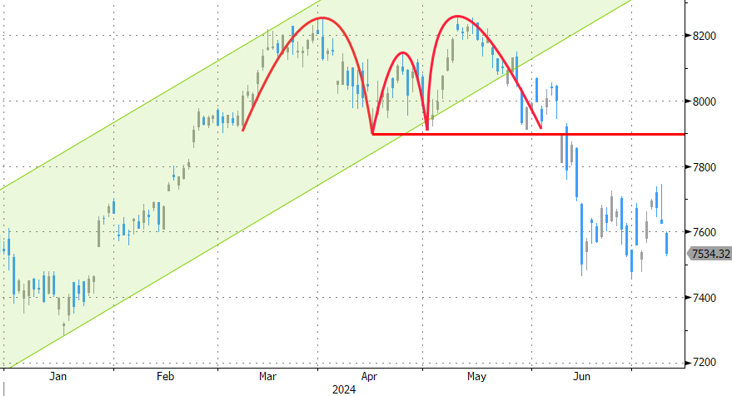
CAC 40: French stocks underperform as fiscal uncertainty lingers
DXY TW dollar: decline taking a breather as markets await more guidance from the Fed.
NZD Edges Lower Ahead of RBNZ Decision
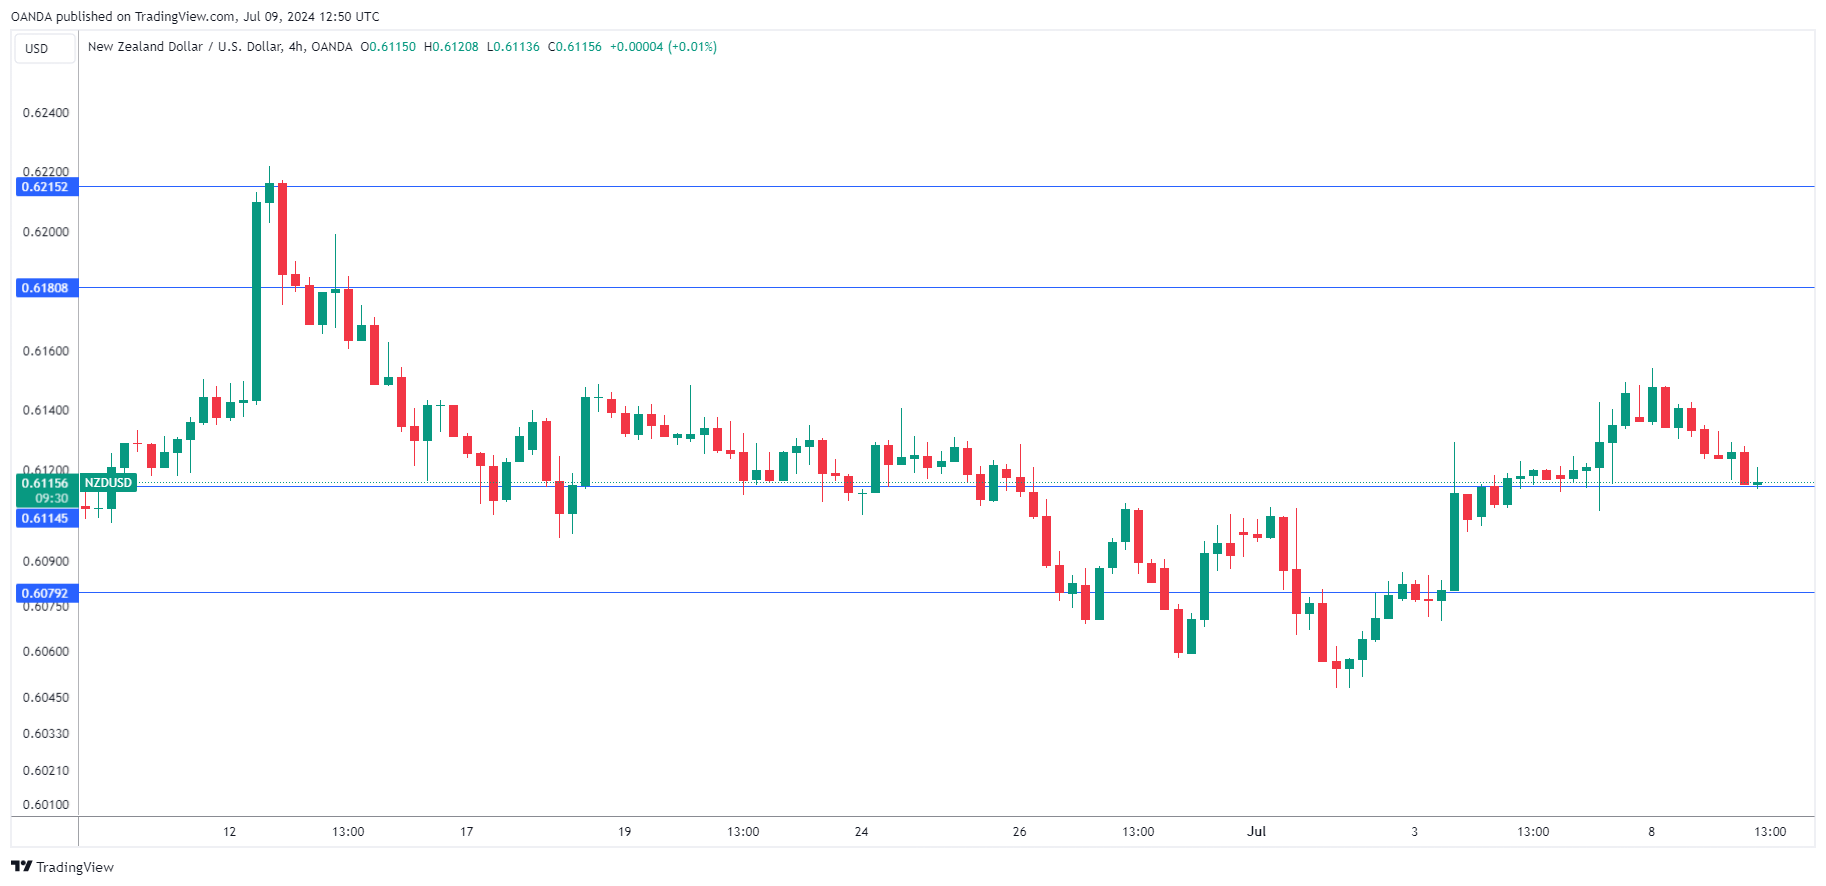
The New Zealand dollar is steady on Tuesday. NZD/USD is trading at 0.6115, down 0.16% in the European session at the time of writing. The New Zealand dollar looked sharp last week against the slumping US dollar, climbing 0.88%.
Reserve Bank expected to hold rates again
The Reserve Bank of New Zealand is expected to hold its cash rate at 5.50% for an eighth straight time when its meets early on Wednesday. The RBNZ has been unwilling to shift away from its ‘higher for longer’ stance, despite the worsening economic downturn. The services and manufacturing sectors are both showing contraction and consumer and business confidence has been weak. The economy posted annual growth of only 0.3% in the first quarter after two quarters of contraction, which is a technical recession.
The weak New Zealand economy badly needs a rate cut to kick-start growth, but the RBNZ’s first priority is to bring inflation back down to the target band of 1% to 3%, preferably around the 2% midpoint. Inflation eased from 4.7% to 4.0% in the first quarter but this is still above the target band.
What can we expect from the central bank? With a rate hold widely expected at Wednesday’s meeting, the focus will be on the tone of the rate statement. At the previous meeting in May, the RBNZ projected that it wouldn’t lower rates until the third quarter of 2025 and the economy may have worsened since then, which could delay a rate cut even further. I expect that the message from Wednesday’s meeting is that rates will not drop before the inflation picture improves and the RBNZ could warn that rate hikes remain on the table.
.
NZD/USD Technical
- NZD/USD is testing support at 0.6114. Below, there is support at 0.6079
- 0.6180 and 0.6215 are the next lines of resistance
USD/JPY Mid-Day Outlook
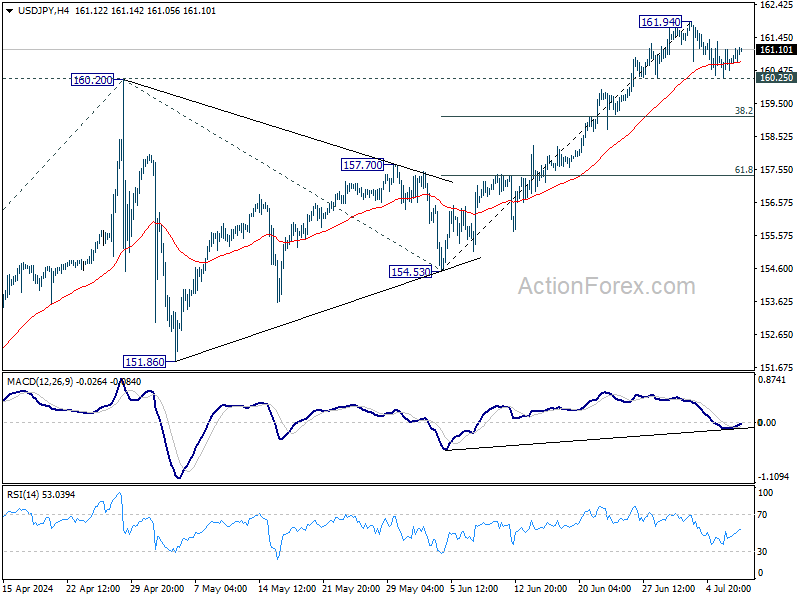
Daily Pivots: (S1) 160.28; (P) 160.84; (R1) 161.35; More...
Intraday bias in USD/JPY stays neutral at this point. Further rally is expected with 160.25 minor support intact. On the upside, break of 161.94 temporary top will resume larger up trend to 61.8% projection of 146.47 to 160.20 from 154.53 at 163.01. Nevertheless, break of 160.25 will turn bias to the downside for deeper pullback.
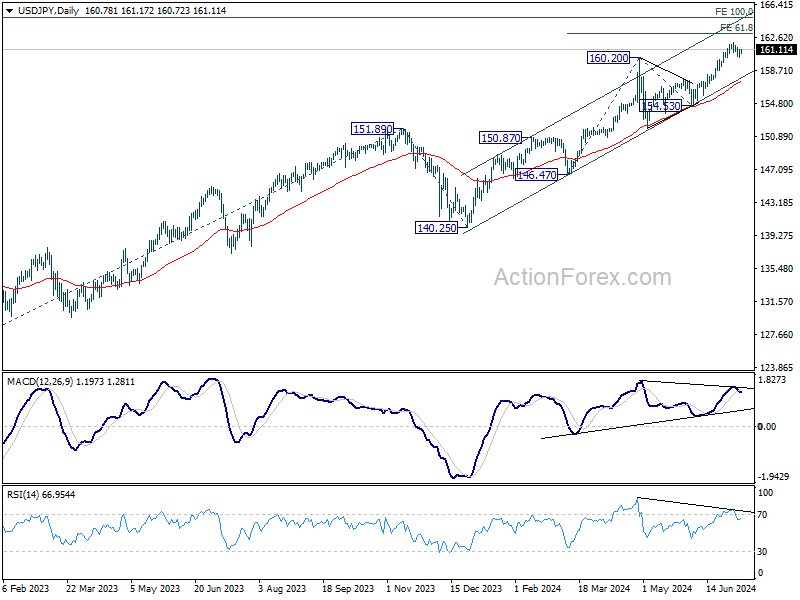
In the bigger picture, long term up trend is still in progress. Further rise is expected as long as 154.53 support holds. Next target is 100% projection of 127.20 (2023 low) to 151.89 (2023 high) from 140.25 at 164.94.
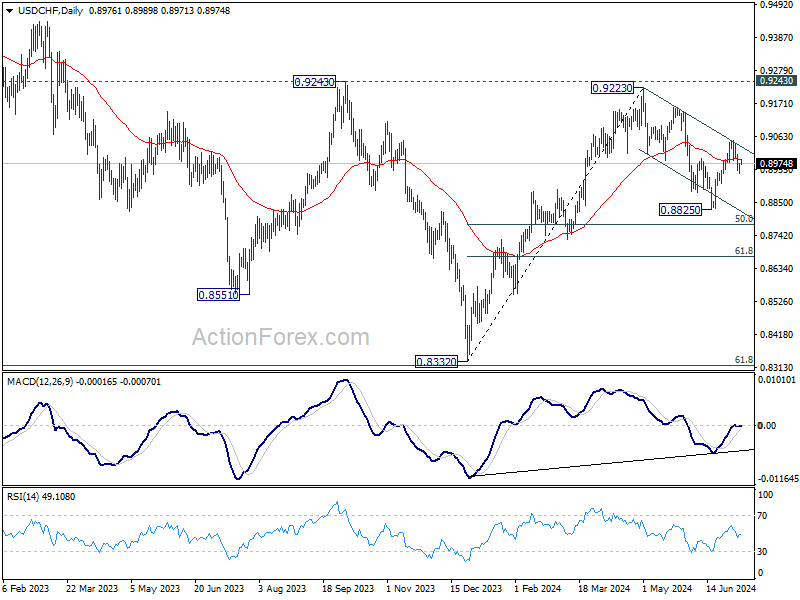
USD/CHF Mid-Day Outlook
Daily Pivots: (S1) 0.8954; (P) 0.8966; (R1) 0.8987; More…
Intraday bias in USD/CHF stays neutral for the moment. As noted before, rebound from 0.8825 could have completed at 0.9049, after rejection by falling channel resistance. Below 0.8942 will bring deeper fall to 0.8825 support. Nevertheless, break of 0.9049 will revive near term bullishness and resume the rebound from 0.8825 instead.
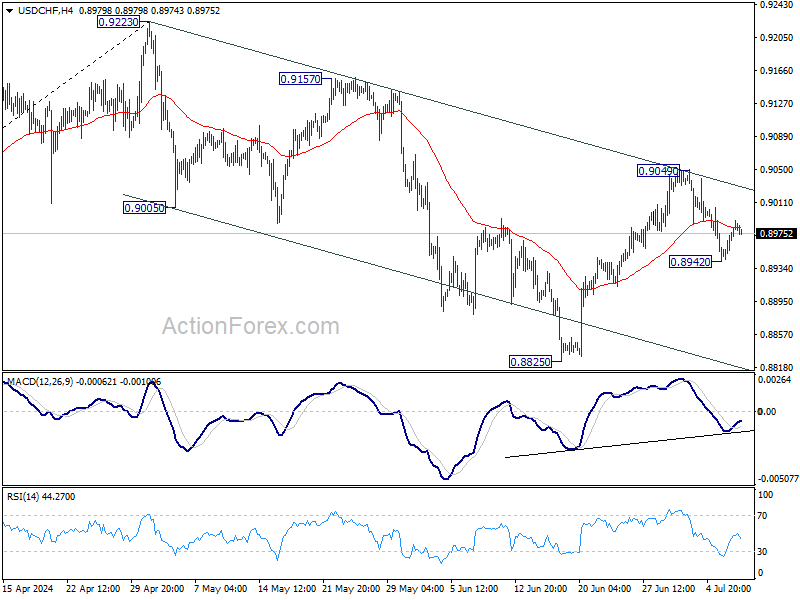
In the bigger picture, focus remains on 0.9223/9243 resistance zone. Decisive break there would suggest larger bullish trend reversal and turn outlook bullish. Nevertheless, rejection by 0.9223/43 will keep medium term outlook neutral at best, for more range trading between 0.8332/9243 first.
GBP/USD Mid-Day Outlook
Daily Pivots: (S1) 1.2785; (P) 1.2815; (R1) 1.2838; More...
Intraday bias in GBP/USD remains neutral for consolidation below 1.2845. Further rally is expected as long as 55 4H EMA (now at 1.2743) holds. Firm break of 1.2859 will resume the rally from 1.2298 and target 61.8% projection of 1.2298 to 1.2859 from 1.2612 at 1.2959. However, sustained break of 55 4H EMA will turn bias back to the downside for 1.2612 support instead.
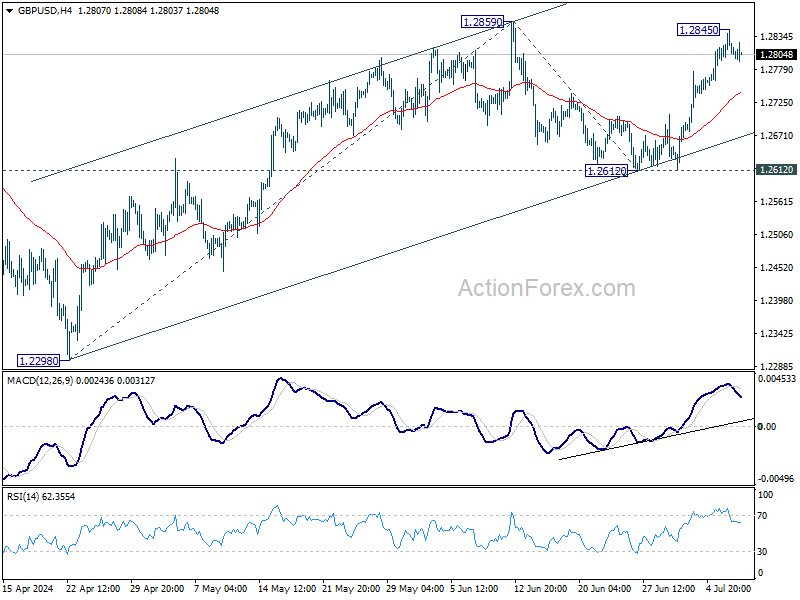
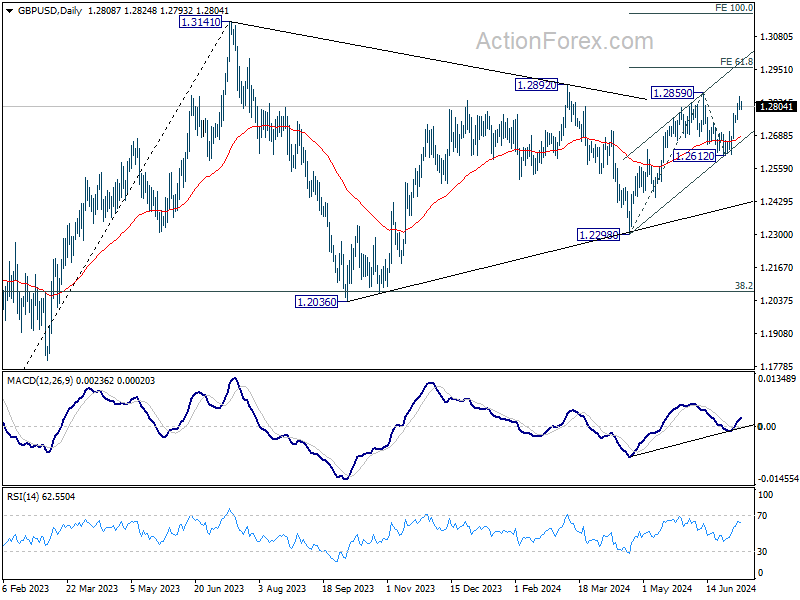
In the bigger picture, price actions from 1.3141 medium term top are seen as a corrective pattern which might still extend. Break of 1.2612 support will bring another fall to 1.2298 support and possibly below. Nevertheless, break of 1.2892 resistance will argue that larger up trend from 1.0351 might be ready to resume through 1.3141.
EUR/USD Mid-Day Outlook
Daily Pivots: (S1) 1.0802; (P) 1.0824; (R1) 1.0845; More....
Intraday bias in EUR/USD remains neutral for consolidations below 1.0844 temporary top. Further rally is in favor as long as 55 4H EMA (now at 1.0783) holds. On the upside, above 1.0844 will resume the rebound from 1.0665 to retest 1.0915 resistance. Firm break there will target 100% projection of 1.0601 to 1.0915 from 1.0665 at 1.0919 next. However, sustained break of 55 4H EMA will bring deeper fall back to 1.0665 support.
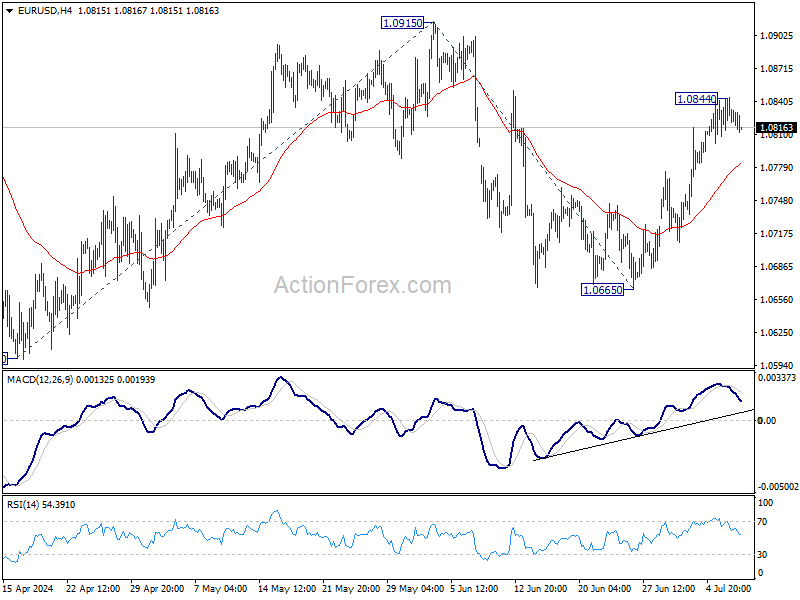
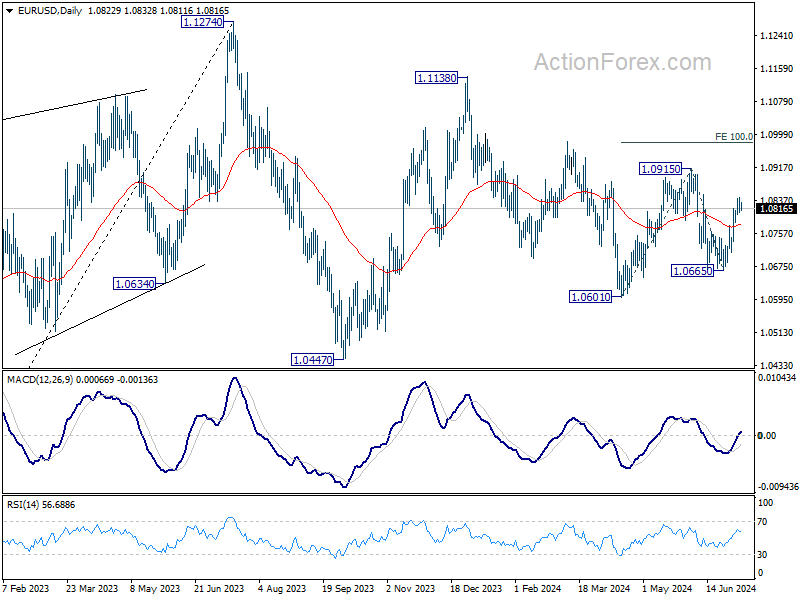
In the bigger picture, price actions from 1.1274 are viewed as a corrective pattern that's still in progress. Break of 1.0601 will target 1.0447 support and possibly below. On the upside, firm break of 1.0915 resistance will start another rising leg back to 1.1138 resistance instead.
Markets Await Fed Powell’s Insights, RBNZ on Deck
As US session kicks off, Dollar is trading mildly higher, with traders eagerly anticipating Fed Chair Jerome Powell's two-day semiannual testimony before Congress. The key questions looming over the markets are whether the Fed will initiate interest rate cuts in September and if there will be a total of one or two cuts this year. Currently, fed fund futures indicate about a 75% chance of a rate cut in September and a 73% chance of two cuts within the year.
If Powell sticks to the messaging from last Friday's Monetary Policy Report, he may acknowledge some modest progress in disinflation but could stress the need for more significant confidence before considering policy easing. He might also highlight that while labor supply has eased, it remains relatively tight, though not excessively so. That would leave market participants guessing about the Fed's next steps.
Also, it should be emphasized that the US is set to release June CPI report on Thursday. This report could either reinforce or counteract the market moves following Powell's testimony. As such, traders may want to consider securing profits early or at least tightening stops when trades are in their favor, given the potential for heightened volatility.
Overall, in the currency markets, Dollar is the strongest performer so far today, followed by Swiss Franc and British Pound. Conversely, Yen is the weakest, followed by Aussie and Kiwi. Euro and Loonie are positioned in the middle of the pack.
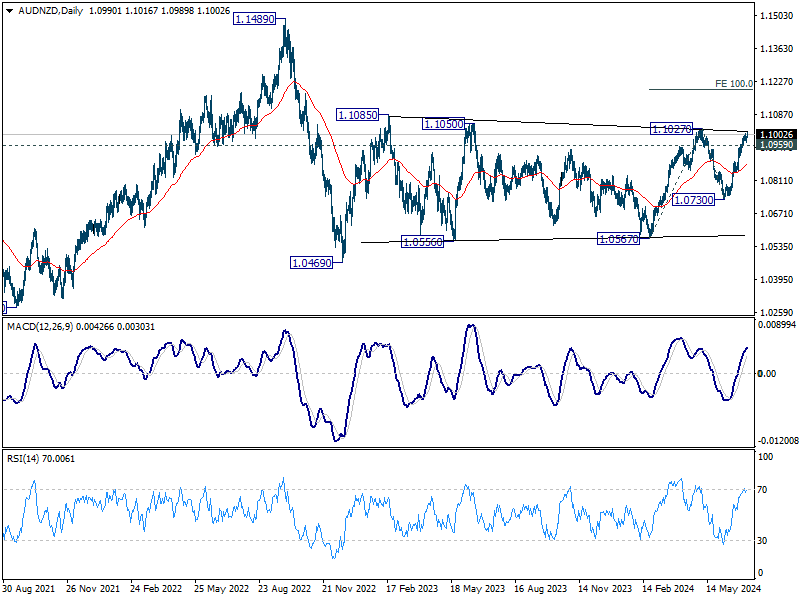
Looking ahead to Asian session, AUD/NZD pair is worth monitoring closely, as RBNZ will announce its rate decision. The OCR is expected to remain unchanged at 5.50%. The key question is whether RBNZ will hint at earlier-than-expected rate cuts, which is unlikely. Nevertheless, dovish remarks from RBNZ could boost AUD/NZD.
Technically, firm break of 1.1027 resistance in AUD/NZD would argue that whole rebound from 1.0469 is resuming through 1.1085. Next target would be 100% projection of 1.0567 to 1.1027 from 1.0730 at 1.1187. Nevertheless, break of 1.0959 will be the firm sign of rejection by 1.1027 and bring deeper pullback.
In Europe, at the time of writing, FTSE is down -0.51%. DAX is down -1.03%. CAC is down -1.29%. UK 10-year yield is up 0.0403 at 4.158. Germany 10-year yield is up 0.027 at 2.569. Earlier in Asia, Nikkei surged 1.96%. Hong Kong HSI fell -0.00%. China Shanghai SSE rose 1.26%. Singapore Strait Times rose 0.64%. Japan 10-year JGB yield fell -0.0152 to 1.076.
ECB's Panetta backs gradual rate cuts amid stabilizing inflation
ECB Governing Council member Fabio Panetta indicated today the "reduction of official rates could proceed gradually", in line with the return of inflation towards the ECB's target. Speaking to bankers in Rome, Panetta emphasized that as long as macroeconomic trends remain consistent with ECB's expectations, this gradual approach will be maintained.
Panetta downplayed concerns over persistently high service sector prices, explaining that it is typical for service prices to decline more slowly compared to goods prices. He also noted that wage growth is expected to moderate in the near future.
"Past interest rate hikes are still dampening demand, output, and inflation and will continue to do so in the months to come," Panetta remarked.
Australia Westpac consumer sentiment falls -1.1% mom, intensifying interest rate concerns
Australia's Westpac Consumer Sentiment index dropped by -1.1% mom to 82.7 in July, reflecting increased concerns about persistent inflation and fears of interest rate hikes.
The Mortgage Rate Expectations Index, which measures consumer expectations for variable mortgage rates over the next 12 months, surged by 12.8% in July, marking the steepest monthly rise since early 2022. Over the past three months, the index has climbed by 30%, from a below-average 122.8 in April to 159.2 in July, well above historical average of 143.8. This marked increase is the sharpest observed in the past seven years, with detailed responses indicating that nearly 60% of consumers expect mortgage rates to rise over the next year.
RBA will meet on August 5–6. Westpac expects the RBA to hold interest rates steady, contingent on inflation continuing to decline as anticipated. The upcoming Q2 CPI and labor market data will be critical.
Australia's NAB business confidence rebounds to 4, highest since early 2023
Australia's NAB Business Confidence rose from -2 to 4 in June, marking its highest level since early 2023 and returning to positive territory. However, Business Conditions fell from 6 to 4, indicating some ongoing challenges. Trading conditions decreased slightly from 11 to 10, profitability conditions dropped from 3 to 2, and employment conditions fell sharply from 5 to 0.
Labor cost growth slowed to 1.8% on a quarterly basis, down from 2.3% in May, while purchase cost growth eased to 1.3% from 1.7%. Overall product price growth decreased to 0.7%, down from 1.1%. Retail price growth, however, held steady at 1.5%, and recreation and personal services prices declined to 0.7% from 1.1%.
Gareth Spence, NAB Head of Australian Economics, noted, the survey signals "another soft quarter" in Q2. Capacity utilisation remains "high with demand and supply yet to fully normalise".
"Price pressures continue to ease in a trend sense though the data certainly remains bumpy," Spence added.
EUR/USD Mid-Day Outlook
Daily Pivots: (S1) 1.0802; (P) 1.0824; (R1) 1.0845; More....
Intraday bias in EUR/USD remains neutral for consolidations below 1.0844 temporary top. Further rally is in favor as long as 55 4H EMA (now at 1.0783) holds. On the upside, above 1.0844 will resume the rebound from 1.0665 to retest 1.0915 resistance. Firm break there will target 100% projection of 1.0601 to 1.0915 from 1.0665 at 1.0919 next. However, sustained break of 55 4H EMA will bring deeper fall back to 1.0665 support.
In the bigger picture, price actions from 1.1274 are viewed as a corrective pattern that's still in progress. Break of 1.0601 will target 1.0447 support and possibly below. On the upside, firm break of 1.0915 resistance will start another rising leg back to 1.1138 resistance instead.
Economic Indicators Update
| GMT | Ccy | Events | Actual | Forecast | Previous | Revised |
|---|---|---|---|---|---|---|
| 23:50 | JPY | Money Supply M2+CD Y/Y Jun | 1.50% | 2.00% | 1.90% | |
| 00:30 | AUD | Westpac Consumer Confidence Jul | 1.50% | 1.70% | ||
| 01:30 | AUD | NAB Business Conditions Jun | 4 | 6 | ||
| 01:30 | AUD | NAB Business Confidence Jun | 4 | -3 | -2 | |
| 06:00 | JPY | Machine Tool Orders Y/Y Jun P | 9.70% | 4.20% | ||
| 10:00 | USD | NFIB Business Optimism Index Jun | 91.5 | 89.5 | 90.5 |
Gold Technical: Further Drift Down in 10-year UST Real Yield Supports Bullish Narrative in Gold
- Recent rebound in WTI crude has remained below US$90/barrel which in turn led to a softening of inflationary expectations via the breakeven rates.
- A further downward drift in the 10-year US breakeven rate may a further drop in the 10-year US Treasury real yield.
- Lower opportunity costs in hold Gold (XAU/USD) support the potential start of another medium-term bullish impulsive upmove sequence above US$2,285 key support.
Since our last publication, the price actions of Gold (XAU/USD) have drifted sideways with an attempt to retest the recent 7 June intraday low of US$2,286, triggered by the release of China’s official reserves data that showed a pause on its bullion purchases in May after 18 consecutive months of gold buying in the prior months.
Gold (XAU/USD) has attempted to seek a retest on US$2,286 as it drifted lower in the week of 24 June and it printed an intraday low of US$2,293 on 26 June on a slew of cautious Fed Speak from the US central bank officials that supported a “data dependent, wait and see” approach before taking action to enact the first Fed funds rate cut after on hold for the 7th consecutive meeting on 12 June.
One of the primary reasons for a cautious stance toward monetary policy easing in the US has been the fear of entrenched inflationary expectations (that’s future consumer inflation either 1-year or 5-year from today) that tends to lead to an upside wage-price spiral.
Softer trends in inflationary expectations since April
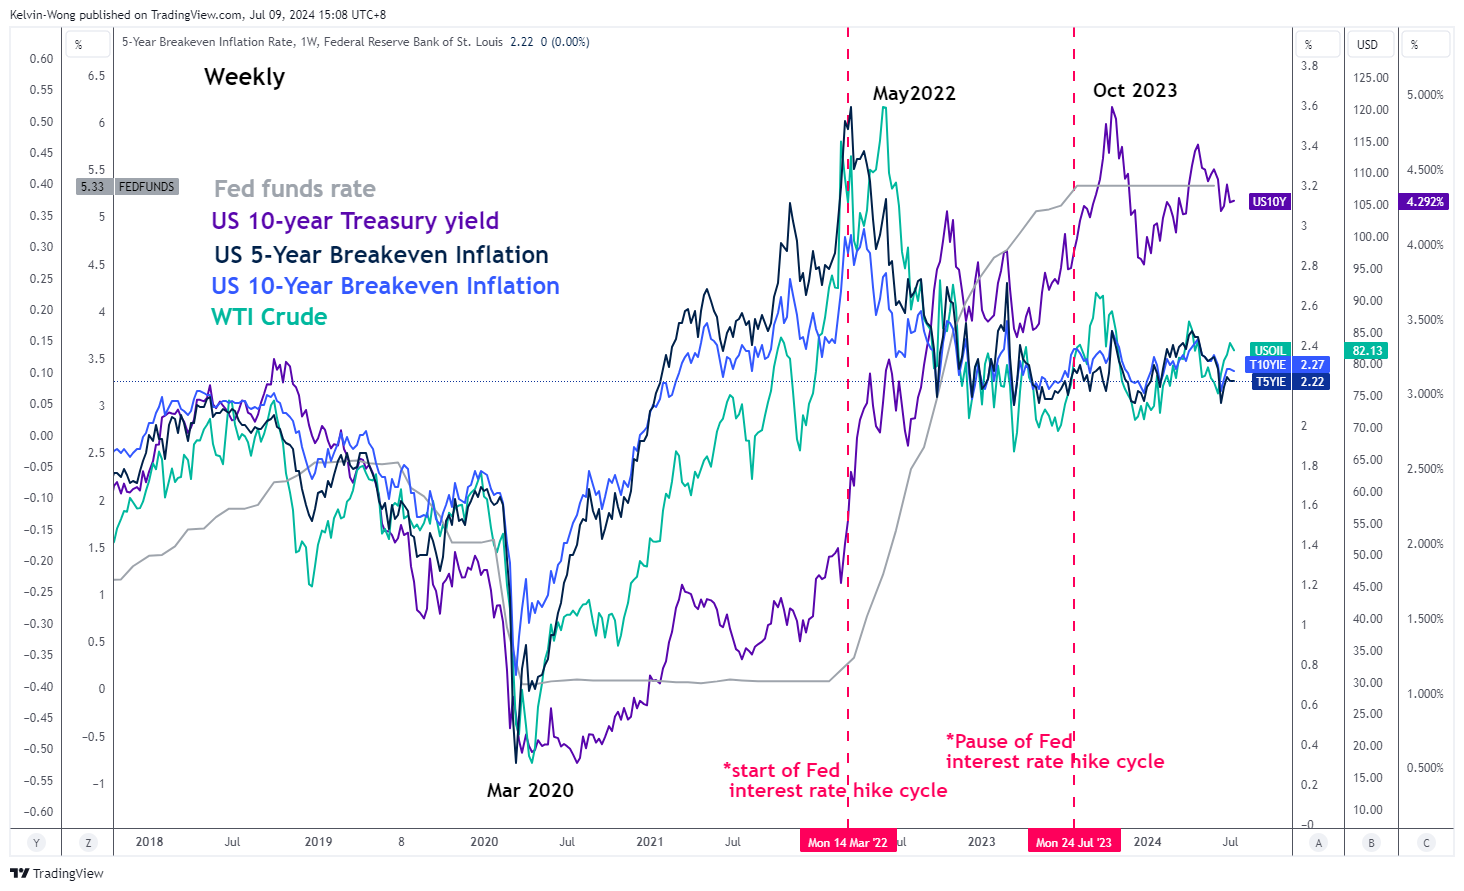
Fig 1: WTI crude & 5-YR/10-YR US breakeven rates major trends as of 9 Jul 2024 (Source: TradingView, click to enlarge chart)
We can measure inflationary expectations from either a survey-based approach or inferred from market-based transacted financial instruments such as the US Treasury Inflation-Protected Securities (TIPS) via their respective tenure breakeven rates.
Since the start of the pandemic in March 2020, the movements of the 5-year and 10-year US Treasury breakeven rates have moved in direct tandem with the prices of WTI crude oil. That’s intuitive as higher oil prices can lead to higher inflationary expectations because the cost of production and business increases since oil is considered either directly or indirectly as an input resource.
Since April 2024, the price of WTI crude has been capped at US$90 per barrel due to the recent OPEC+ decision not to extend its additional supply cuts of 2.2 million barrels per day beyond the end of September 2024 and gradually phase out these cuts over the course of a year from October 2024 to September 2025.
Hence, it has caused the 5-year and 10-year break-even rates to drift lower since April to 2.22% and 2.27% respectively at this time of the writing, which is also approaching the “desired” 2% inflation target set by the Fed as some conservative Fed officials deemed the “2% level” as a better gauge to infer that inflationary pressure has subsided which supports enacting an interest rate cut cycle (see Fig 1).
The 10-year US Treasury real yield is now at a critical juncture
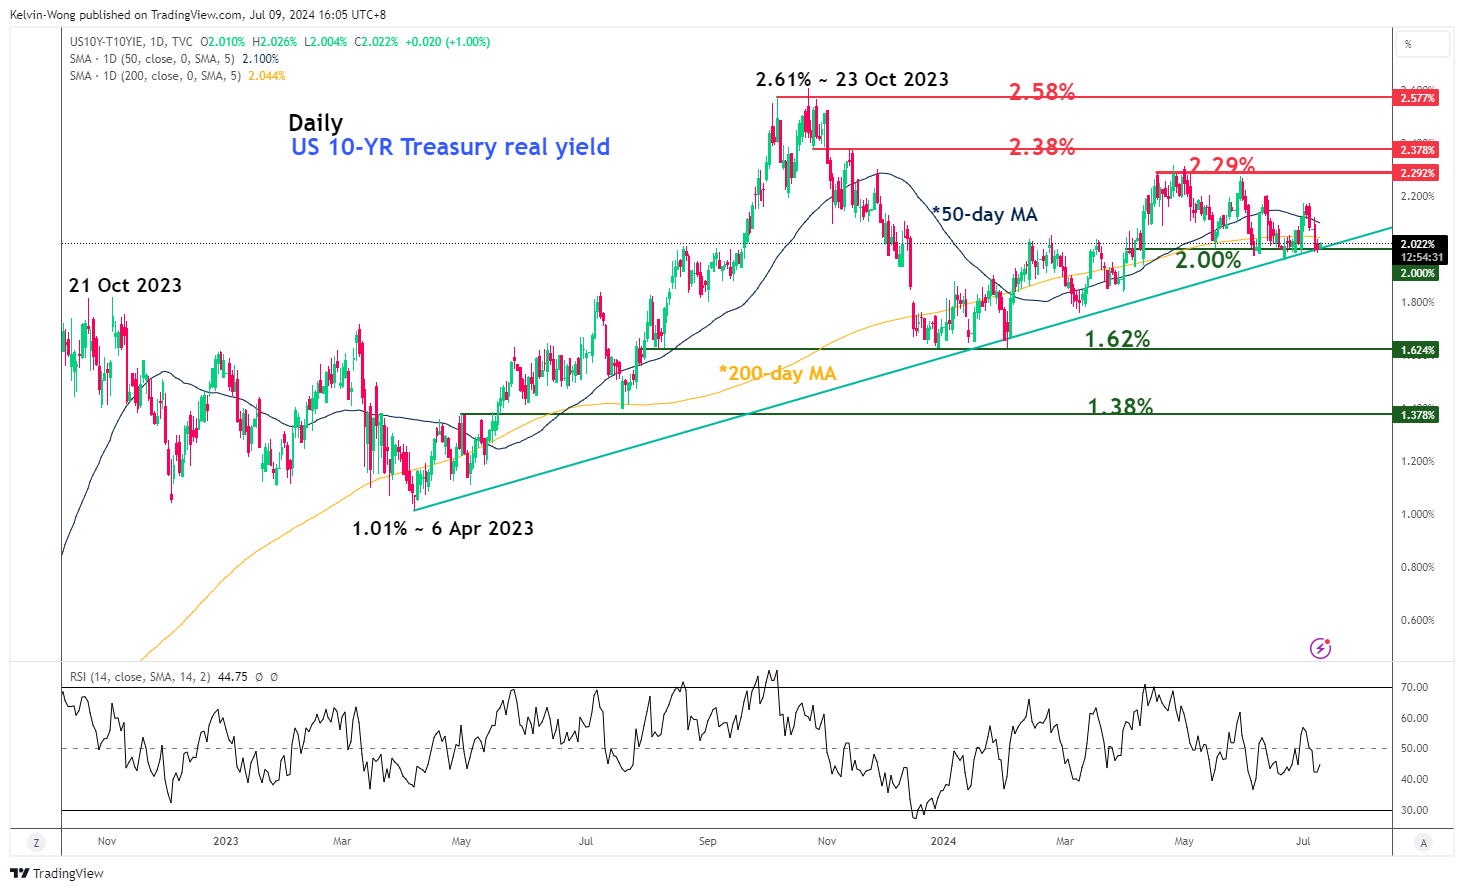
Fig 2: US 10-YR Treasury real yield major & medium-term trends as of 9 July 2024 (Source: TradingView, click to enlarge chart)
Since 26 April 2026, the 10-year US Treasury real yield has drifted lower from 2.61% to 2.02% at this time of the writing due to the softening of the 10-year breakeven rate mentioned earlier.
A break below its major support of 2% (also the major ascending trendline from the 6 April 2023 low that held prior decline in price actions) may trigger a more significant potential corrective decline sequence to expose the next medium-term support of 1.62% in the first step (see Fig 2).
A prospect of a lower 10-year US Treasury real yield in the medium-term looks to be gaining traction which in turn implies a lower opportunity cost of holding Gold (XAU/USD) as it is a non-interest or fixed-income bearing asset.
Bulls recaptured the 20-day and 50-day moving averages
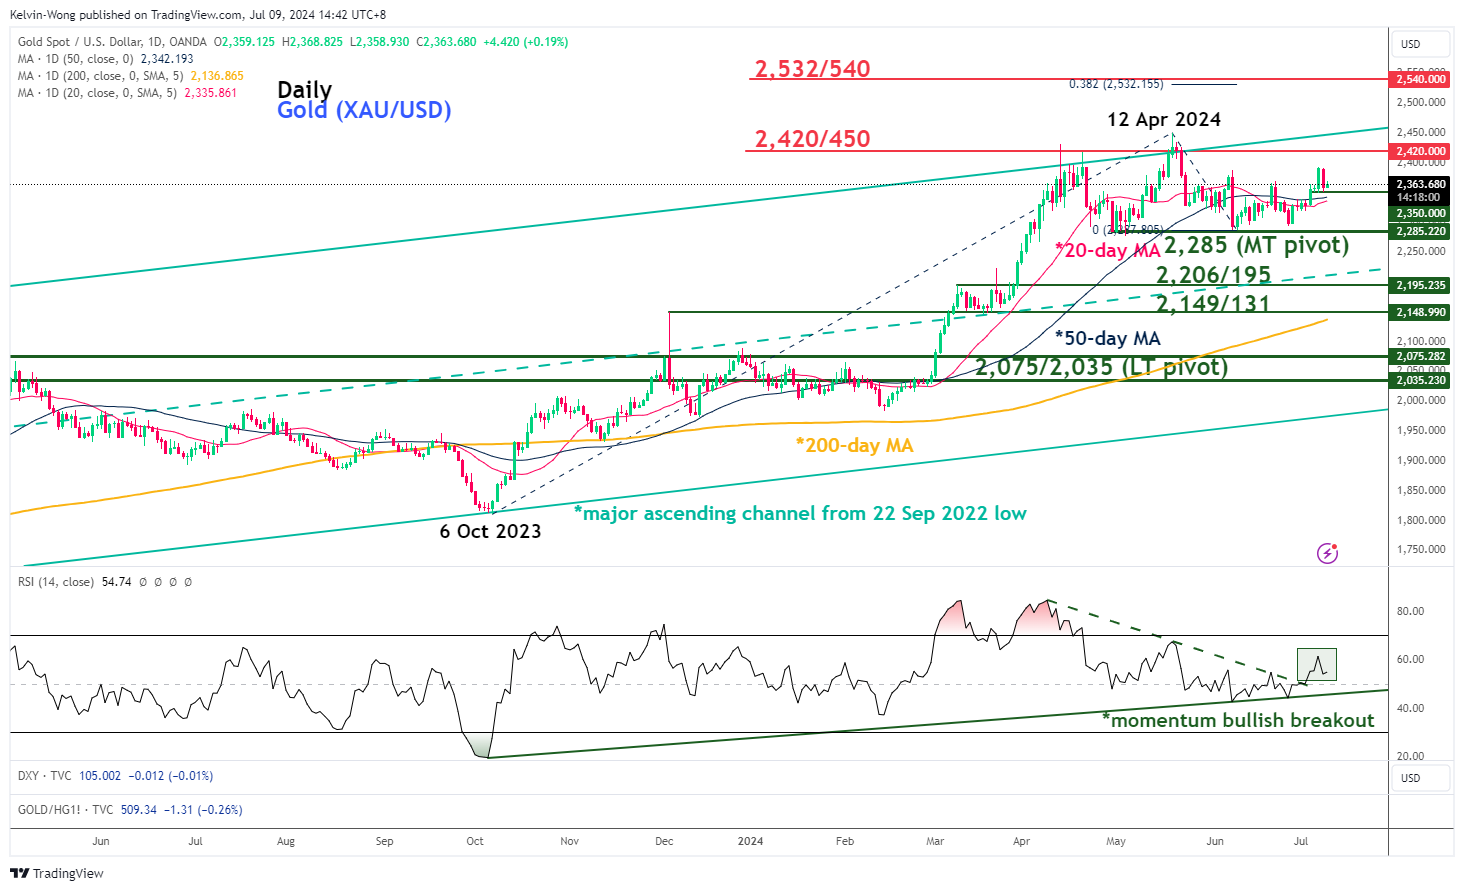
Fig 3: Gold (XAU/USD) major & medium-term trends as of 9 July 2024 (Source: TradingView, click to enlarge chart)
Since last Wednesday, 3 July, the price actions of Gold (XAU/USD) have broken above both its 20-day and 50-day moving averages.
In addition, the daily RSI momentum indicator has also staged a parallel bullish breakout above its 50 level which suggests a potential revival of medium-term bullish momentum that in turn supportive of a possible start of a new bullish impulsive upmove sequence for Gold (XAU/USD).
If the US$2,285 key medium-term pivotal support holds, Gold (XAU/USD) may see a retest on its current April all-time high area that is considered as the first medium-term resistance zone of US$2,420/450, and a break above it sees the next medium-term resistance zone coming in at US$2,532/540 (see Fig 3).
However, failure to hold at US$2,285 invalidates the bullish tone for a continuation of the correct decline sequence within its major uptrend phase to expose the next medium-term supports at US$2,206/195 and US$2,149/131.