Sample Category Title
Elliott Wave Intraday Analysis on Silver (XAGUSD) Looking for Dips to Find Support
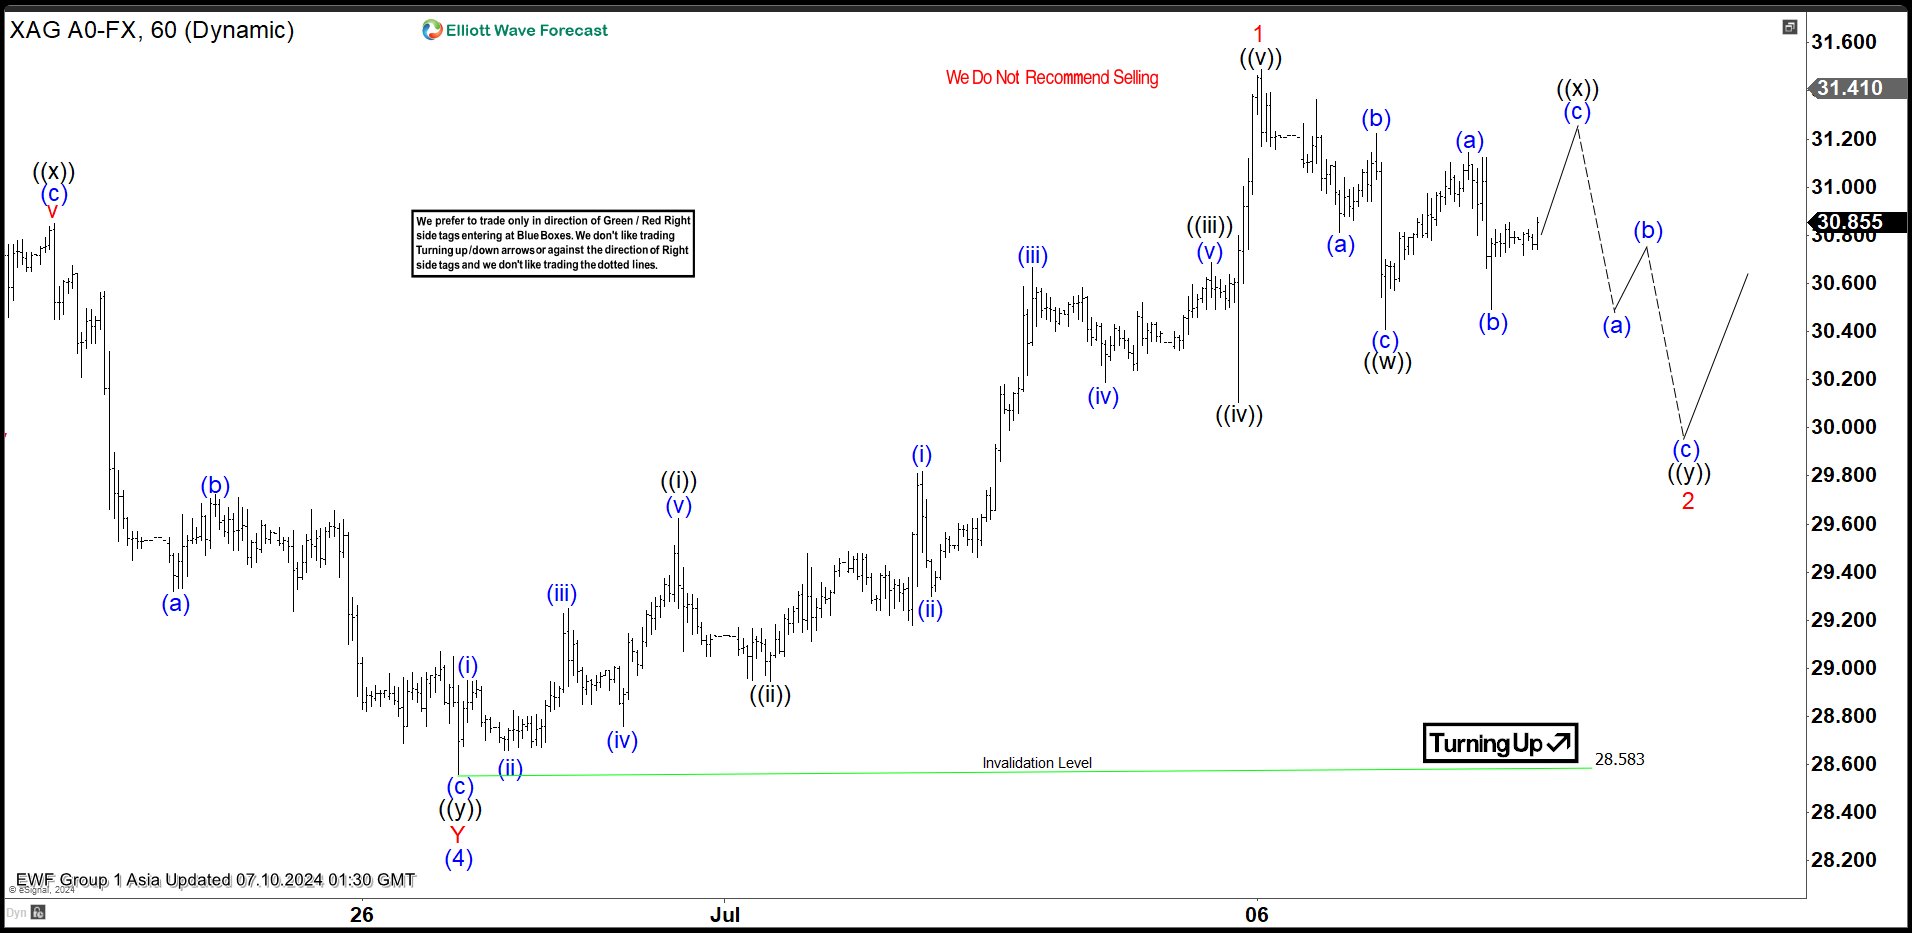
Short Term Elliott Wave View in Silver (XAGUSD) suggests that pullback to 28.58 ended wave (4). The metal has turned higher again in wave (5) as the 1 hour chart below shows. It still needs to break above the previous wave (3) peak at 32.51 to rule out a larger double correction. Up from wave (4), wave (i) ended at 28.95 and wave (ii) ended at 28.66. Wave (iii) higher ended at 29.25, and pullback in wave (iv) ended at 28.76. Wave (v) ended at 29.62 which completed wave ((i)). Pullback in wave ((ii)) ended at 28.94. The metal has resumed higher in wave ((iii)). Up from wave ((ii)), wave (i) ended at 29.81 and pullback in wave (ii) ended at 29.3.
Wave (iii) higher ended at 30.66 and pullback in wave (iv) ended at 30.19. Final wave (v) higher ended at 30.69 which completed wave ((iii)). Pullback in wave ((iv)) ended at 30.1 and the metal has resumed higher in wave ((v)) towards 31.49 which completed wave 1 in higher degree. Wave 2 pullback is now in progress to correct cycle from 6.26.2024 low. The internal subdivision of the pullback is in the form of 7 swing double three Elliott Wave structure. Down from wave 1, wave ((w)) ended at 30.4 as a zigzag. Wave ((x)) bounce is in progress, after which another leg lower in wave ((y)) should happen in 3 waves to complete wave 2. Near term, as far as pivot at 28.58 low stays intact, expect pullback to find support in 3, 7, 11 swing for further upside.
Silver (XAGUSD) 60 Minutes Elliott Wave Chart
Silver (XAGUSD) Elliott Wave ChartXAGUSD Elliott Wave Video
https://www.youtube.com/watch?v=nTNMn4v_Woc
RBNZ Review: Keeping It Tight… For a While
- The RBNZ left the OCR at 5.5% as expected.
- The RBNZ took a more dovish view – easing looks to be coming earlier than they previously thought.
- The short-term inflation outlook seems more comfortable for the RBNZ.
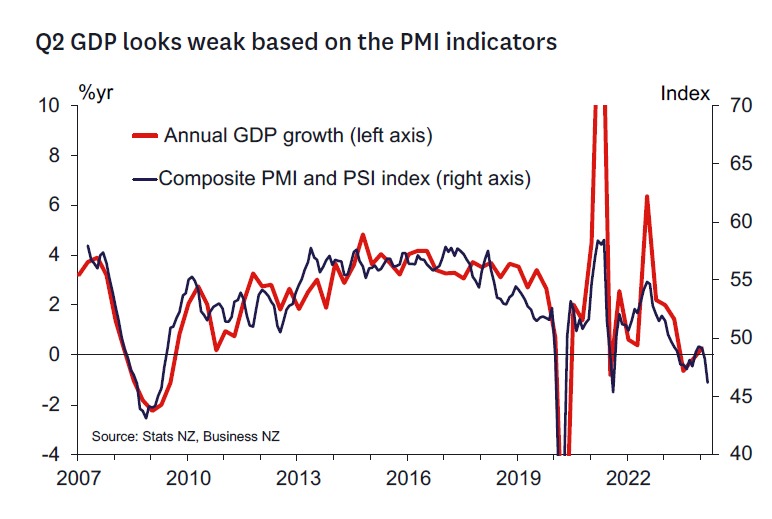
- But it's the weaker growth momentum that seems especially top of mind.
- The RBNZ's monetary policy strategy is shifting towards preparing for a reduction in restrictiveness. The RBNZ is "keeping it tight" but looks forward to easing earlier.
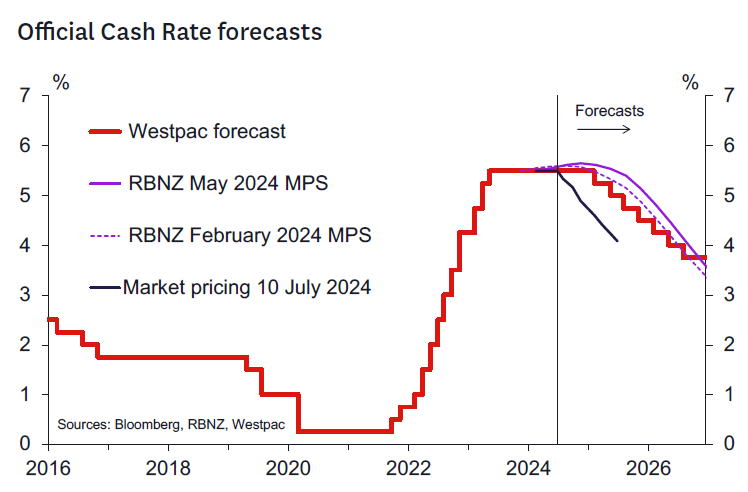
- We see this as consistent with our forecast of an initial easing in February 2025 with some chance of a November easing.
The RBNZ left the OCR unchanged at 5.5% as expected but took a more dovish tone on the outlook.
As we discussed in our Monetary Policy Review preview note, a key area of interest was the RBNZ's updated assessment of the forward growth situation given recent weaker economic indicators that have seen markets price in a significant chance of interest rate cuts in 2024.
The RBNZ's commentary indeed reflected concerns that the forward growth profile looks weaker than before. In particular, the record of the meeting noted that:
"…recent higher frequency indicators suggest that nearterm growth in business activity has weakened. A range of business and consumer surveys, and higher frequency spending and credit data, all point to declining activity."
This contrasts with the May Statement, in which the RBNZ forecast low but positive GDP growth over each quarter of this year. This suggests that the RBNZ will revise down its GDP growth forecasts in the August Statement, and with that project a more negative output gap and so weaker domestic inflation pressures. The record also noted that:
"….recent survey measures of hiring intentions and job vacancies indicate flat employment levels."
Fiscal policy.
Regarding fiscal policy, the record of meeting suggests less concern about Budget 2024 than we had expected, especially considering the comments made in the May Statement. The RBNZ noted that lower government spending has already been contributing to weaker demand and it expects that this will continue over the period. It was noted that the positive impact of impending tax cuts on private spending is yet to occur. However, at this stage the RBNZ regards the magnitude of that impact "more uncertain". We think that part of that uncertainty likely stems from uncertainty regarding the near-term direction of the economy, with current levels of consumer pessimism likely to dampen some consumers' willingness to spend these cuts.
Inflation.
The RBNZ also sounds more confident about the outlook for inflation, noting that it is expected to return within the target range "…in the second half of the year." Previously, the RBNZ noted that this was expected to occur "…by the end of 2024."
The RBNZ's rhetoric around medium term inflation risks has been dialled back. The RBNZ notes that:
"Domestic inflation measures remain more persistent, but growing excess capacity in the domestic economy provides greater certainty that they will sustainably decline."
They also seem to have taken some comfort from recent business surveys which have shown an easing in both cost pressures and the number of businesses who have been raising their prices.
Monetary policy strategy.
We didn't think the RBNZ would have any significant change in message to communicate and wouldn't be keen to endorse recent dovish market pricing suggesting meaningful chances of OCR cuts by the end of 2024. This was wrong.
While the RBNZ's commentary was very short, the tone of the commentary suggests a change in strategy is coming. The title of the statement "Inflation approaching target range" and the final sentences:
"The Committee agreed that monetary policy will need to remain restrictive. The extent of this restraint will be tempered over time consistent with the expected decline in inflation pressures."
are revealing in that the RBNZ is moving towards dialling back restriction as inflation falls closer to target. This tells us that the May Statement interest rate track is now stale and that current projections are consistent with an earlier start to easing. To some extent this follows the prevailing trend among developed market central banks to start dialling back restriction once the inflation target range nears. It also reflects the weaker economic data of late and it may also reflect the sense that once inflation is inside the target range the RBNZ can and perhaps will be more relaxed.
This is comforting given the RBNZ's previous forecast start to the easing cycle was 6 months beyond most domestic forecasters (including our own February 2025 call). The question is the implied extent of the shift in strategy. Our sense is that the "feasible set" for initial RBNZ easing lies in the November 2024 to February 2025 range now.
The extent of the shift in view will come at the August Statement and with the benefit of the Q2 CPI and labour market reports due in coming weeks. Should the CPI report in particular print noticeably below the RBNZ's 0.6% published forecast (we suspect their internal forecast is lower than this now) then this could open up a shift to a November easing forecast – although we still think this is a stretch.
Key will be their confidence on the medium-term inflation outlook as opposed to the proximity of the 1-3% target range "The extent of this restraint will be tempered over time consistent with the expected decline in inflation pressures" (our emphasis added).
The RBNZ is setting markets up to price an earlier easing start dependent on the inflation data to come. They are clearly not yet there – or easing would have started – but they no longer are discussing tightening. The RBNZ also are discussing the beginning of a measured rate cut cycle – presumably in line with the evolution of inflation outcomes. We don't think this is the beginning of the GFC style swift and severe OCR reduction campaign (unless the economy and inflation take a step down commensurate to the much weaker scenario seen in over 2008/09).
Our OCR view.
We retain our call for first cut to the OCR to 5.25% in February 2025. It's comforting to see the RBNZ move back towards us but it's not clear they have vaulted us at this point. The RBNZ may have moved back to where they were in February this year where our views were closely aligned. We will be watching the inflation data most carefully to see if it is able to provide the confidence that an earlier move down in the OCR is more likely. The non-tradable inflation components will be top of mind in that regard.
Data to watch.
Key data to watch between now and the August Statement include:
- The June quarter CPI (17 July) where the level of core inflation will be especially key (headline CPI forecasts: RBNZ May 0.6% q/q, WBC 0.6% q/q, non-tradables CPI forecasts: RBNZ February 0.8% q/q, WBC 0.8% q/q).
- The June quarter labour market reports (7 August) where further signs of labour market loosening will be sought (unemployment rate forecasts: RBNZ May 4.6%, WBC 4.6%, private sector LCI wages forecasts: RBNZ May 0.9% q/q, WBC 0.8% q/q).
Market reaction.
Markets have reacted significantly to today's significant change in tone from the RBNZ. At the time of writing, markets are pricing around a 60% chance of a 25bp easing at the August MPS meeting and have more than fully priced a 25bp easing by the time of the October OCR review.
China’s CPI slows to 0.2% in Jun, PPI negative for 21st month
China's CPI slowed to 0.2% yoy in June, down from 0.3% yoy in May, missing expectations of a 0.4% yoy increase. Core CPI, which excludes volatile food and energy prices, rose by 0.6% yoy, unchanged from May, but slightly slower than the 0.7% increase observed in the first half of the year.
On a month-on-month basis, inflation remained negative in June, with CPI falling by -0.2%, following a -0.1% decrease in May. This continued negative trend reflects ongoing deflationary pressures in the economy.
PPI fell by -0.8% yoy, improving from the prior month's -1.4% yoy decline and matching market expectations. Despite the slight improvement, PPI has remained negative for the 21st consecutive month, indicating persistent weakness in industrial prices.
Bitcoin Strives for Recovery: Will It Overcome Major Roadblocks?
Key Highlights
- Bitcoin price crashed below the $60,000 and $58,500 support levels.
- BTC is trading below a key bearish trend line with resistance at $60,500 on the 4-hour chart.
- Ethereum tested the $2,850 support before there was an upside correction.
- Gold prices started a downside correction from the $2,392 level.
Bitcoin Price Technical Analysis
Bitcoin price failed to clear the $63,500 resistance zone and started a fresh decline. BTC/USD traded below many supports such as $60,000 and $58,500.
Looking at the 4-hour chart, the price settled well below the $60,000 zone, the 100 simple moving average (red, 4 hours), and the 200 simple moving average (green, 4 hours). The bears even dragged the price below the $56,500 support zone.
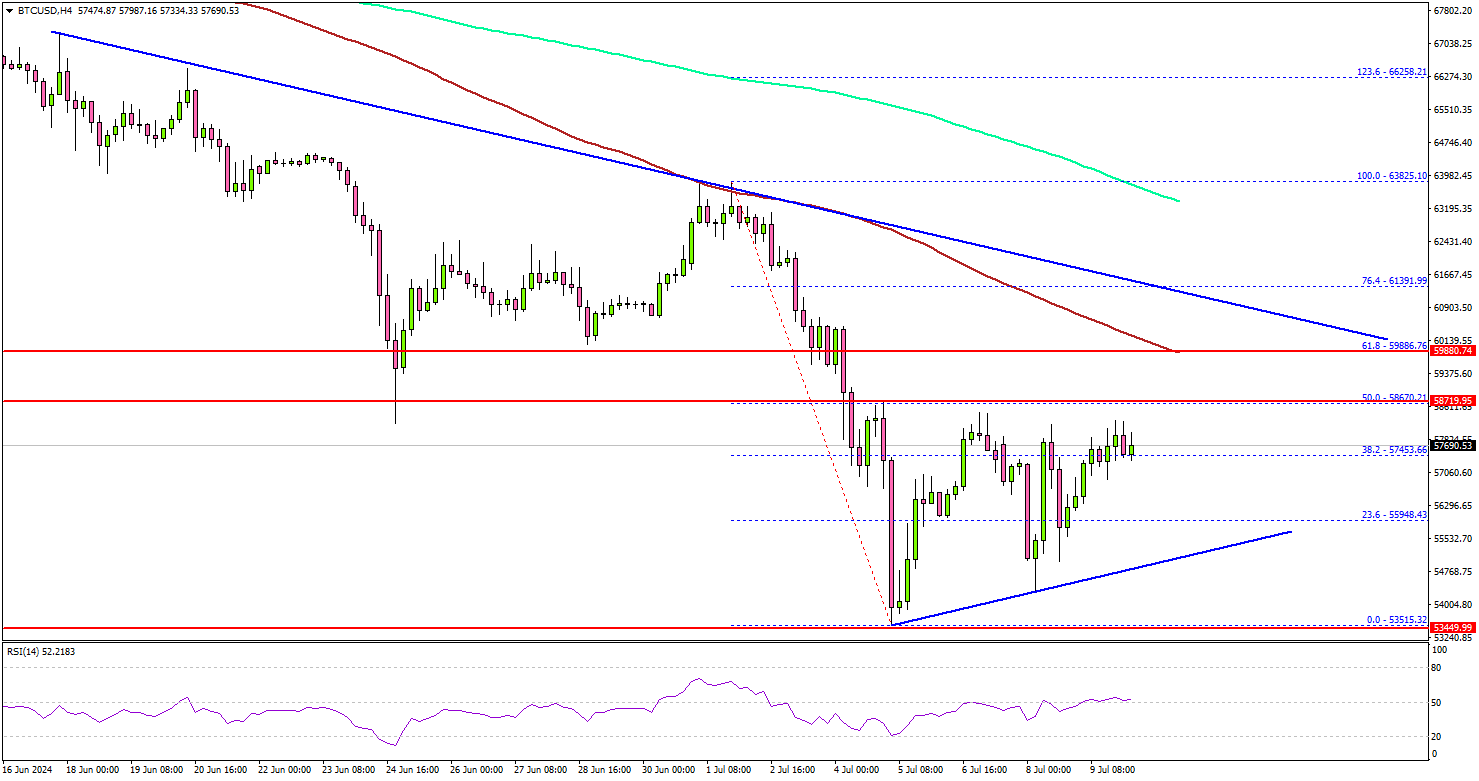
Finally, the price found support near the $53,500 level and is currently attempting to recover. The price climbed above the 38.2% Fib retracement level of the downward move from the $63,825 swing high to the $53,515 low.
On the upside, the price could face resistance near the $58,650 level and the 50% Fib retracement level of the downward move from the $63,825 swing high to the $53,515 low.
The first key resistance is near the $60,000 zone. There is also a major bearish trend line forming with resistance at $60,500 and the 100 simple moving average (red, 4 hours) on the 4-hour chart. A successful close above $60,500 might start another steady increase. In the stated case, the price may perhaps rise toward the $63,500 level.
Conversely, Bitcoin might extend losses. Immediate support is near the $56,000 level. The main support sits at $53,500. Any more losses might send the price toward the $50,000 support zone.
Today’s Economic Releases
- Federal Reserve Chair Jerome Powell testifies before Congress.
- US Monthly Budget Statement for Jun 2024.
AUD/NZD soars after RBNZ, more upside if policy diverges with RBA
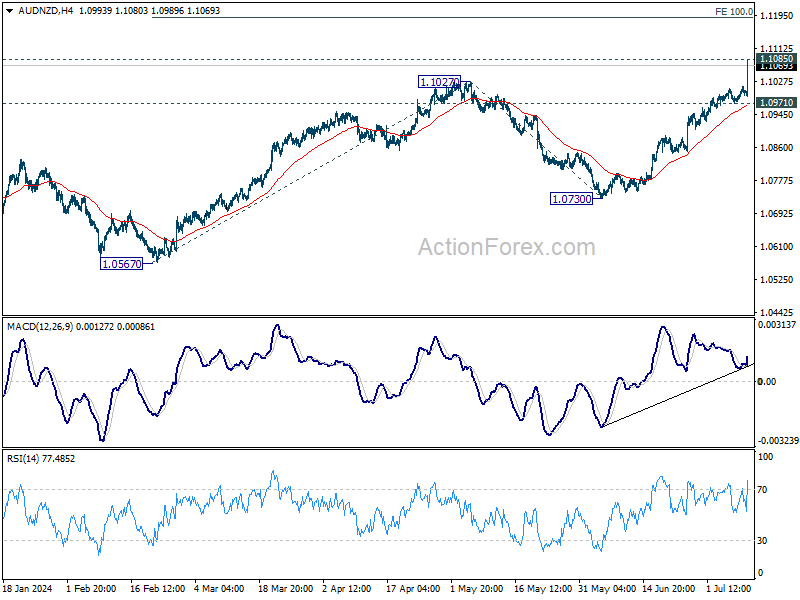
AUD/NZD soars sharply higher after RBNZ softened its hawkish stance, incorporating language in its latest statement that suggests a shift towards monetary easing. This change has created prospects for stronger rally in the cross, driven by policy divergence between RBNZ and RBA.
In particular, if RBNZ moves to cut interest rates sooner than previously projected, while RBA raises rates in response to strong Q2 Australian inflation data, AUD/NZD could see even more significant gains in the medium term.
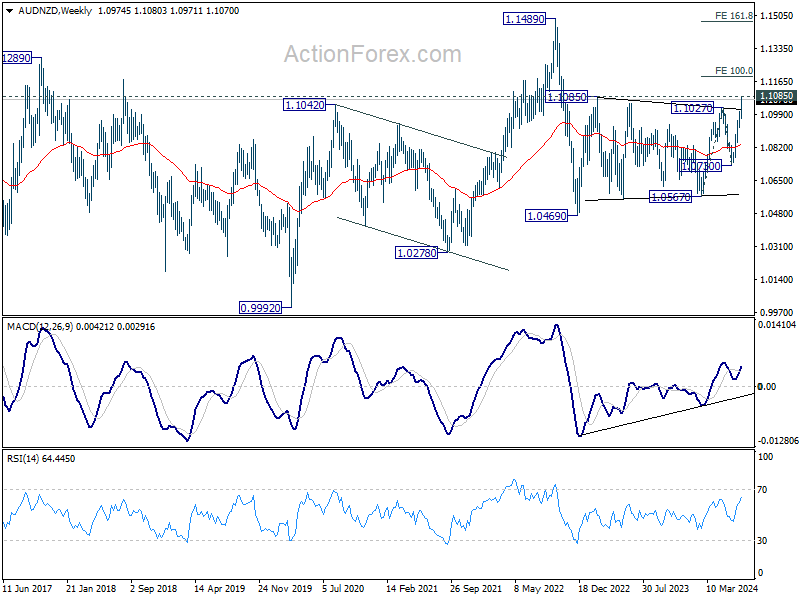
Technically, immediate focus is now on 1.1085 key medium term resistance (2023 high). Firm break there will confirm whole rebound from 1.0469 (2022 low). Next target will be 100% projection of 1.0567 to 1.1027 from 1.0730 at 1.1190.
Strong break of 1.1190 would bring upside acceleration to 161.8% projection at 1.1474 in the medium term. In any case, near term outlook will stay bullish as long as 1.0971 support holds for now.
RBNZ holds rates at 5.50%, softens hawkish tone
RBNZ left OCR unchanged at 5.50%, as widely expected. The central bank softened its hawkish stance in the accompanying statement, indicating that the extent of monetary restriction "will be tempered over time consistent with the expected decline in inflation pressures." Markets interpreted this as a signal that RBNZ is moving closer to lowering interest rates.
RBNZ also acknowledged that its restrictive monetary policy has "significantly reduced consumer price inflation," with headline inflation expected to return to the 1-3% target band "in the second half of this year." This decline in inflation reflects both receding domestic pricing pressures and lower inflation for imported goods and services. Additionally, labor market pressures have eased.
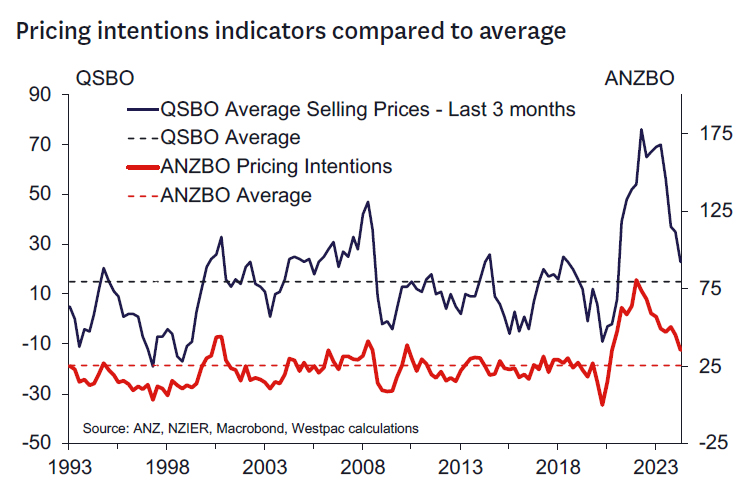
While domestically generated price pressures "remain strong," RBNZ said there are signs that "inflation persistence will ease in line with the fall in capacity pressures and business pricing intentions."
(RBNZ) OCR 5.50% – Inflation Approaching Target Range
Restrictive monetary policy has significantly reduced consumer price inflation, with the Committee expecting headline inflation to return to within the 1 to 3 percent target range in the second half of this year.
The decline in inflation reflects receding domestic pricing pressures, as well as lower inflation for goods and services imported into New Zealand. Labour market pressures have eased, reflecting cautious hiring decisions by firms and an increased supply of labour. The level of economic activity, including business and consumer investment spending and investment intentions, is consistent with the restrictive monetary stance.
Current and expected government spending will restrain overall spending in the economy. However, the positive impact of the pending tax cuts on private spending is less certain.
Some domestically generated price pressures remain strong. But there are signs inflation persistence will ease in line with the fall in capacity pressures and business pricing intentions.
The Committee agreed that monetary policy will need to remain restrictive. The extent of this restraint will be tempered over time consistent with the expected decline in inflation pressures.
Media contact
James Weir
Senior Adviser External Stakeholders
Phone: +64 4 471 3962 | Mobile: 021 103 1622
Email: James.Weir@rbnz.govt.nz
Summary Record of Meeting
The Monetary Policy Committee discussed recent developments in the domestic and global economies and the implications for monetary policy in New Zealand.
Global economic growth remains below trend and is expected to pick up only gradually over the next year. The economic outlook varies among New Zealand's trading partners, with economic growth in the United States remaining stronger than in many other advanced economies. Meanwhile, economic growth in China is forecast to be subdued relative to recent norms.
Global consumer price inflation has been trending down. This has given some central banks the confidence to either start, or to signal, a gradual reduction in policy interest rates. Nevertheless, monetary policy remains at restrictive levels in most advanced economies, and the recent stalling in global disinflation has tempered market expectations of the speed of official rate reductions.
The Committee noted that global equity prices continue to reflect expectations of a smooth disinflation process. Members discussed risks to this 'smooth landing' scenario, noting market pricing of risk could increase materially if these expectations are not met.
The Committee agreed that New Zealand's restrictive monetary policy is reducing domestic demand and consumer price inflation. The Committee is confident that inflation will return to within its 1-3 percent target range over the second half of 2024.
Members agreed that there is now more evidence of excess productive capacity emerging, with measures of capacity utilisation and difficulty finding labour easing materially. The Committee noted that recent higher frequency indicators suggest that near-term growth in business activity has weakened. A range of business and consumer surveys, and higher frequency spending and credit data, all point to declining activity. Members discussed the risk that this may indicate that tight monetary policy is feeding through to domestic demand more strongly than expected.
The Committee discussed signs of easing in the labour market. Recent survey measures of hiring intentions and job vacancies indicate flat employment levels. Net migration has also fallen in recent months to levels consistent with the pre-COVID period.
Members discussed recent changes to financial conditions in New Zealand. Non-performing bank loans and corporate insolvencies have increased from low levels in line with declining economic activity. These metrics are slow moving, and hence measures of financial stress are expected to keep rising. Bank credit growth also remains very subdued, in line with weakness in the domestic economy and low business and consumer confidence. Bank funding costs are expected to remain elevated as funding sources revert to higher cost wholesale and deposit funding. Elevated funding costs in turn are expected to underpin lending rates over the medium term.
The Committee discussed the impact of fiscal policy as announced in the Government's Budget 2024. Government expenditure is forecast to decline as a share of the economy in coming years. Members noted timing differences between the impact of lower government spending and tax policy changes. Lower government spending has already been contributing to weaker demand and will continue to do so. However, the positive impact of tax cuts on private spending is yet to occur and is more uncertain.
Members discussed progress towards achieving their inflation objective. Recent monthly Selected Price Indexes suggest weakening in some of the more volatile inflation components, while survey measures of cost pressures and pricing intentions have continued to decline. Headline inflation is expected to return to within the 1 to 3 percent target range in the second half of this year. Domestic inflation measures remain more persistent, but growing excess capacity in the domestic economy provides greater certainty that they will sustainably decline.
The Committee discussed the balance of risks to the inflation outlook. Members noted a risk that domestically driven inflation could be more persistent in the near term. However, there is also a risk that price setting behaviour and inflation expectations could normalise more rapidly as headline inflation declines.
Members discussed risks to the economic outlook stemming from Government policy. They discussed the challenge of delivering fiscal consolidation. In addition, some members noted that Government regulatory reforms may affect pricing behaviour in several sectors and the productive capacity of the economy. The net impact of these policies remains uncertain.
The appropriate stance of monetary policy was discussed. The Committee agreed that monetary policy will need to remain restrictive. The extent of this restraint will be tempered over time consistent with the expected decline in inflation pressures.
On Wednesday 10 July, the Committee reached a consensus to maintain the Official Cash Rate at 5.50 percent.
Attendees
MPC members: Adrian Orr (Chair), Bob Buckle, Carl Hansen, Christian Hawkesby, Karen Silk, Prasanna Gai.
Treasury Observer: Tim Ng.
MPC Secretary: Chris Bloor.
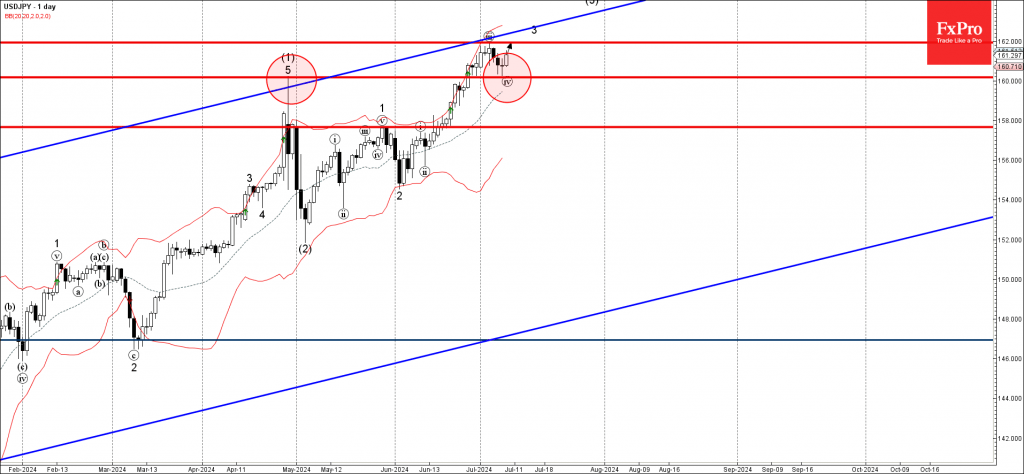
USDJPY Wave Analysis
- USDJPY reversed from the key support level 160.00
- Likely to rise to the resistance level 162.00
USDJPY currency pair recently reversed up from the key support level 160.00 (former resistance from April, which stopped the previous impulse wave (1)).
The upward reversal from the support level 160.00 started the active minor impulse wave v, which belongs to the impulse wave 3 from the start of June.
Given the predominant daily uptrend and the bullish USD sentiment, USDJPY currency pair can be expected to rise further to the next resistance level 162.00 (which stopped the previous impulse wave iii at the start of July).
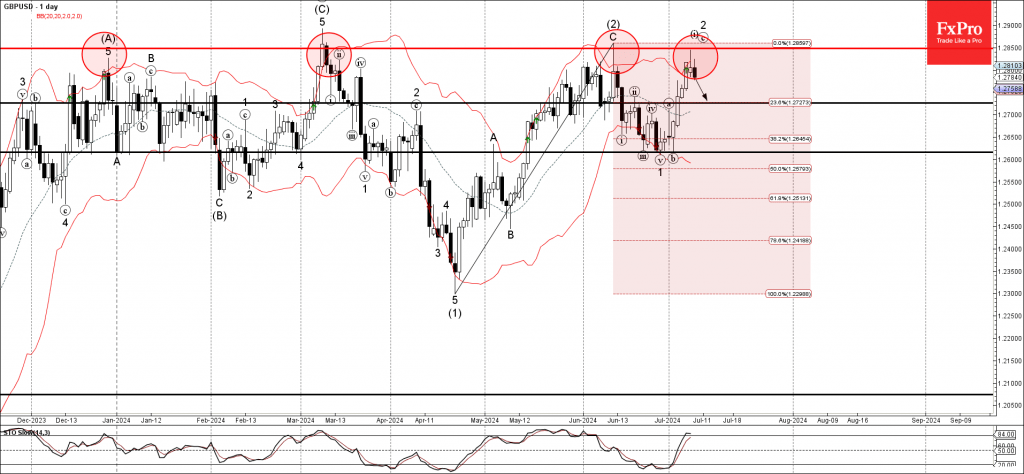
GBPUSD Wave Analysis
- GBPUSD reversed from the long-term resistance level 1.2850
- Likely to fall to support level 1.2725
GBPUSD currency pair is under bearish pressure after the earlier downward reversal from the long-term resistance level 1.2850, which has been reversing the price from the start of March.
The downward reversal from the resistance level 1.2850 created the daily Japanese candlesticks reversal pattern Shooting Star Doji – which stopped the previous ABC correction 2.
Given the strength of the resistance level 1.2850 and the still overbought daily Stochastic, GBPUSD currency pair can be expected to fall further to the next support level 1.2725.