Sample Category Title
Australian Dollar Drifting After Mixed Confidence Data
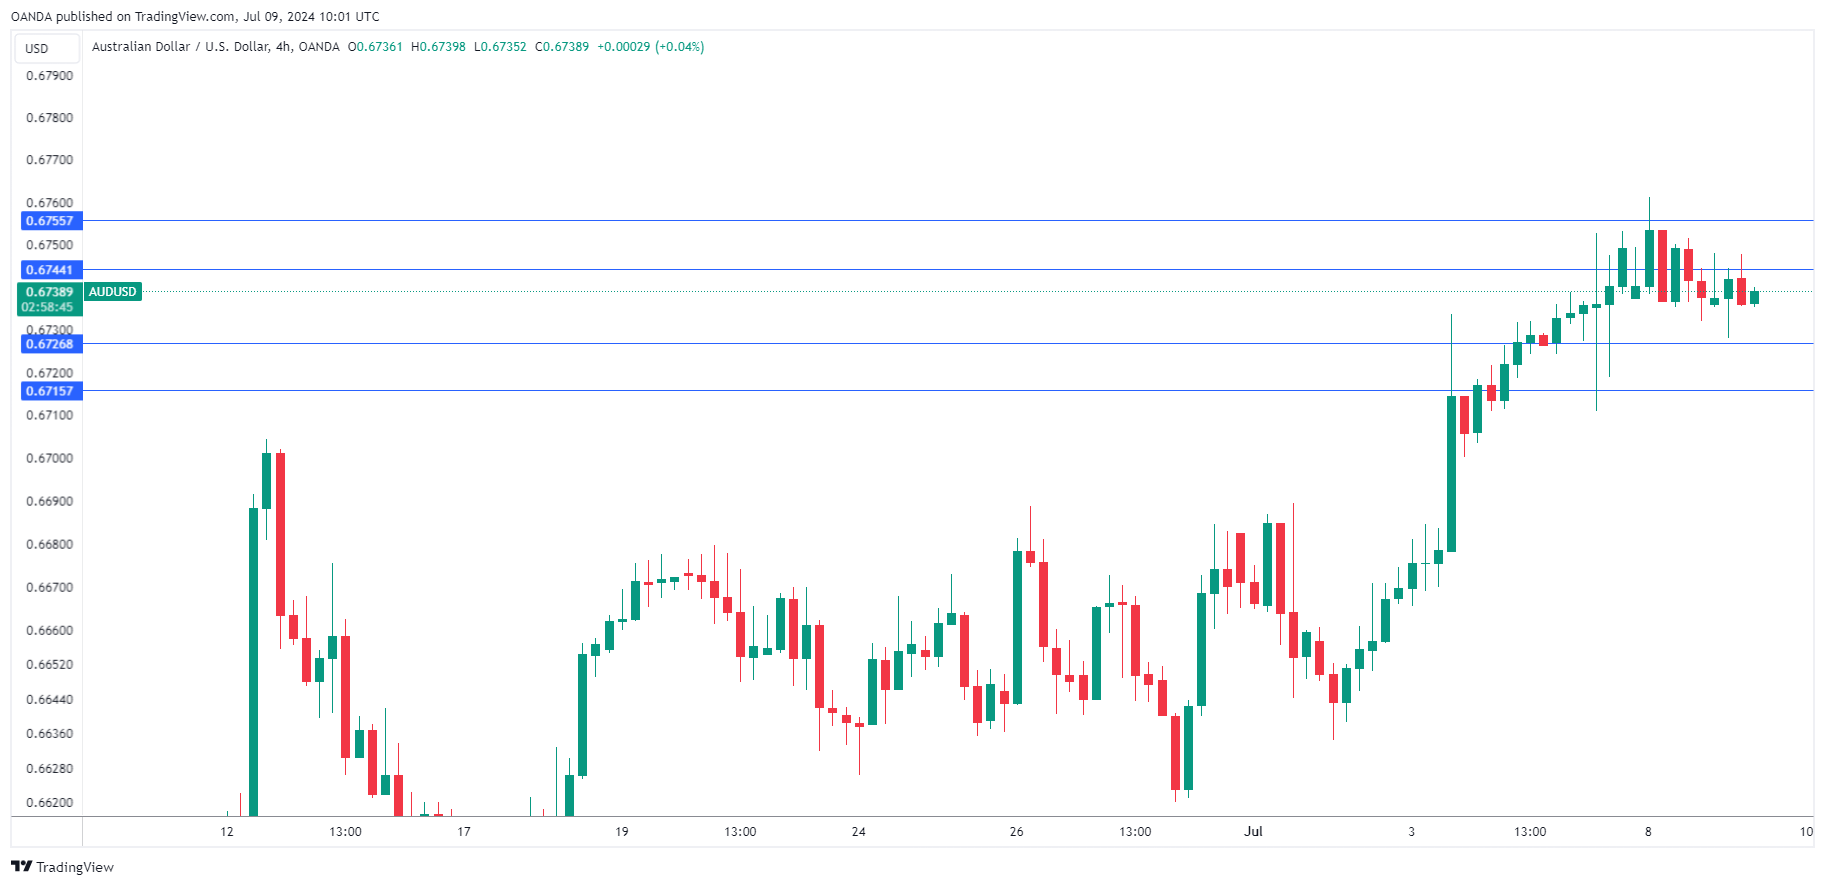
The Australian dollar continues to show little movement this week. AUD/USD is trading at 0.6638 in the European session, up 0.02% on the day. Australia released mixed confidence indicators earlier today while there are no US economic releases. Federal Reserve Chair Powell testifies before the US Senate banking committee later today.
Australian confidence indicators presented a mixed picture of the mood in the private sector. The Westpac Consumer Confidence Index declined by 1.1% in July after a strong gain of 1.7% in June. This marked the fifth decline this year as consumers have been squeezed by high borrowing costs and sticky inflation. The index fell to a six-month low of 82.7 and a pickup in economic activity will depend on consumers feeling confident and opening up their wallets and purses.
Business confidence is in better shape, as the NAB Business Confidence index rebounded to 4 in June, after a revised -2 in May. This was the highest level since January 2023. The improvement in confidence rippled throughout the economy as most industries, including manufacturing, posted increases. At the same time, business conditions edged lower and employment fell, reflecting the slowing economy.
Fed Chair Powell will deliver his semi-annual monetary policy testimony today and the markets will be looking for hints about a September rate cut. Powell sounded hawkish at the ECB forum in Portugal last week, reiterating that the Fed needs to see further evidence that inflation will continue to fall before hitting the rate-cut button. The markets, however, continue to show more optimism about a September cut. The probability of such a move has climbed to 73%, compared to 63% a week ago and just 46% one month ago, according to the CME’s FedWatch tool.
AUD/USD Technical
- AUD/USD is testing resistance at 0.6744. Above, there is resistance at 0.6755
- 0.6726 and 0.6715 are the next support levels
Pound Preparing for Bullish Breakout
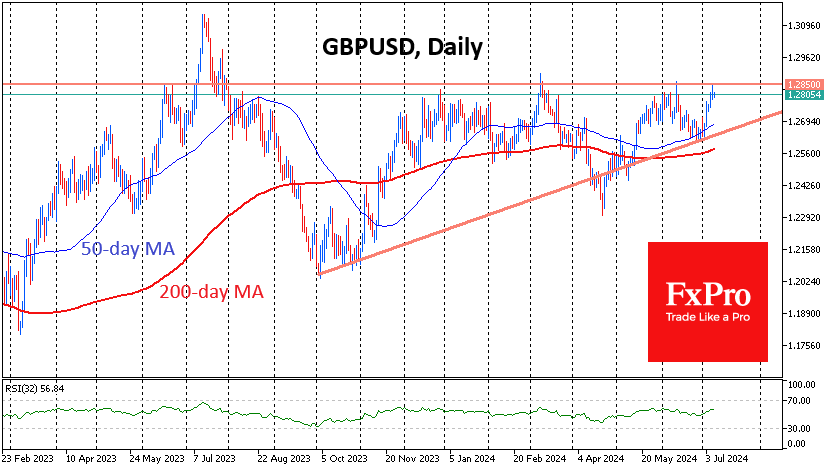
GBPUSD is trading near 1.28, which has acted as an area of resistance in the pair since last December. At the same time, the range of fluctuations of the pound is narrowing, as since October, the downside impulses have become less and less deep, with the price increasingly approaching the top of the ascending triangle. Classically, such a pattern ends with a breakout of resistance.
The current resistance’s importance is reinforced by the fact that near 1.2850 is the 200-week moving average, an important filter of the long-term trend. A failure under this line in 2022 kicked off a more than 20% collapse in the pound over the next six months. Almost exactly one year ago, we saw a false breakdown of this line followed by a month and a half of increased pressure. This only reinforces the importance of a resistance breakdown if a new bear attack does not follow it.
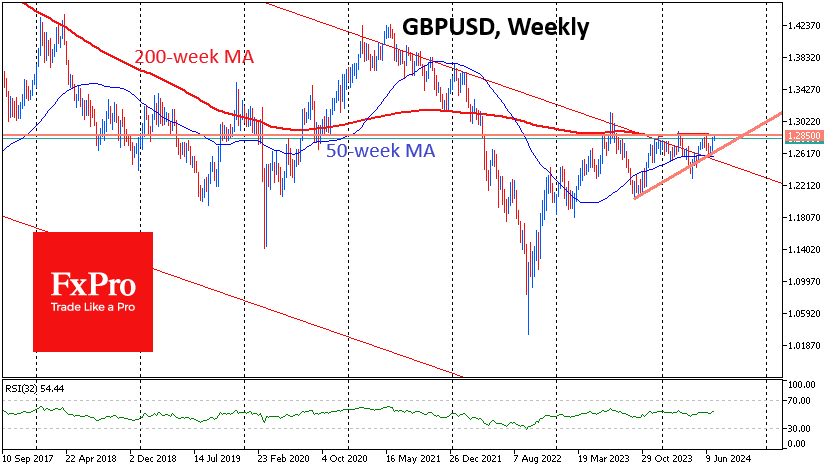
GBPUSD recently gained support on the decline towards the 50-week average. More importantly, the bears attempted to drag the pound back into the long-term channel in which the pair has been trading since 2008.
In the impending battle between the bulls and bears, the former has more visual advantages so far. GBPUSD’s ability to rise above 1.29 will be an important signal of a change in market sentiment, confirming the breakdown of horizontal resistance and overcoming the 200-week moving average.
The above bullish scenario opens a fast path to the 1.31 area (last year’s peak). However, the upside potential does not end here, and the pair may reach 1.42—the peak of 2021.
An alternative scenario is a new GBPUSD reversal to the downside, reversing all bullish scenarios mentioned above. This has happened many times before, and getting too excited about buying without proper confirmation signals would not be wise.
ECB’s Panetta backs gradual rate cuts amid stabilizing inflation
ECB Governing Council member Fabio Panetta indicated today the "reduction of official rates could proceed gradually", in line with the return of inflation towards the ECB's target. Speaking to bankers in Rome, Panetta emphasized that as long as macroeconomic trends remain consistent with ECB's expectations, this gradual approach will be maintained.
Panetta downplayed concerns over persistently high service sector prices, explaining that it is typical for service prices to decline more slowly compared to goods prices. He also noted that wage growth is expected to moderate in the near future.
"Past interest rate hikes are still dampening demand, output, and inflation and will continue to do so in the months to come," Panetta remarked.
WTI Outlook: Correction Should Find Firm Supports at $80 Zone
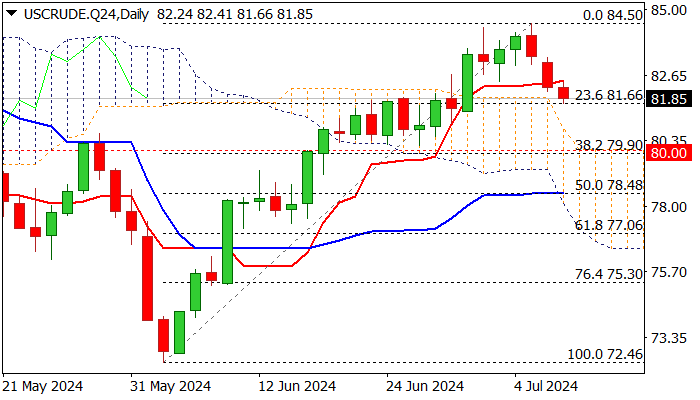
WTI oil price is easing for the third day, correcting lower from new multi-week high ($84.50, the highest since mid-Apr).
Bulls lost traction after milder than expected impact of the hurricane on oil installations in the Gulf of Mexico, eased concerns about supply shortages and prompted traders to collect profits.
Current pullback is seen as correction of a larger uptrend from $72.46 (June 4 low) which should find firm ground at $80 zone (psychological / Fibo 38.2% of $72.46/$84.50 daily cloud top), to mark a healthy correction and offer better buying opportunities.
The notion is supported by overall bullish picture on daily chart and persisting supply concerns over the conflict in the Middle East.
Res: 82.50; 83.00; 84.03; 84.43.
Sup: 81.66; 81.00; 80.00; 79.61.
GBP/USD Outlook: Bulls Pause ahead of Powell
Cable is holding within a narrow range under new multi-week high during European trading on Tuesday, as markets await today’s key event - the testimony of Fed Chair Powell.
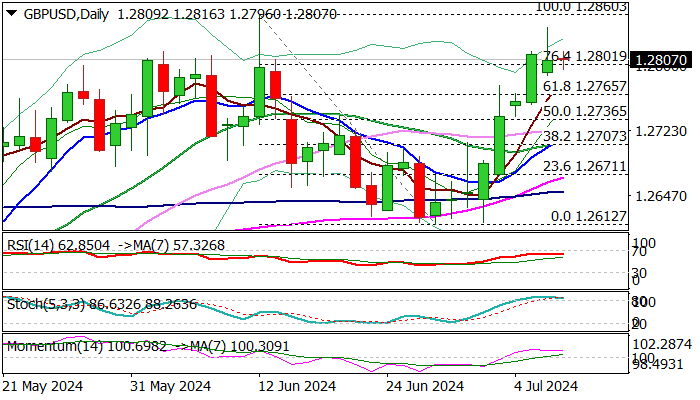
Long upper shadow of Monday’s daily candle and overbought conditions on daily chart suggest that bulls may take a breather at 1.2800 zone (also Fibo 76.4% of 1.2860/1.2612 bear-leg).
Bullish studies favor further upside, with consolidation likely to be narrow, before final push towards targets at 1.2860/93 (Jun 12 high / 2024 top).
Comments from Powell are likely to be dovish and to add to expectations for rate cut plans however, Thursday’s release of US June inflation report would play significant role after policymakers reiterated their stance that rate cut decision will highly depend on economic data.
Initial supports at 1.2788/65 (Monday’s low / broken Fibo 61.8%) should ideally contain, with extended dips not to exceed daily Kijun-sen (1.2736) to keep larger bulls in play.
Res: 1.2822; 1.2845; 1.2860; 1.2893.
Sup: 1.2788; 1.2769; 1.2736; 1.2713.
DAX Elliott Wave: Buying the Dips at the Blue Box Area
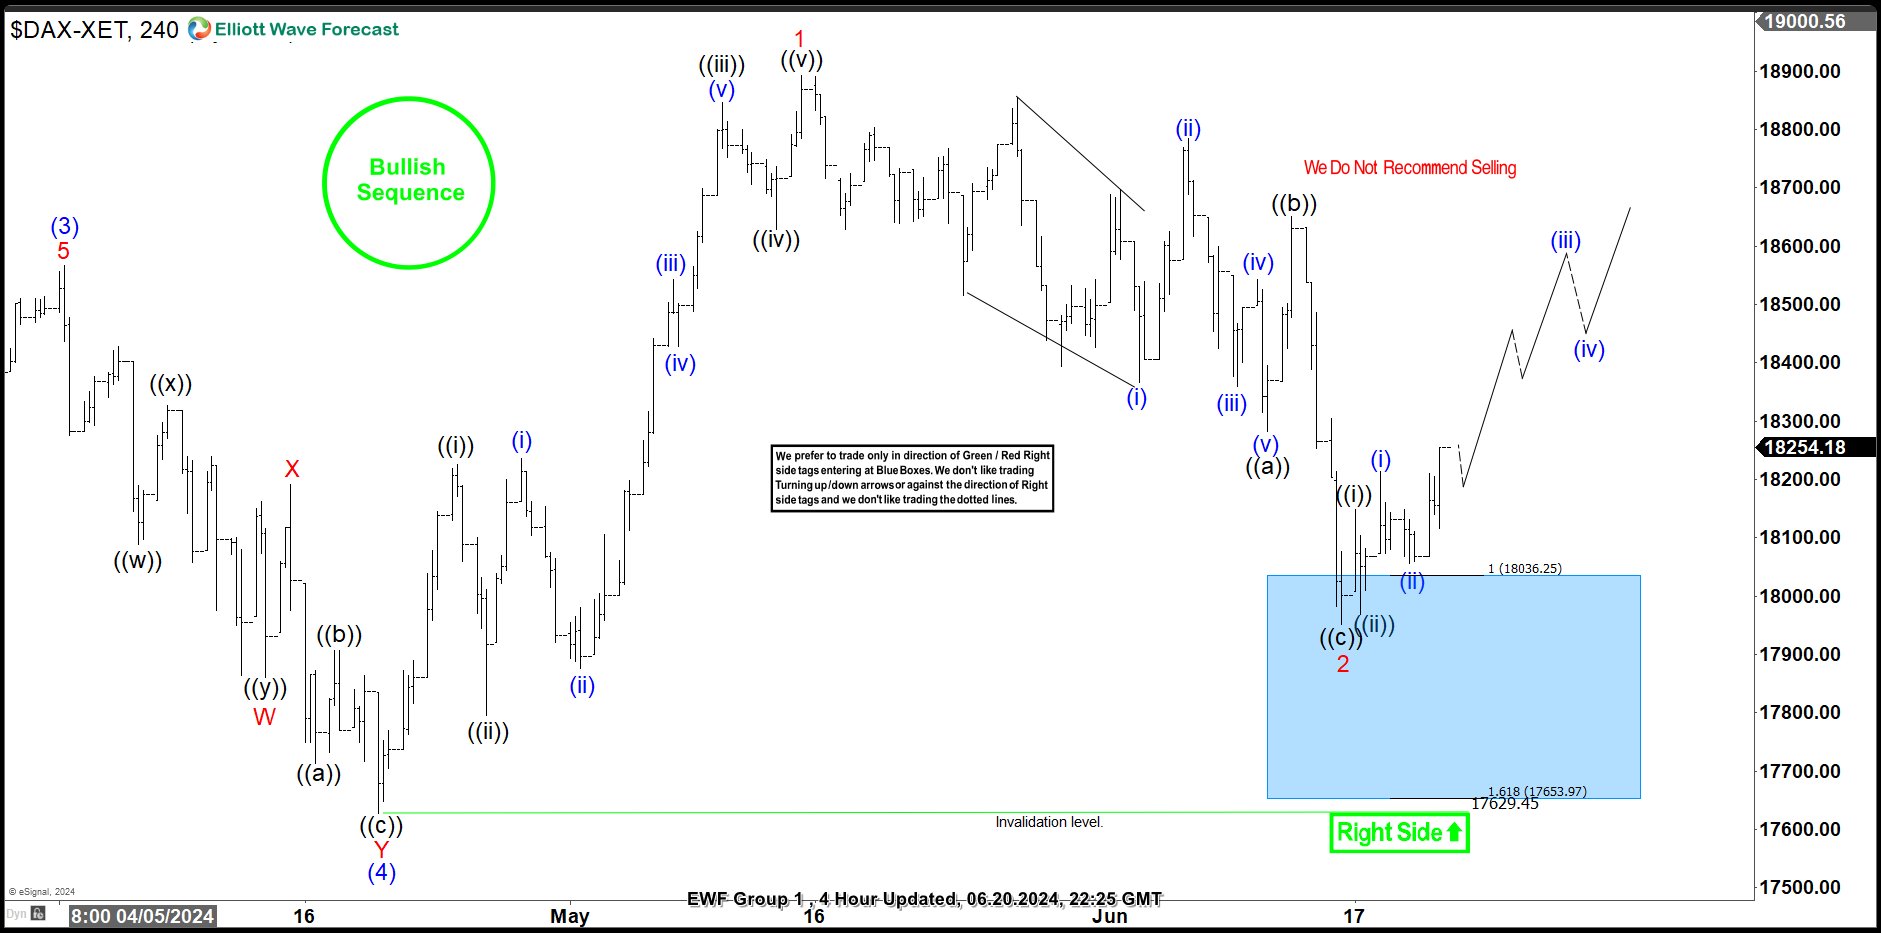
Hello fellow traders. In this article we’re going to take a quick look at the Elliott Wave charts of DAX published in members area of the website. As our members know DAX is showing impulsive bullish sequences and we are keep favoring the long side. Recently we got a 3 waves pull back that has ended right at the Blue Box zone (buying area). In the further text we are going to explain the Elliott Wave Forecast and trading setup.
DAX Elliott Wave 1 Hour Chart 06.20.2024
DAX remains bullish against the 17629.4 pivot. The Index has made clear pull back in 3 waves. The price already reached Extreme zone ( buying area) at 18036.25-17653.97 and giving us reaction. As our members know Blue boxes are based on 100% – 161.8% Fibonacci extension area , that we trade in 3, 7, or 11 swing corrective sequence. DAX index should ideally make a rally toward new highs or 3 waves bounce alternatively.
Once the price touches the 50 fibs against the ((b)) black connector, we’ll make positions risk-free and set the stop loss at breakeven and book partial profits. Breaking below the 1.618 Fibonacci extension level at 17653.97 would invalidate the trade.
Official trading strategy on How to trade 3, 7, or 11 swing and equal leg is explained in details in Educational Video, available for members viewing inside the membership area.
Quick reminder on how to trade our charts :
Red bearish stamp+ blue box = Selling Setup
Green bullish stamp+ blue box = Buying Setup
Charts with Black stamps are not tradable. 🚫
DAX Elliott Wave 1 Hour Chart 07.08.2024
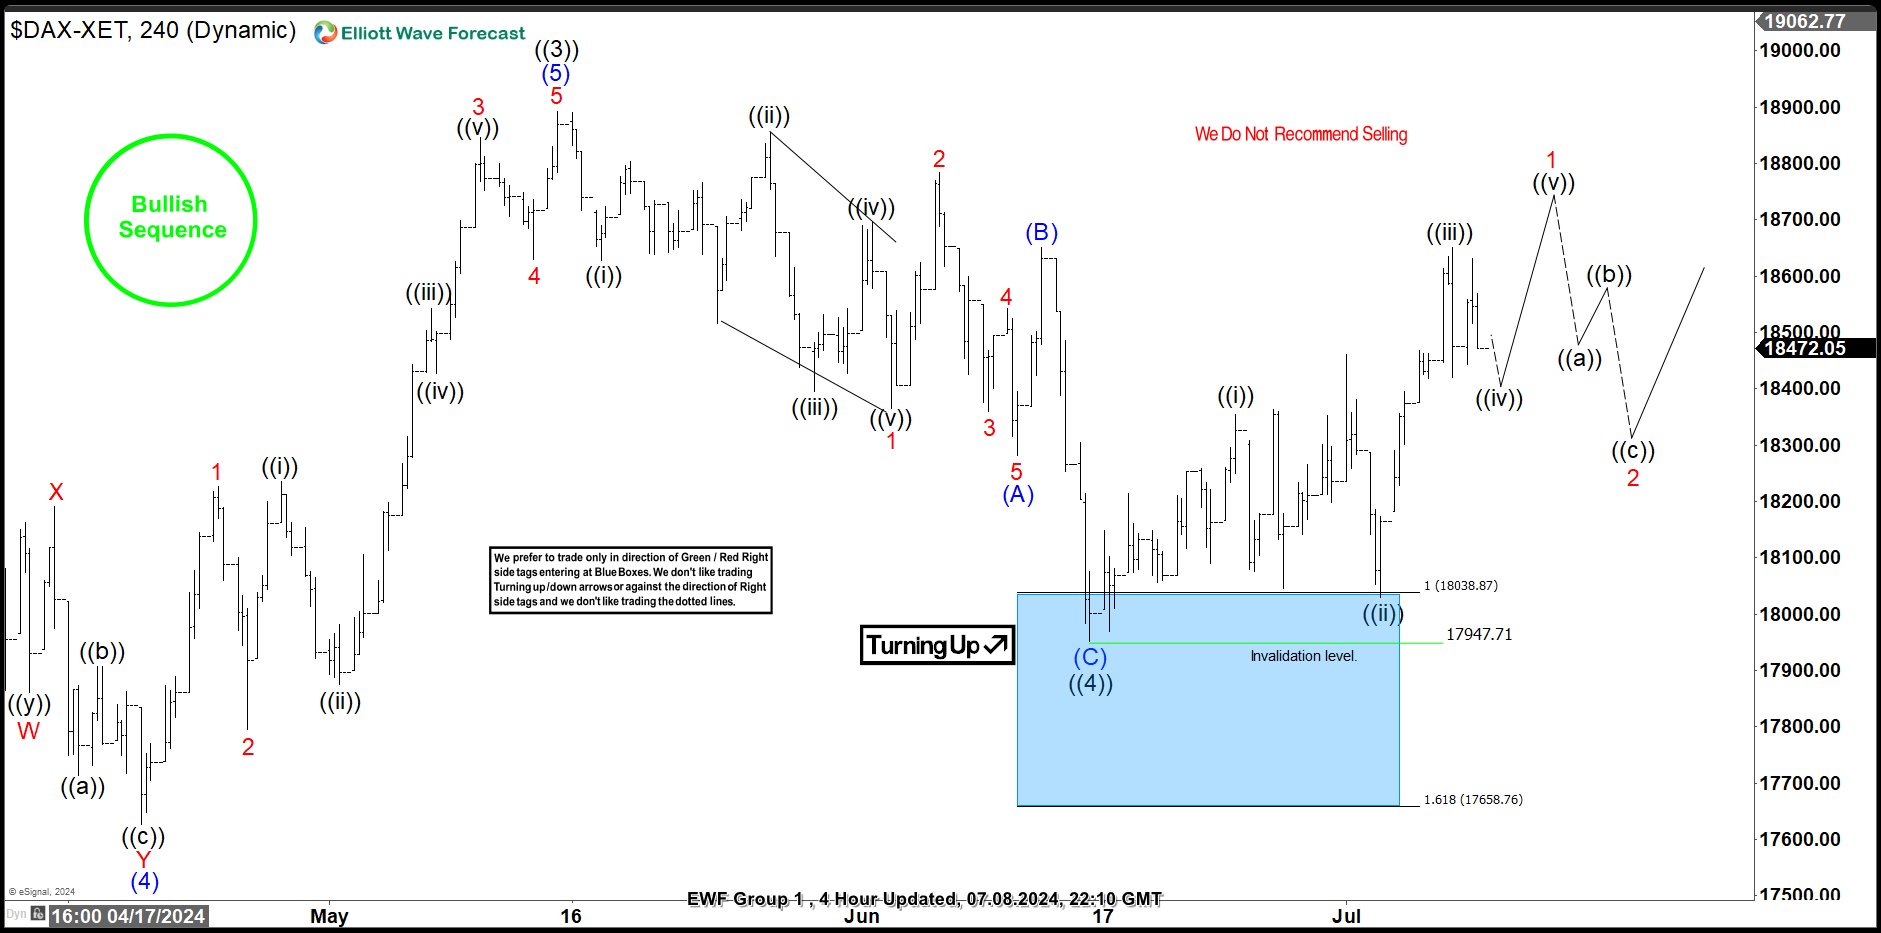
DAX made a nice reaction from our buying zone. The index has reached and exceeded 50 fibs against the (B) blue high. So members who took the long trade are enjoying profits now in a risk free positions. We would like to see break of ((3))) black high, to confirm next leg up is in progress.
XAU/USD Analysis: Gold Price Falls from Six-Week High
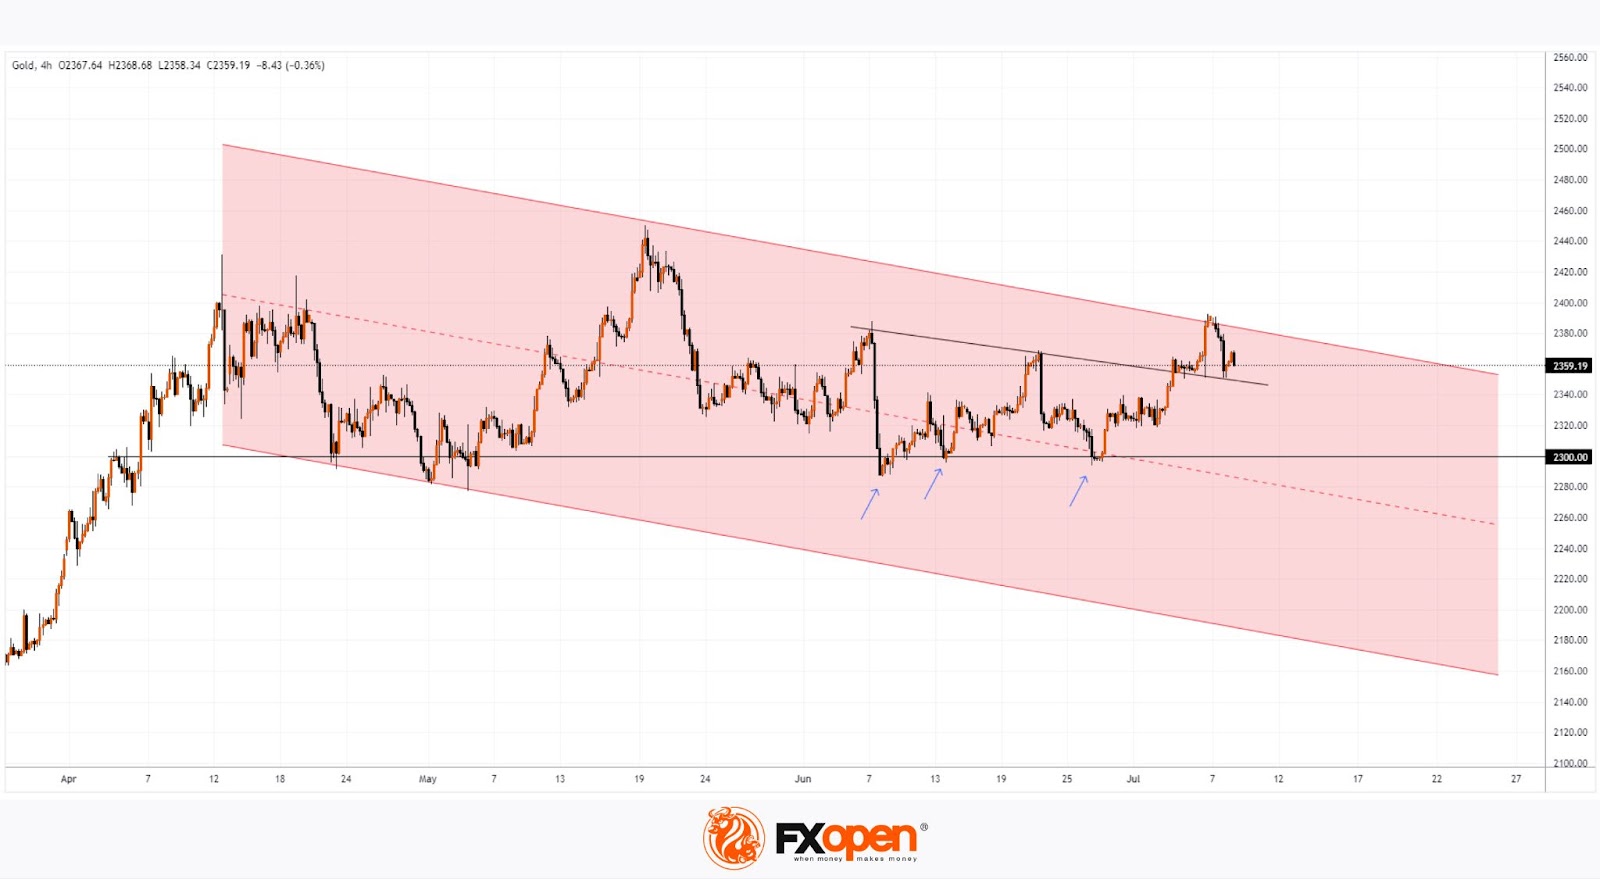
As shown by the XAU/USD chart, on Friday, 5 July, the price of gold rose above the $2390 level for the first time since 22 May. According to Reuters, this increase occurred following the release of key US employment data, which indicated a softening labour market, raising expectations of a Federal Reserve interest rate cut in September.
However, yesterday, Monday, the gold price fell to $2360 per ounce – the level from which Friday's ascent began. This suggests that the bulls were unable to maintain control over the market, which indicates a bearish sign.
Could the Gold Price Decline in the Coming Days?
From a technical analysis perspective of the XAU/USD chart:
- The gold market has clear support around the $2300 area. Each time the price fell below this level in June (as indicated by arrows), it quickly rebounded upwards, demonstrating sustained demand.
- Price action since April provides enough reference points to establish a descending channel (shown in red). The recent bearish reversal returned the price within this channel, reinforcing resistance from its upper boundary.
- There is also reason to believe that the bullish breakout of local resistance (shown in black) might be false.
Therefore, signs of seller activity in the $2380-2400 range suggest that the gold price could continue to decline towards the important support at $2300.
External Influences on the Gold Market
The head of the Federal Reserve, Jerome Powell, is likely to have a significant impact on the gold market. Powell will testify before Congress, starting with an appearance in the Senate on Tuesday at 17:00 GMT+3, followed by the House of Representatives on Wednesday at 17:00 GMT+3.
If Powell hints directly or indirectly at signs of weakness in the US economy, this could provide a positive impulse for the gold price. In such a scenario, expectations of an imminent rate cut may increase (currently, according to CME’s FedWatch Tool, the probability of a September rate cut is estimated at 77%). The attractiveness of non-yielding gold bars typically rises in a low-interest-rate environment.
Start trading commodity CFDs with tight spreads. Open your trading account now or learn more about trading commodity CFDs with FXOpen.
This article represents the opinion of the Companies operating under the FXOpen brand only. It is not to be construed as an offer, solicitation, or recommendation with respect to products and services provided by the Companies operating under the FXOpen brand, nor is it to be considered financial advice.
Crypto Bargain-Hunters Are Back
Market picture
Bargain hunters are showing themselves in full force in crypto. Cryptocurrency market capitalisation rose 3.6% in 24 hours to $2.11 trillion, climbing back to the top of the range of the past five days. It will take the market to rise another 2% before we can say that the bear attack has been repelled. Until then, we can only talk about consolidation after the sell-off.
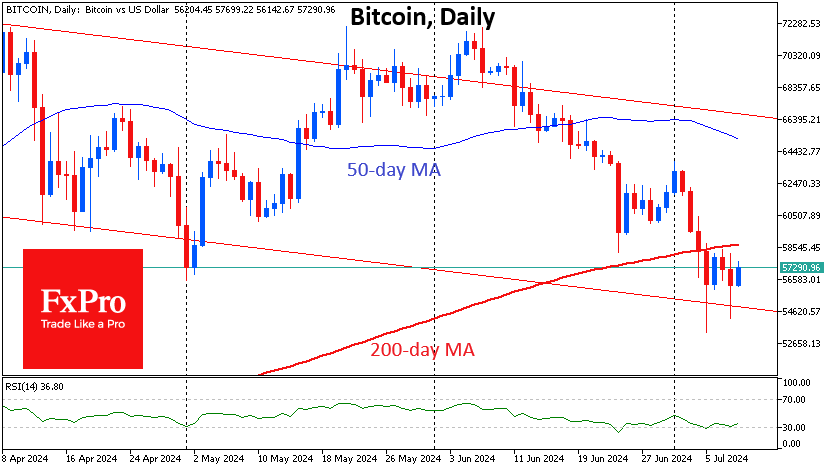
Bitcoin rebounded to $57.3K after a couple of dips to $54K, sticking to its descending channel that has been in force since March, but the price is very dangerously stuck at the bottom of this corridor. This situation makes us fear an acceleration of the sell-off with a potential target in the $50-51K area, where the crypto market was stagnant in February.
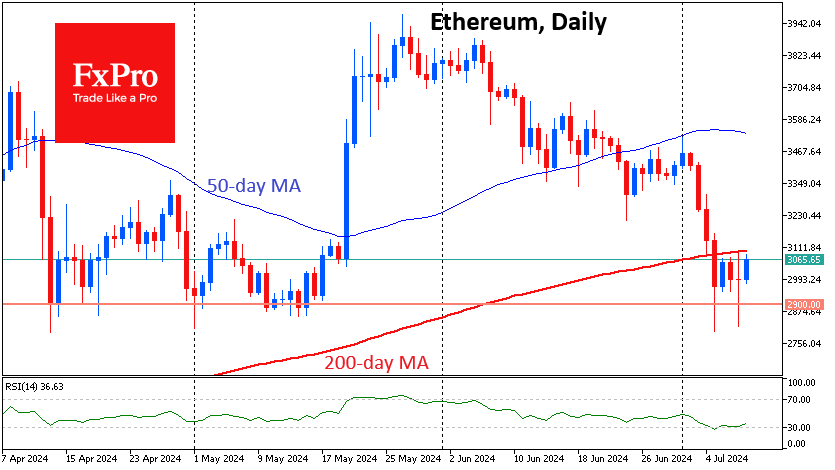
Ethereum trades at $3050 and remains below the 200-day moving average but has not given up trying to climb higher. Here, ETH has a strong support line, which also attracted buyers in April and May. More on the bulls’ side is that the RSI on daily timeframes rises from oversold territory. These are promising technical signals, but the sustained sell-off from the US and German governments and the overhang of selling from Mt Gox lenders is clearly undermining the confidence of too many buyers.
News background
According to CoinShares, investments in crypto funds rose by $441 million last week for the first time after three weeks of outflows. Bitcoin investments increased by $398 million, Solana by $16 million, Ethereum by $10 million.
Recent price declines, driven by potential selling pressure from Mt Gox and the German government, were probably seen as a buying opportunity. Inflows into BTC accounted for only 90% of the total inflows, as investors chose to invest in a much broader set of altcoins. The most notable of these was Solana, which has received $57 million in investments since the beginning of the year, making it the most efficient altcoin in terms of flows, CoinShares noted.
German authorities continue to transfer Bitcoins to exchanges. On 8 July, two 250 BTC transfers were made to Coinbase and Bitstamp platforms. Transactions of 700 BTC and 500 BTC followed to unidentified Arkham numbers.
The Bitstamp exchange promised to distribute the payments from Mt Gox “as soon as possible,” despite having a 60-day deadline. So far, only Japanese BitBank and SBI VC Trade addresses have been distributed coins. The three remaining recipients – Bitstamp, Kraken and BitGo – are still awaiting their turn. The trustee has 94,771 BTC (~$5.4bn) left to send.
Bitfinex points out signs of a potential end to the market correction. Short-term investor selling is potentially close to exhaustion. Meanwhile, the funding rate for perpetual BTC contracts has turned negative for the first time since 1 May.
EUR/USD Holds Firm Amid Weakening Dollar and Rate Cut Expectations
The EUR/USD pair is maintaining its position close to a multi-week high of 1.0829, benefitting from the weakening US dollar following a disappointing June US employment market report. Market anticipation is now building ahead of an upcoming speech by Federal Reserve Chair Jerome Powell.
Despite the looming potential for political deadlock in France, the euro has remained resilient. Investors are finding reassurance in the belief that the current political situation may act as a deterrent to any drastic fiscal measures from far-right or far-left parties, thereby stabilising the financial landscape.
With a relatively quiet macroeconomic calendar, attention is squarely on the US interest rate trajectory. According to CME FedWatch, the likelihood of a rate cut at the Fed's September meeting has increased to 76%, up from 66% the previous week. Expectations are also growing for a second rate cut in December.
Jerome Powell's testimony before Congress, starting Tuesday, will be pivotal for currency markets, as insights into the Fed's policy outlook could influence exchange rates significantly.
Technical analysis of EUR/USD
The EUR/USD is navigating through a consolidation range just above the 1.0806 level. There is a strong potential for an upward move towards 1.0900, which is currently being considered. If this level is reached, a retest to 1.0844 may follow before another potential rise to 1.0944. This bullish setup is further supported by the MACD indicator, where the signal line remains above zero and points upwards, indicating a continued upward momentum.
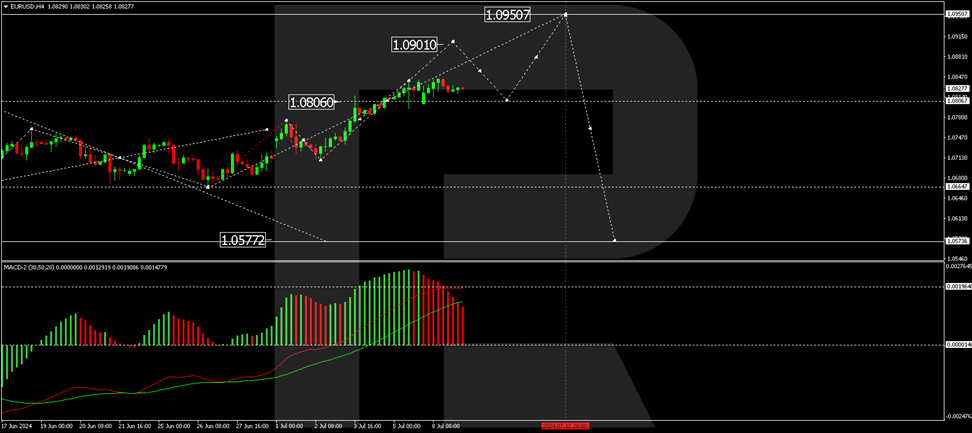
On the H1 chart, the market is poised for further advancement after completing a growth pattern to 1.0840 and a subsequent correction to 1.0820. A move towards 1.0844 is expected. If this level is breached, it could pave the way to 1.0900. The Stochastic oscillator reinforces this outlook, with the signal line currently above 50 and trending upwards, suggesting a strengthening bullish momentum.
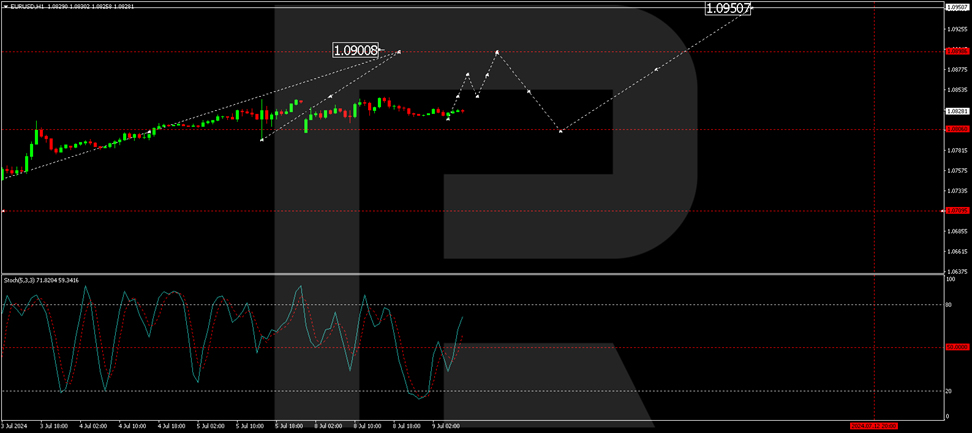
Investors will be keenly watching for Powell's comments and any further economic indicators this week, as they could play a crucial role in shaping short-term market dynamics and currency valuations.
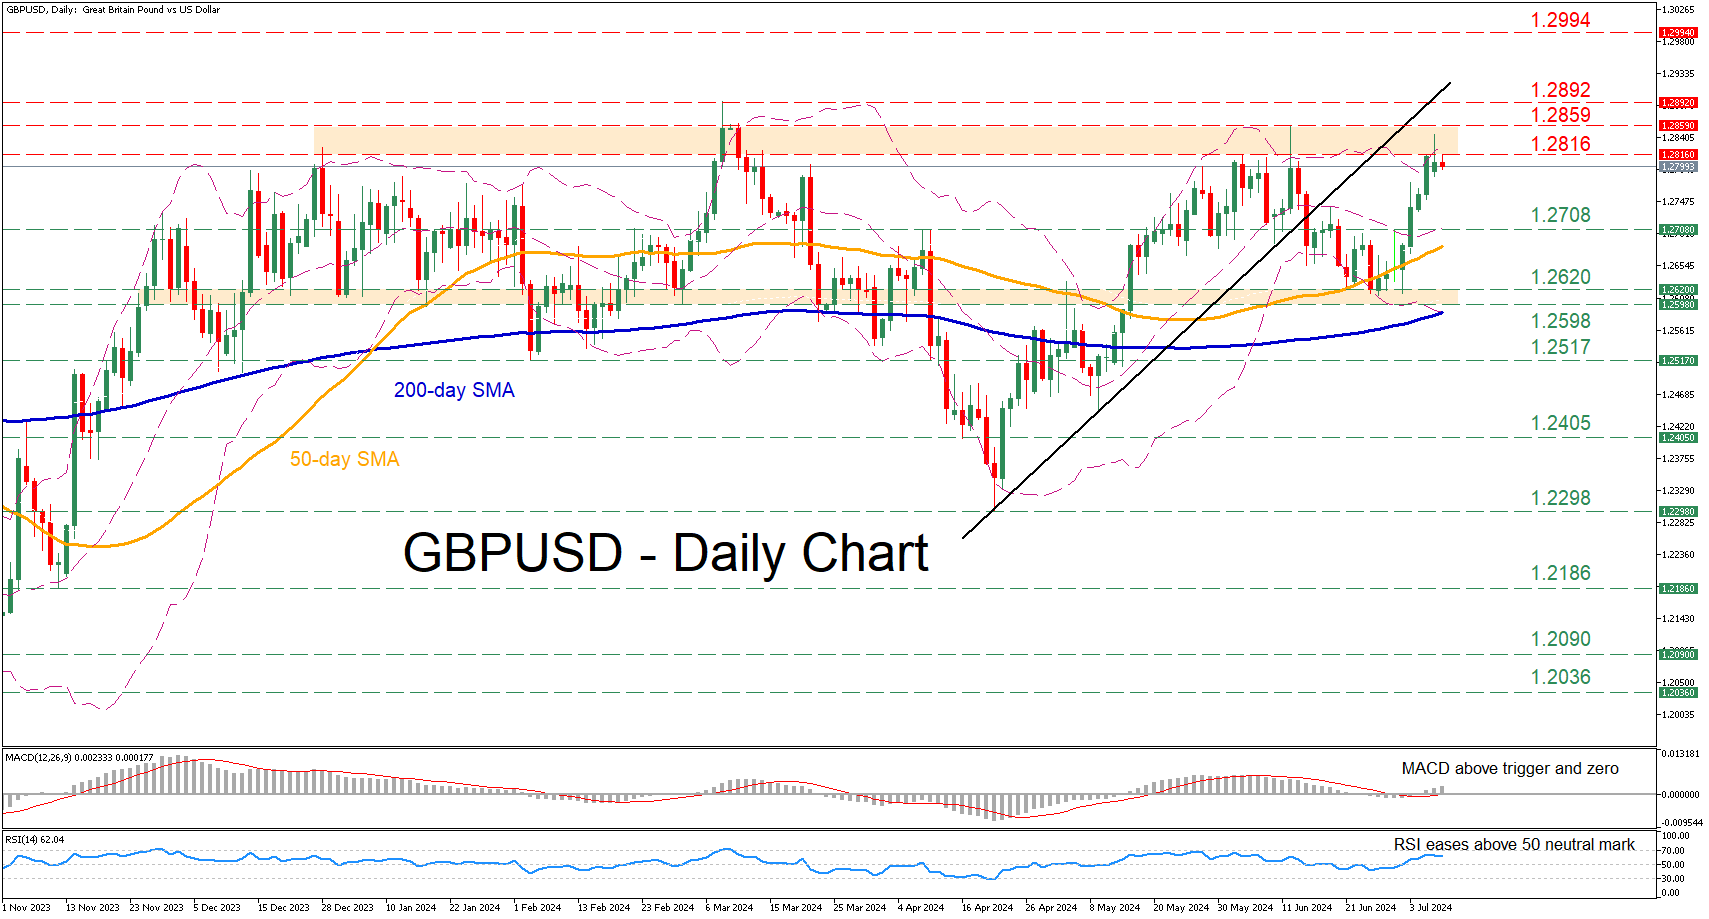
GBPUSD Advances Towards 2024 Highs
- GBPUSD rebounds from its 50-day SMA
- The price jumps to its highest since June 12
- Momentum indicators are tilted to the upside
GBPUSD has been slowly gaining ground following its bounce off the 50-day simple moving average (SMA) in late June. Moreover, the pair has entered a range that has previously rejected further advances during the past year, thus traders should be careful not to get overly optimistic.
Should upside pressures persist, the price may clear the 1.2816-1.2859 range, defined by the recent three-month peak and the December 2023 high. A violation of that zone could pave the way for the 2024 high of 1.2892. Failing to halt there, the pair could storm towards the July 2023 resistance of 1.2994.
Alternatively, if the price experiences a pullback, the April resistance of 1.2708 could act as the first line of defence. Further declines could then cease at the 1.2620-1.2598 territory, which is framed by the June and March lows. Even lower, the February bottom of 1.2517 may provide downside protection.
Overall, GBPUSD has been on the rise in the past few sessions, attempting to revisit its 2024 peaks. However, a failure to storm to fresh highs could easily trigger a pullback.