Sample Category Title
Nasdaq 100 Index Wave Analysis
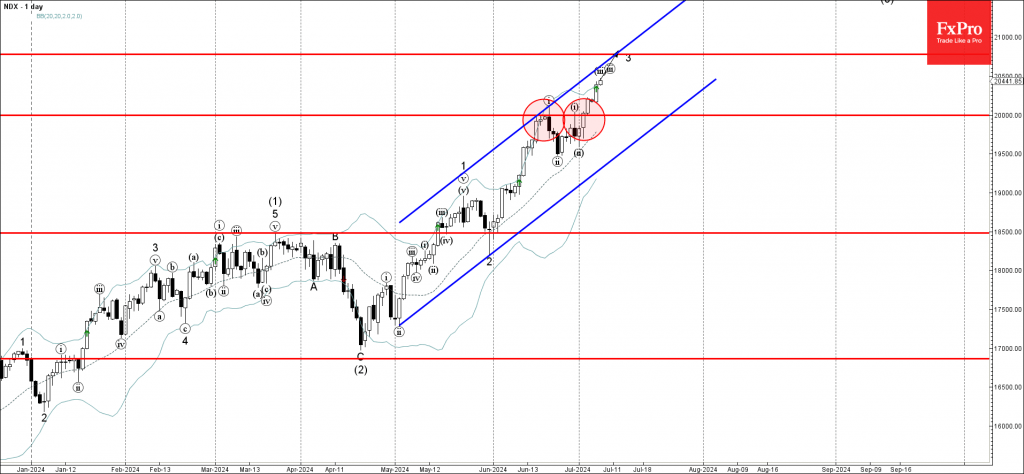
- Nasdaq 100 rising inside impulse wave 3
- Likely to test resistance level 20775.00
Nasdaq 100 index continues to rise inside the accelerated impulse wave 3, which previously broke the round resistance level 200000.00 (which stopped the previous waves (i) and i).
The active impulse wave 3 belongs to the higher order upward impulse wave (3) from the end of April.
Given the clear daily uptrend, Nasdaq 100 index can be expected to rise further to the next resistance level 20775.00 (target price for the completion of the active impulse wave 3 coinciding with the daily up channel from May).
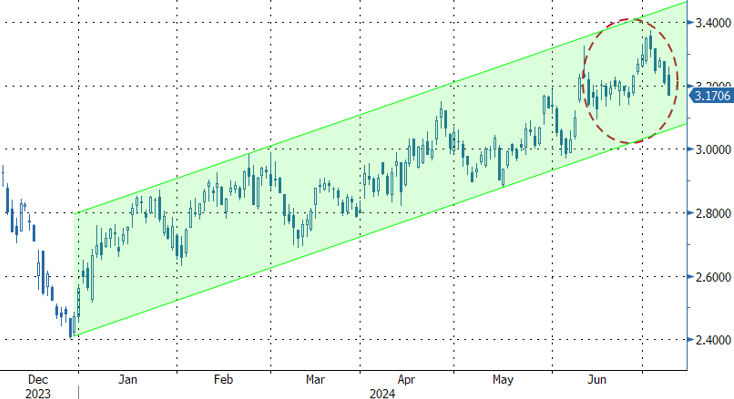
Gold Wave Analysis
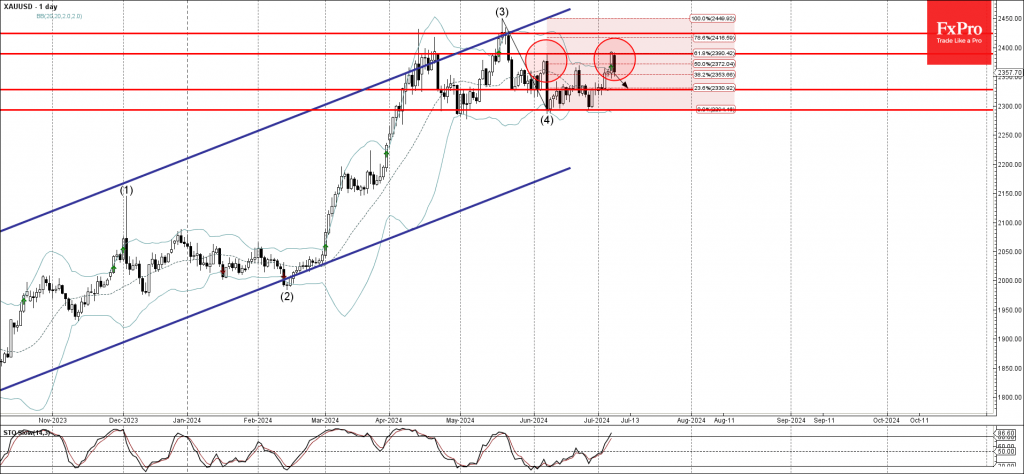
- Gold reversed from resistance level 2400.00
- Likely to fall to support level 2325.00
Gold today reversed down with the Bearish Engulfing from the key resistance level 2400.00 (which reversed the price at the start of June).
The resistance level 2400.00 was strengthened by the upper daily Bollinger Band and by the 61.8% Fibonacci correction of the previous downward correction (4) from the middle of May.
Given the strength of the resistance level 2400.00 and the overbought daily Stochastic, Gold can be expected to fall to the support level 2325.00.
June CPI Preview: Some Payback for May, but Downward Trend Remains
Summary
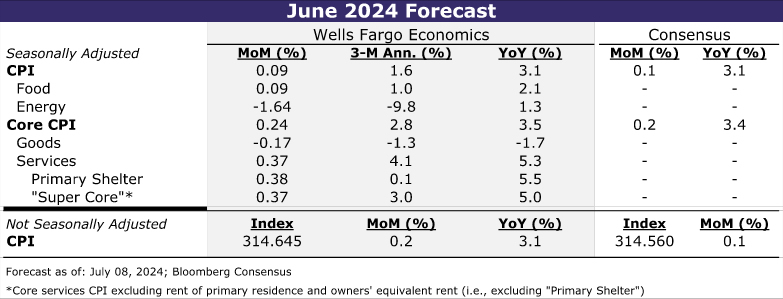
Consumer price inflation likely firmed in June relative to May but remained on a downward trajectory through the month-to-month noise. We estimate headline CPI rose 0.1% in June, with a decline in gasoline prices helping keep the overall increase in prices tame. The core index also looks to have rebounded slightly. We expect core CPI to register a “high” 0.2% gain (0.24% before rounding) after posting the smallest monthly gain in three years in May (0.16%). While a bounce back in core services ex-housing is likely to propel the pickup, favorable seasonal factors and broadly easing price pressures should mitigate the extent of June's rebound.
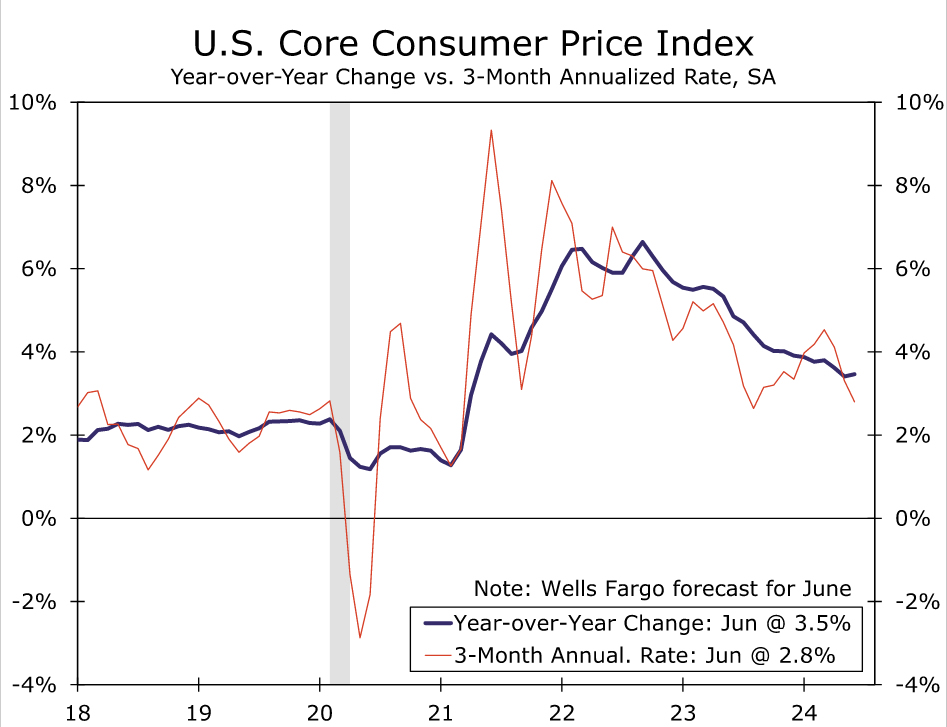
Overall, we expect June's CPI report be consistent with inflation slowing on trend. A 0.24% increase in June would be a noticeable step down from the 0.35% average monthly pace registered in the first quarter. If realized, the three-month annualized rate of core CPI would slow to 2.8% from 4.5% in March and 3.3% in December. While additional improvement on the inflation front is likely to remain slow-going when compared to the rapid reduction registered over 2022 and 2023, we continue to expect inflation to grind lower in the months ahead as input cost pressures ease and more tepid consumer demand makes it harder to raise prices.
Less Favorable than May, but Clear Improvement from Q1
Last month's CPI report delivered the first clear piece of good news on inflation this year. The Consumer Price Index held steady in May, marking the first month prices did not increase since the summer of 2022. Excluding food and energy, prices advanced 0.16%, which was the smallest rise in nearly three years and a tenth below consensus expectations. The CPI's tamer readings were echoed by the PCE deflator, the Fed's preferred inflation gauge. The core PCE index rose 0.08% over the month, half the pace of the FOMC's 2% target when measured on an annualized basis.
May's soft inflation data leave some wiggle room for the next few inflation prints to come in a little stronger yet still give the FOMC the “greater confidence” it seeks that inflation is on its way back to 2% on a sustainable basis. That bit of extra space could come in handy following June's inflation data to keep a September rate cut on the table. We look for the core CPI to come in slightly higher on an unrounded basis (0.24%), although that would still mark a step down from the 0.35% average registered in the first four months of the year. The resumption of the downward trend in core inflation should be made evident by the three-month annualized rate slowing to 2.8% from 4.5% in March and 3.3% in December, even as the year-over-year rate moves a touch higher (Figure 1).
Headline CPI should also indicate that while price growth strengthened a little in June, the trend is slowly becoming more benign. We estimate the headline index rose 0.1%, which would push the year-over-year rate back down to 3.1%. Gasoline should lead to another sizable decline in energy goods prices (3.6% on a seasonally adjusted bases by our estimate). However, with oil and gasoline prices drifting up in the early days of July, the dampening effect will likely be short-lived. Meantime, after declining in each of the past two months, energy services costs are likely to rise following May's jump in natural gas prices.
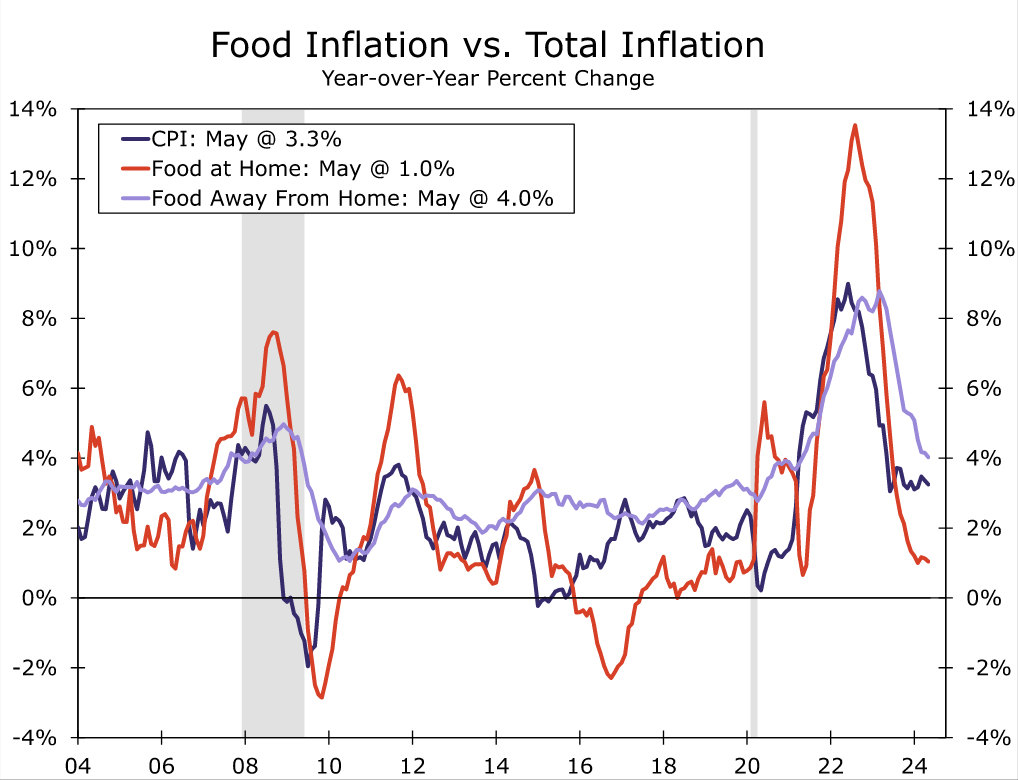
Consumers at least look to have gotten a bit more breathing room at the grocery store. We estimate prices for food at home were flat to down slightly last month amid growing promotional activity and a few major retailers recently announcing price cuts that are likely to pressure competitors' pricing. That should leave prices up just 1.0% on a year-ago basis compared to the recent zenith of 13.5% hit in the summer of 2022 (Figure 2). Price growth for food away from home should also moderate as labor costs and inflation-adjusted sales have weakened in recent months.
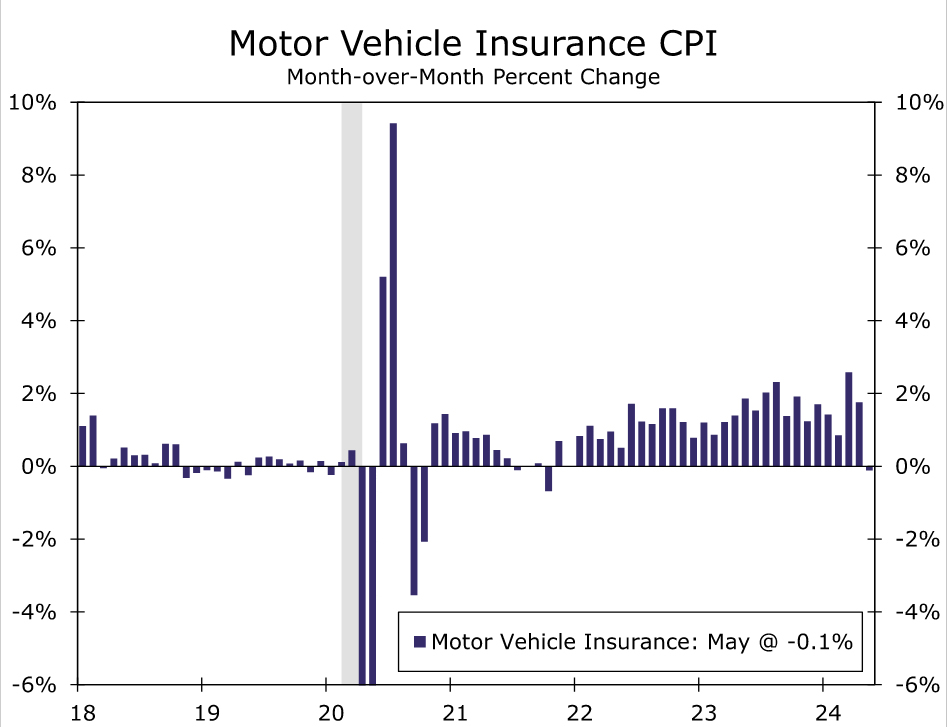
The sources of May's downside surprise to core CPI leave us expecting a little payback in June's gain. That said, we expect the degree of the bounce-back to be mitigated by broad easing in price pressures and favorable seasonal factors. Specifically, we look for June's firmer core reading of 0.24% to be driven by services less housing (Figure 3), with the CPI "super core" up 0.4% after holding steady in May. Fueling the pickup is likely to be a rebound in motor vehicle insurance after an outright decline last month. While improved profitability at auto insurers points to motor vehicle insurance inflation downshifting from the breakneck pace of the past year, last month's abrupt drop likely overstates the pace of moderation (Figure 4). More stable fuel prices also suggest prices in the volatile public transportation category (largely airfares) being little changed in June after falling 3.1% in May. Recreation and personal services prices also look ripe for a pickup after declining in May.
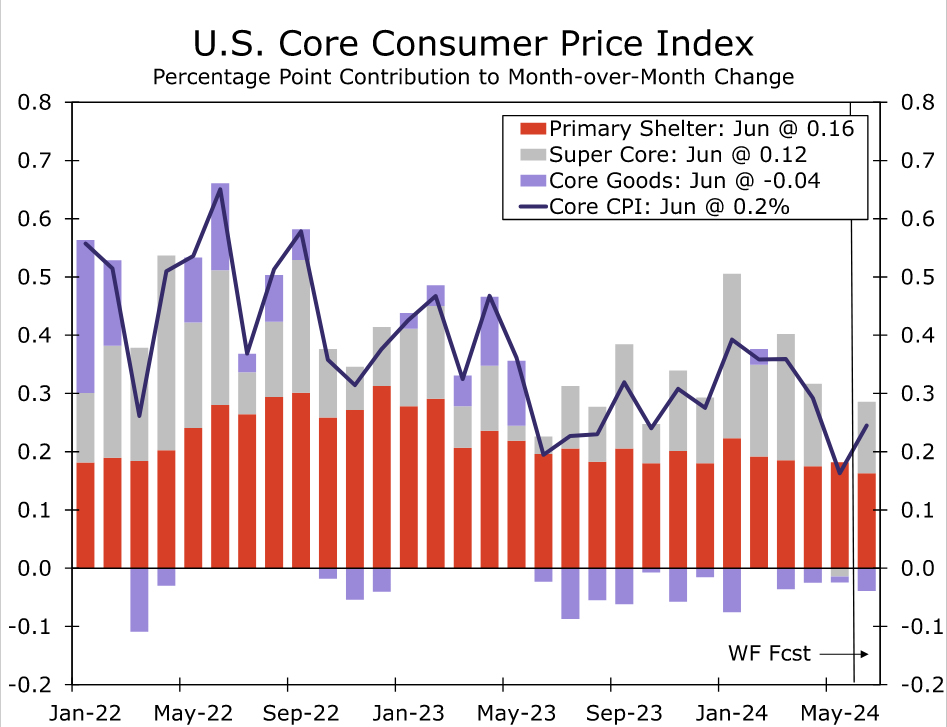
Yet beyond the “super core,” the downward trend in primary shelter remains in place, which we expect will lead to a further moderation in the monthly rate of primary rent of residences and owners' equivalent rent gains in June. At the same time, we look for core goods to decline more sharply in June (-0.2% after being unchanged in May). Vehicle prices remain under pressure from improved inventory and elevated financing costs, while the jump in prescription drugs and tobacco products that buoyed other core goods in May is unlikely to be repeated in June.
A return to more normal calendar year pricing patterns may also help keep core inflation from springing back sharply in June. Over the past five years, June has trailed only January and February in average monthly price increases on a non-seasonally adjusted basis, leading the June seasonal factor to “expect” a relatively large increase. However, prior to COVID, core prices in June typically rose less than the calendar year average. If businesses are no longer raising prices as significantly mid-year as the pricing tumult of the pandemic fades, the weakening trend in inflation could be amplified by the June seasonal factor.
Downward Pressure on Inflation Still in Place
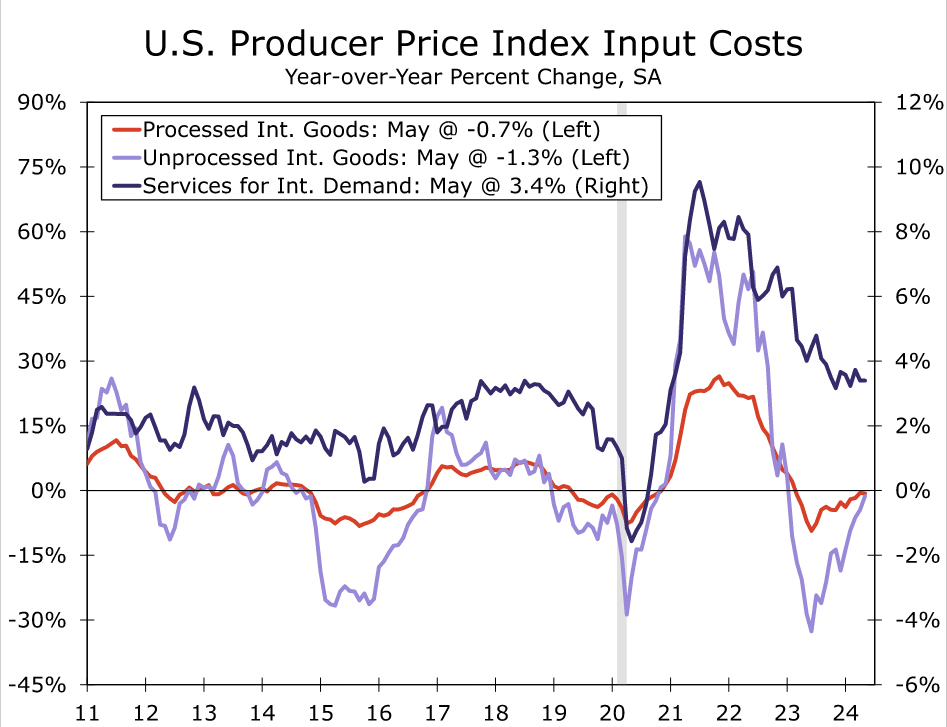
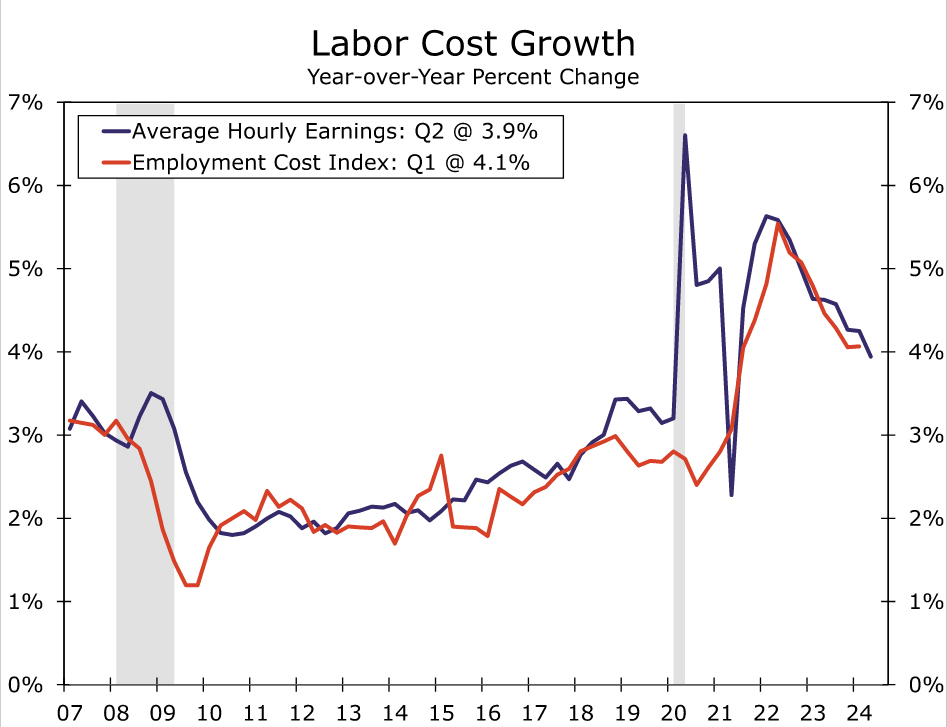
We continue to expect inflation to grind lower as we move through the second half of the year and into 2025 as overall price pressures are abating. While further improvement in supply chains is likely to be more modest ahead, more tepid consumer demand is likely to keep a lid on goods prices. Increasingly cost-conscious consumers are also likely to limit the extent of price increases across the service sector, while slower growth in input costs, including labor, is reducing the need to do so (Figures 5 & 6).
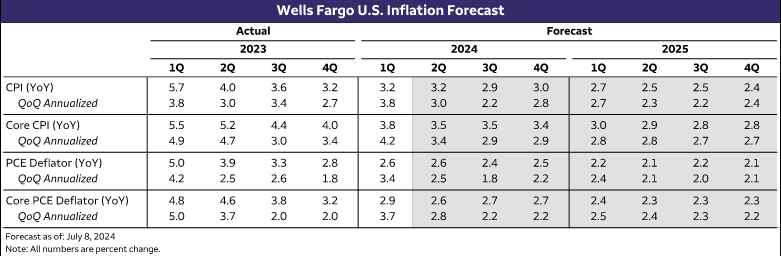
Additional improvement, however, is likely to remain slow-going when compared to the rapid reduction in inflation that occurred over 2022 and 2023. Headline CPI on a year-over-year basis is unlikely to break significantly below the bottom end of the past twelve months' 3.0-3.7% range as energy prices are more stable, although the core CPI should continue to ebb as the slowdown in market rents feeds further into shelter prices and non-food and energy goods prices fall further. The core PCE deflator is likely to show less improvement on a year-over-year basis given its smaller weight for shelter and tough base comparisons after the sharp slowdown in prices in the second half of last year. However, when measured on an annualized basis, it should be clearer to the Fed that inflation is more closely nearing its mark (Figure 7).
Could US CPI Report Finally Bring About a Fed Pivot?
- Further decline in headline CPI is expected in June
- Labour market is also showing signs of slowdown
- Will Thursday’s report (12:30 GMT) convince the Fed it’s time to cut?
- Ahead of that, Powell testifies on Tuesday (14:00 GMT)
Fed still not convinced
After several months of upside surprises earlier in the year, CPI inflation finally seems to be moving in the right direction. There’s been somewhat better progress in PCE inflation, but services inflation under both the CPI and PCE measures has been stubbornly high. When put against the backdrop of a still-tight labour market, the Fed’s ‘higher for longer’ stance is not only justified, but there was even a strong case to hike rates further at the beginning of 2024.
But patience may now be paying off, as not only are inflationary pressures on the wane again, but evidence is also mounting that the hot labour market is cooling. In the June jobs report, the unemployment rate ticked up 4.1% - the highest since November 2021, while annual wage growth eased to just below 4.0%. Payrolls rose by slightly more than expected but there was a downward revision of 111k for the prior two months.
Headline CPI to likely fall gain
With the jobs market slowing in a more convincing manner, the Fed has less reason to be cautious, and so further progress in the consumer price index might just tip the balance in favour of the doves.
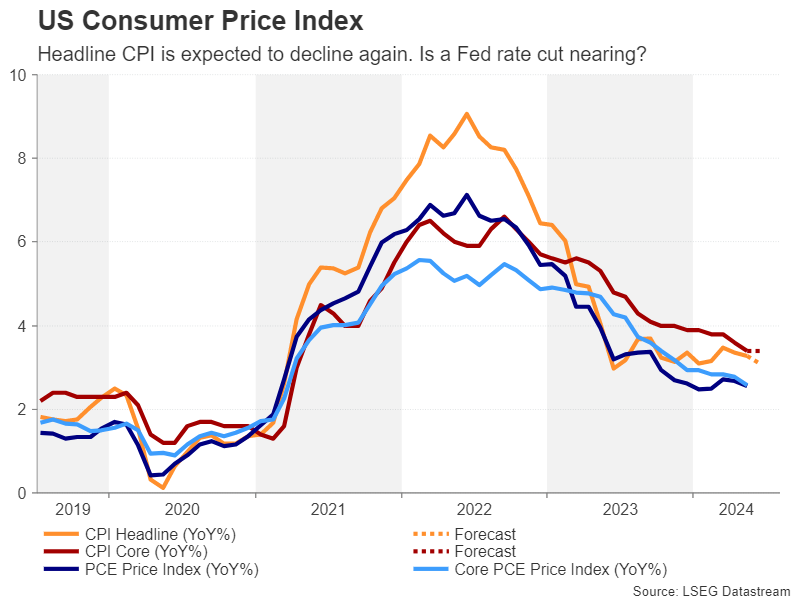
The headline CPI rate is expected to have moderated from 3.3% to 3.1% y/y in June, though the month-on-month pace is anticipated to have picked up to 0.1% from 0.0%. No change is forecast for the core CPI rate, however, with both the monthly and yearly figures expected at 0.2% and 3.4% respectively.
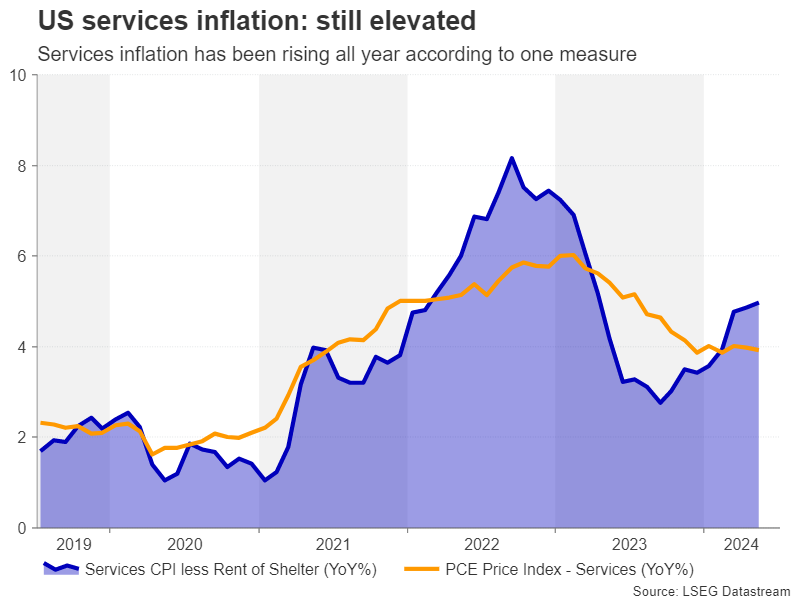
Sticky services CPI may delay a dovish pivot
Aside from those key numbers, the Fed will also be watching closely what happens to services inflation. Specifically, a core measure of services CPI that excludes shelter costs has been accelerating all year, hitting 5.0% y/y in May. The Fed would ideally want to see this particular metric head lower, probably for at least two consecutive months, before lettings its guards down on inflation.
Hence, even if all the various CPI metrics decline in June, it might not be enough for the Fed to start signalling that the time has come to cut interest rates just yet. This would rule out the July meeting for any policy shift, but it’s a different story for September. After this week’s CPI data, there will be another two CPI and PCE inflation reports to be released before the September FOMC, which leaves plenty of time for all the pieces to fall into place.
Powell testimony to test market nerves
Yet, with two rate cuts already fully priced in for 2024, how much can the data move the markets? Those investors hoping for some kind of a game changer might place their bets on three rate cuts this year or much more aggressive easing in 2025. For that to happen, though, there would have to be a significant deterioration in the labour market and Fed Chair Jerome Powell might shed some light on just how worried policymakers are about a sudden freeze in hiring or a jump in layoffs.
Powell is due to testify before the Senate Banking Committee on Tuesday and before the House Financial Services Committee on Wednesday. His prepared remarks typically get published before the hearing but investors pay as much attention to the question and answer session with lawmakers that follows.
How worried is the Fed about a cooling jobs market?
Fed officials have already expressed concern at some of the small cracks appearing in the labour market and Powell himself warned that “the labour market unexpectedly weakening is also something that could call for a reaction” when taking part in a panel discussion in Portugal last week.
Should Powell elaborate on those comments in his Congressional hearings this week, spurring speculation about a swift policy response in the event of a shockingly bad jobs report, the US dollar could come under fresh pressure.
Dollar bears eye 200-MA
The dollar index could also extend its latest pullback if the CPI numbers are softer than expected. Having already broken below its 50-day moving average (MA), the next stop could be the 200-day MA at 104.47, after which, the 104.00 level would come under scrutiny.
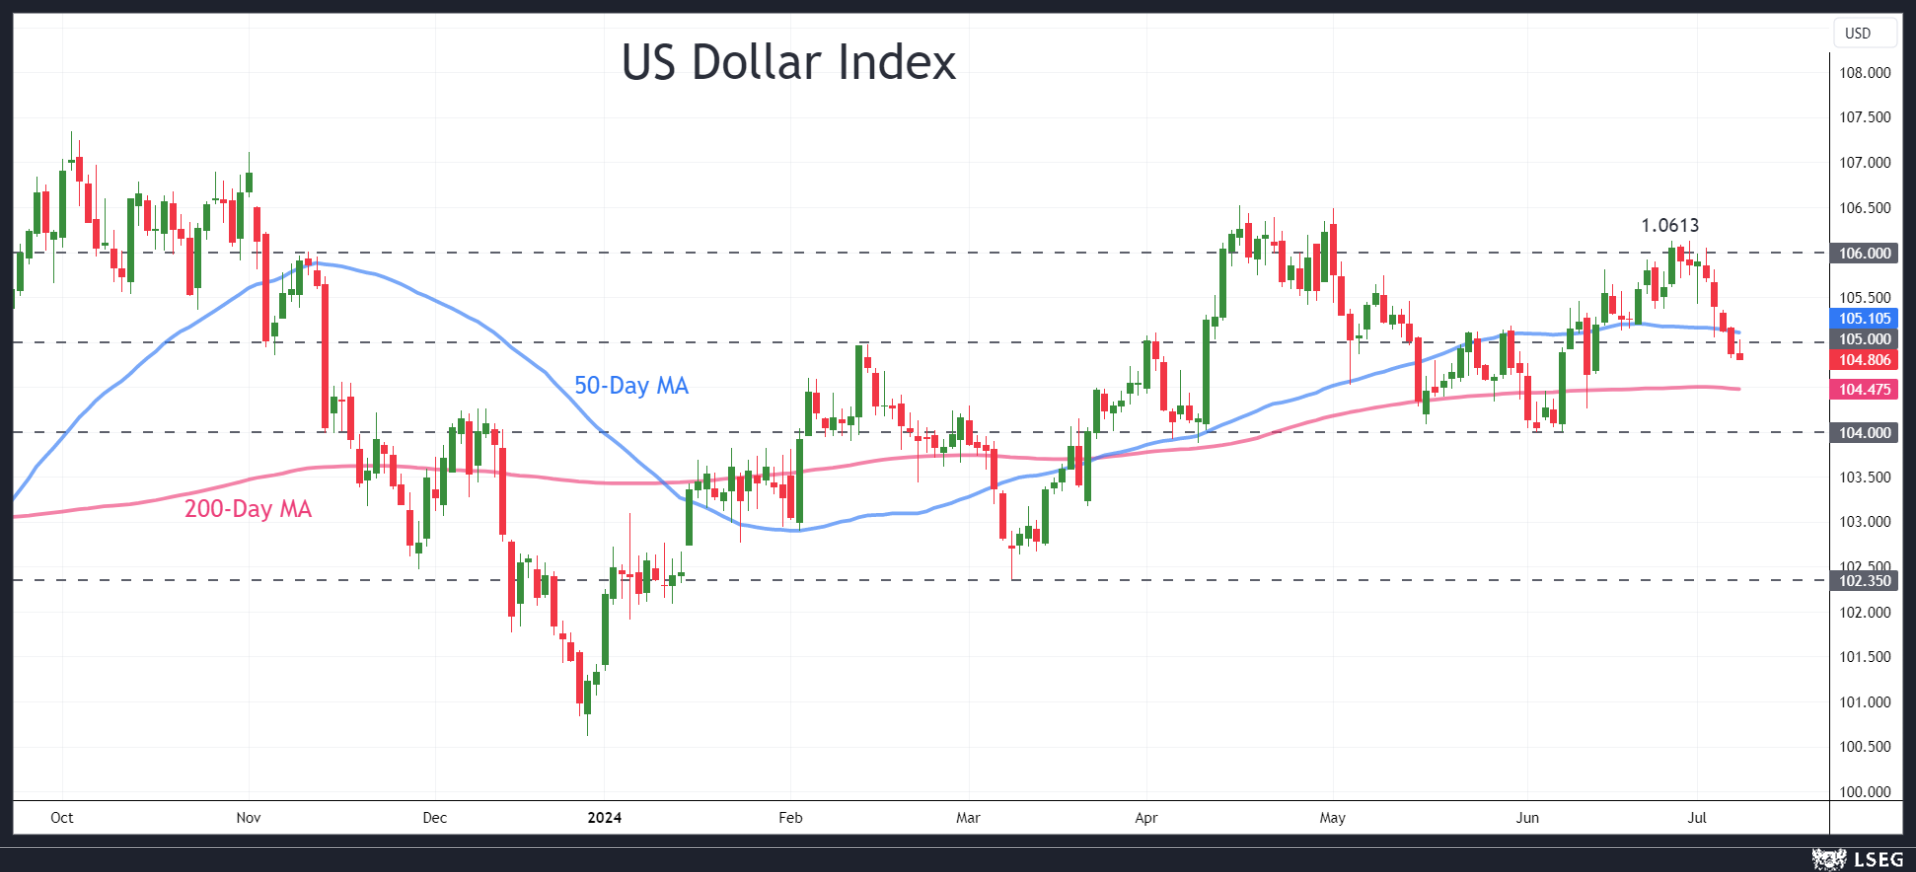
However, if Powell fails to offer any new clues on the possible timing of a rate cut or there’s an upside surprise in one or more of the CPI readings, the dollar index could crawl back above the 105.00 level to reclaim the 50-day MA. Higher up, the next challenge would be the June peak of 106.13.
On the whole, all the signs are that the US economy is losing stead, which bodes well for the odds of a September rate cut. The problem for dollar bears is the possibility of a second Trump presidency, which may limit the downside for Treasury yields.
USDJPY Finds Strong Support at Key Fibo Zone
- USDJPY hits key Fibo retracement level
- But momentum indicators still point to weakness
- A break above 161.35 could pave the way towards 161.65
- A slide below 160.35 may invite more bears
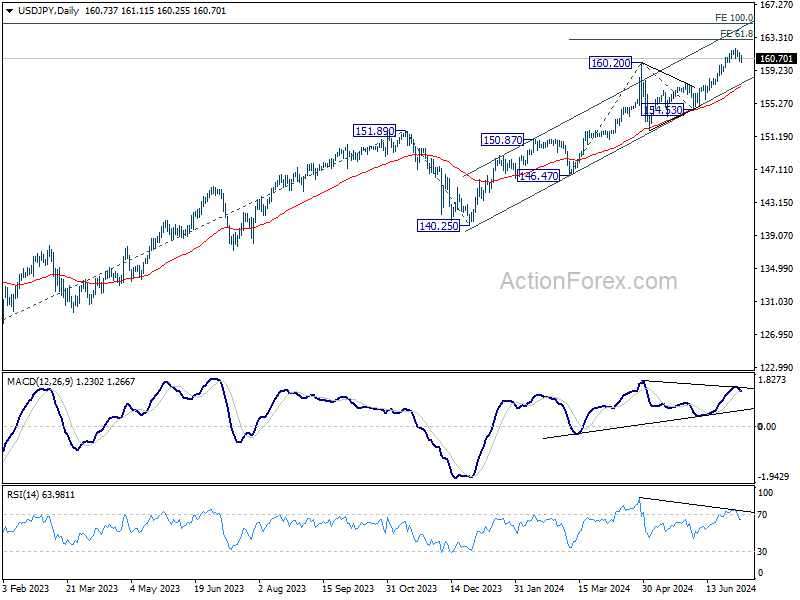
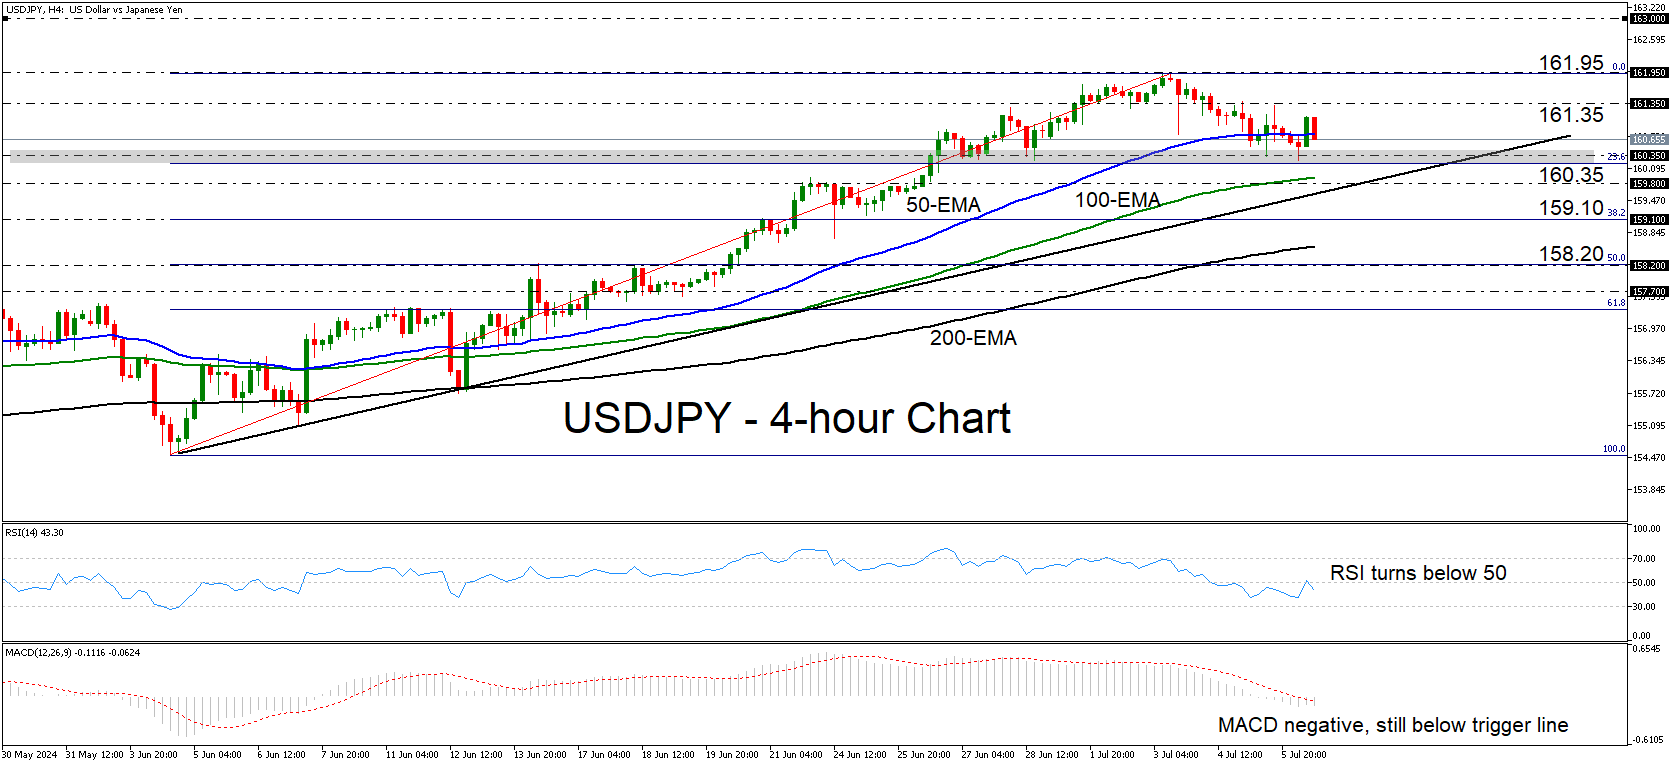
USDJPY traded higher today after it triggered some buy orders near the 160.35 barrier and the 23.6% Fibonacci retracement level of the short-term uptrend that began back on June 4. That said, although the pair is still trading above the trendline drawn from the low of that day, some resistance zone must be broken for the uptrend to resume.
Both the RSI and the MACD corroborate the view that it is too early to start examining a trend continuation. The former has turned back below its 50 line, while the latter, although it is showing signs of bottoming, remains below both its zero and trigger lines.
If the bulls are willing to recharge and take the pair above the 161.35 zone, then they may be tempted to test the 161.95 area, marked by the high of July 3. A break higher would take the action into territories last tested back in December 1986 and may encourage advances towards the 163.00 zone, or the psychological area of 165.00.
On the downside, a dip below the crossroads of the aforementioned trendline and the 160.35 level may encourage the bears to add to their positions. A first support may be offered by the 38.2% Fibo level at 159.10, the break of which could allow declines towards the 50% retracement zone at around 158.20.
To sum up, USDJPY hit support at a key Fibonacci retracement level of a prevailing uptrend. However, it is too early to call for a trend resumption as several key resistance zones need to be breached.
Sunset Market Commentary
Markets
Yesterday’s second round in the French parliamentary elections resulted in a hung parliament, be it in a totally different setup than polls suggested. Le Pen’s Rassemblement National (RN) unexpectedly finished third, securing 143 seats. Macron’s centrists (159) and the leftist front (NFP, 180) ended second and first respectively. The outcome initially triggered some OAT underperformance. We’d tie that to an overall increased risk of additional government spending. Markets were indeed positioned for a political gridlock, but one with the RN as the biggest party possibly delivering the new prime minister. That’s important as RN had previously reassured markets and businesses to more or less abide by the European budget rules. The Mélenchon-led NFP’s high-tax, high-spending manifesto couldn’t be more different. Anyway, it quickly dawned that any NFP-led coalition government seems unlikely in the short (or even medium) run. Chances are president Macron will install a caretaker PM until new elections can be called in one year from now. With both extremes unable to seize power, the political event risk in Europe is gone for the time being. French yields drop between 1 and 4 bps with the downleg extending in early US dealings. German rates add <2 bps at the front while shedding a similar amount at the back-end. Net daily changes in US yields are marginally in the plus. Investors await the publication of Thursday’s CPI numbers (June) as well as Fed-chair Powell’s semiannual testimony before Congress (tomorrow and Wednesday). These are some of the final catalysts to guide trading before a long summer lull kicks in until the Jackson Hole Symposium (August 22-24). Stocks trend north. The EuroStoxx50 (+0.4%) tests the 5k barrier & Wall Street opens with minor gains to extend a record rally. The common currency breaks away after having been under the political yoke for these last few weeks. EUR/USD (nearing 1.085) rises to the highest level since the European elections. The trade-weighted dollar index drops for a fifth day straight (104.81). Sterling continues to get a solid bid, gaining against all G10 peers. EUR/GBP erased previous gains to trade virtually unchanged around 0.844. Cable (GBP/USD) is preparing for a close at the strongest level since mid-March.
News & Views
The People’s Bank of China today announced that it will start conducting new bond repurchases and reverse repo operations as it aims to make open market operations more efficient and at the same ensuring sufficient liquidity in the banking system. De facto, the bond operations will be conducted at the end of the day on an ad hoc basis as needed. The transactions will be on an overnight maturity and rates will be set at 20 bps below and 50 bps above the seven day repo rate. The PBOC didn’t give any indication on the frequency of the new operations. The new framework also is seen as an indication that the 7-day repo rate is becoming an ever important reference from PBOC policy (de facto main policy rate).
Industrial production in the Czech Republic declined 2.2% M/M in real terms in May, Czech Statistical Office (CSO) data showed today. Production was 3.2% lower Y/Y. CSO commented that ‘The decrease of industrial production in May was influenced the most by manufacture of motor vehicles, trailers and semi-trailers, in which this year’s, for the time being, weakest month met with a higher comparison basis’. Manufacturing production overall declined by 4.0% Y/Y. On the positive side production of food products (4.4%), beverages (8.4%) and electricity and gas production (7.0%) even as the latter was mainly due to a lower comparison base. Aside from the production data, CSO reported new orders to have increased 0.8% Y/Y in May, with the dynamics applying both to non-domestic and domestic orders. The average number of employees in industry decreased by 2.0% Y/Y in May. A separate report also showed further contraction in the Czech construction sector. Construction output decreased 5.1% M/M to be 6.8% lower Y/Y. The approximate value of permitted constructions decreased by 9.2%. The number of started dwellings dropped 18.2% Y/Y. The number of completed dwellings decreased by 2.1% Y/Y. The Czech koruna eased slightly today with EUR/CZK trading near 25.16.
Graphs
EUR/HUF: forint underperforms regional peers as government floats new and/or increased “special taxes” to plug the budget deficit
French 10-yr yield drops to lowest level since end-June as second round prevents extremes from seizing power
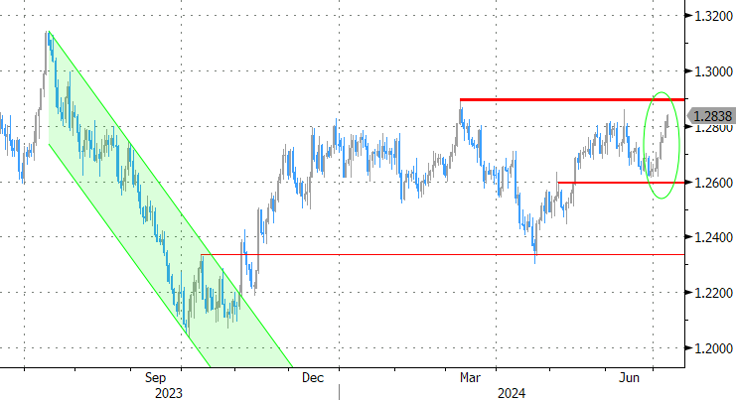
GBP/USD: resilient sterling on track for strongest close since mid-March
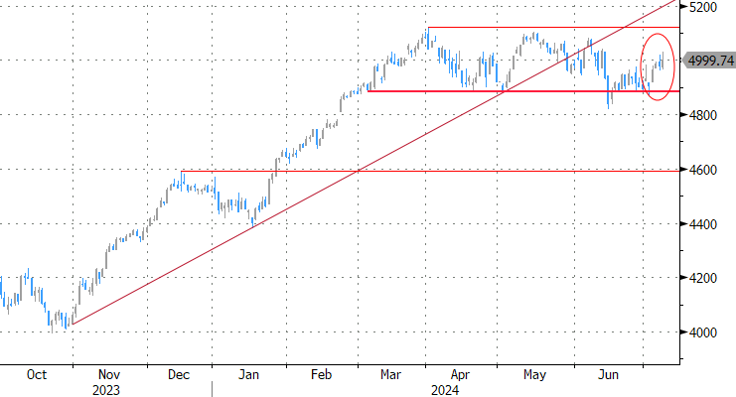
EuroStoxx50 test 5k barrier against mildly constructive background
EUR/USD Mid-Day Outlook
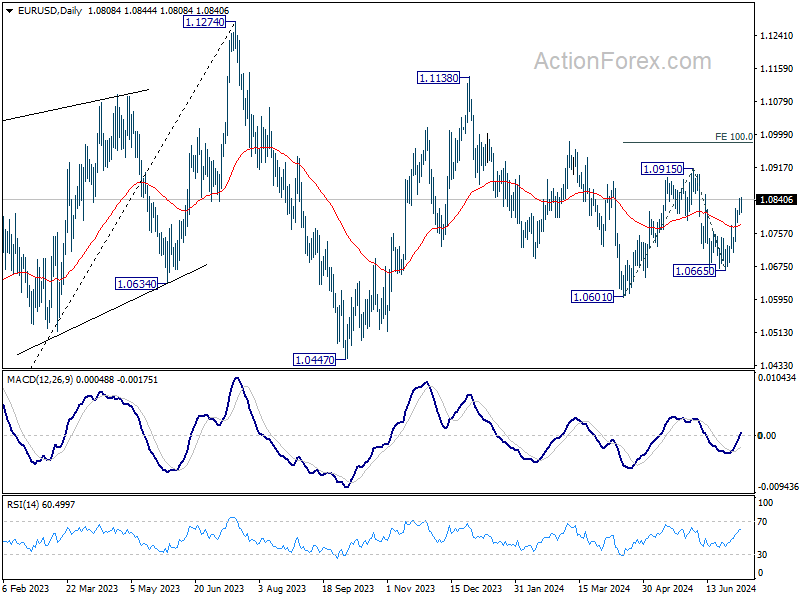
Daily Pivots: (S1) 1.0813; (P) 1.0827; (R1) 1.0854; More....
Intraday bias in EUR/USD remains on the upside, as rise from 1.0665 is in progress for retesting 1.0915 resistance. Firm break there will target 100% projection of 1.0601 to 1.0915 from 1.0665 at 1.0919 next. On the downside, below 1.0802 minor support will turn intraday bias neutral first.
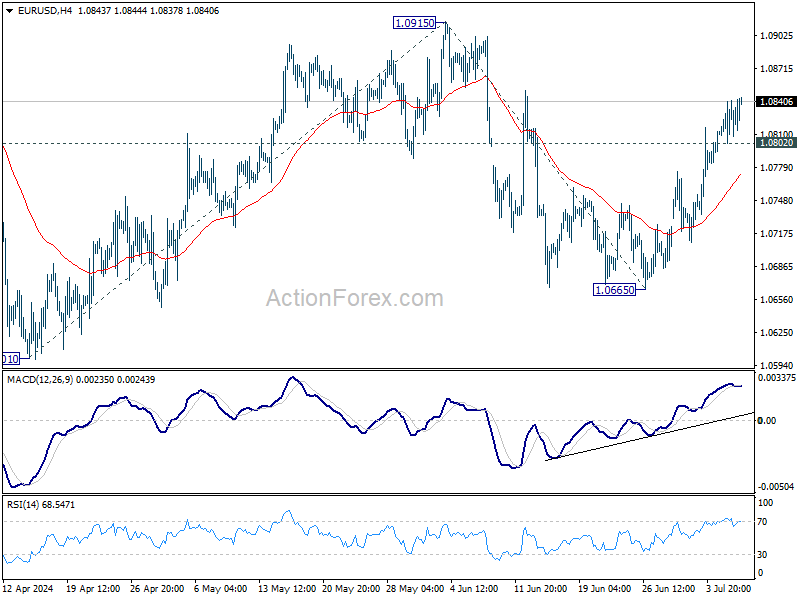
In the bigger picture, price actions from 1.1274 are viewed as a corrective pattern that's still in progress. Break of 1.0601 will target 1.0447 support and possibly below. On the upside, firm break of 1.0915 resistance will start another rising leg back to 1.1138 resistance instead.
USD/CHF Mid-Day Outlook
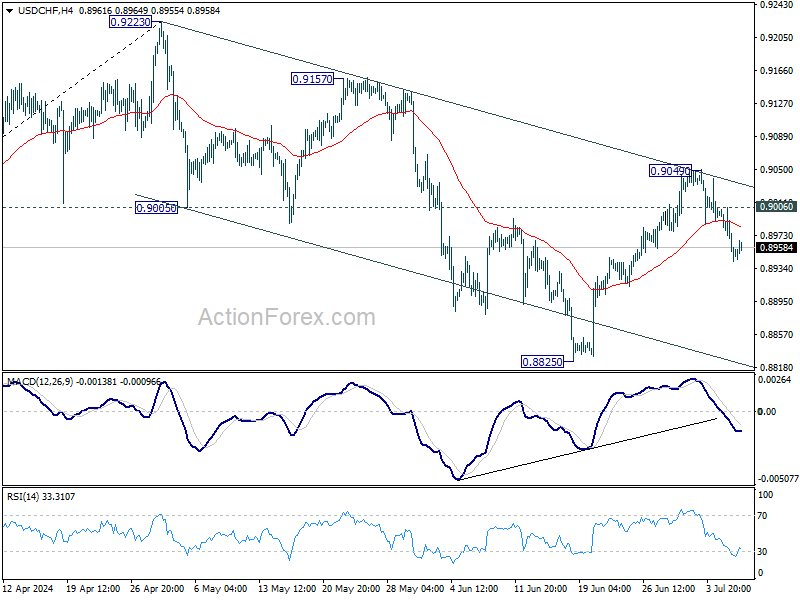
Daily Pivots: (S1) 0.8939; (P) 0.8973; (R1) 0.8992; More…
Intraday bias in USD/CHF remains on the downside for the moment. Rebound from 0.8825 could have completed at 0.9049, after rejection by falling channel resistance. Also, fall from 0.9223 is not completed yet. Deeper decline would be seen for retesting 0.8825 low next. On the upside, above 0.9006 minor resistance will turn intraday bias neutral first.
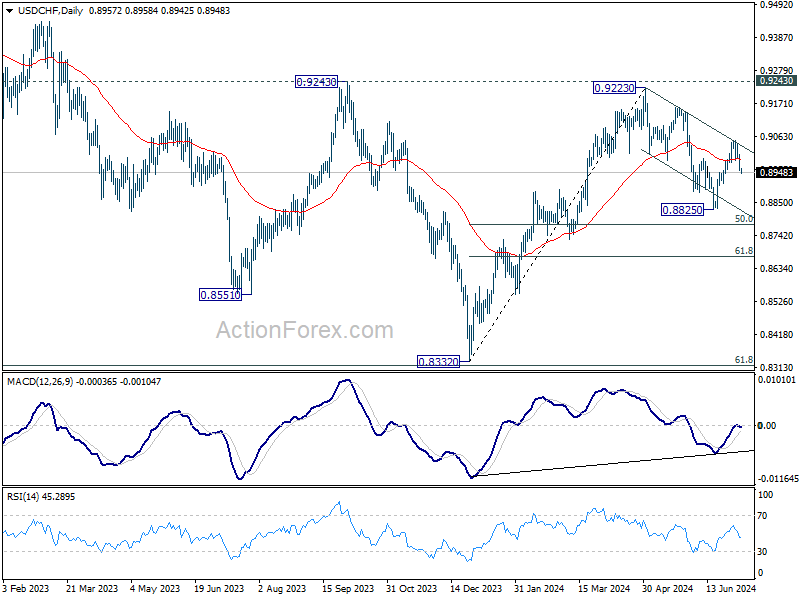
In the bigger picture, focus remains on 0.9223/9243 resistance zone. Decisive break there would suggest larger bullish trend reversal and turn outlook bullish. Nevertheless, rejection by 0.9223/43 will keep medium term outlook neutral at best, for more range trading between 0.8332/9243 first.
USD/JPY Mid-Day Outlook
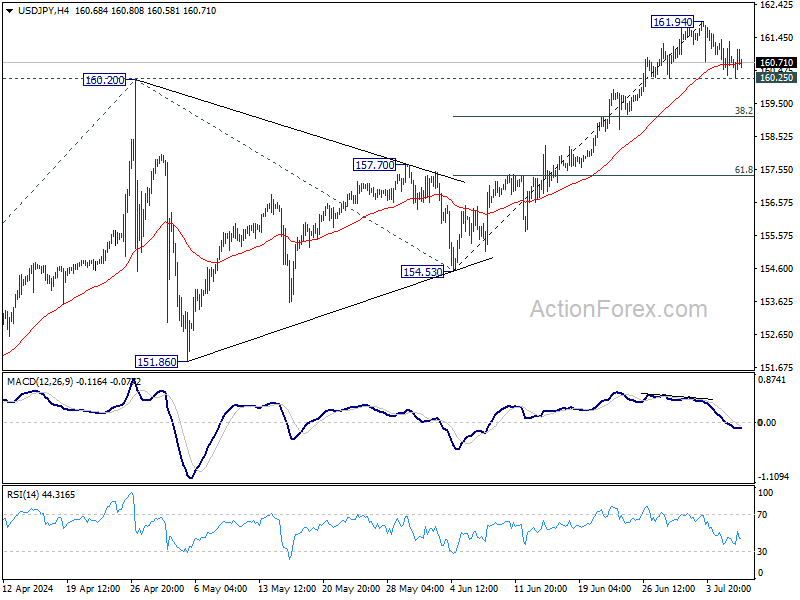
Daily Pivots: (S1) 160.28; (P) 160.84; (R1) 161.35; More...
Range trading continues in USD/JPY and intraday bias stays neutral. Further rally is expected with 160.25 minor support intact. On the upside, break of 161.94 temporary top will resume larger up trend to 61.8% projection of 146.47 to 160.20 from 154.53 at 163.01. Nevertheless, break of 160.25 will turn bias to the downside for deeper pullback.
In the bigger picture, long term up trend is still in progress. Further rise is expected as long as 154.53 support holds. Next target is 100% projection of 127.20 (2023 low) to 151.89 (2023 high) from 140.25 at 164.94.