Sample Category Title
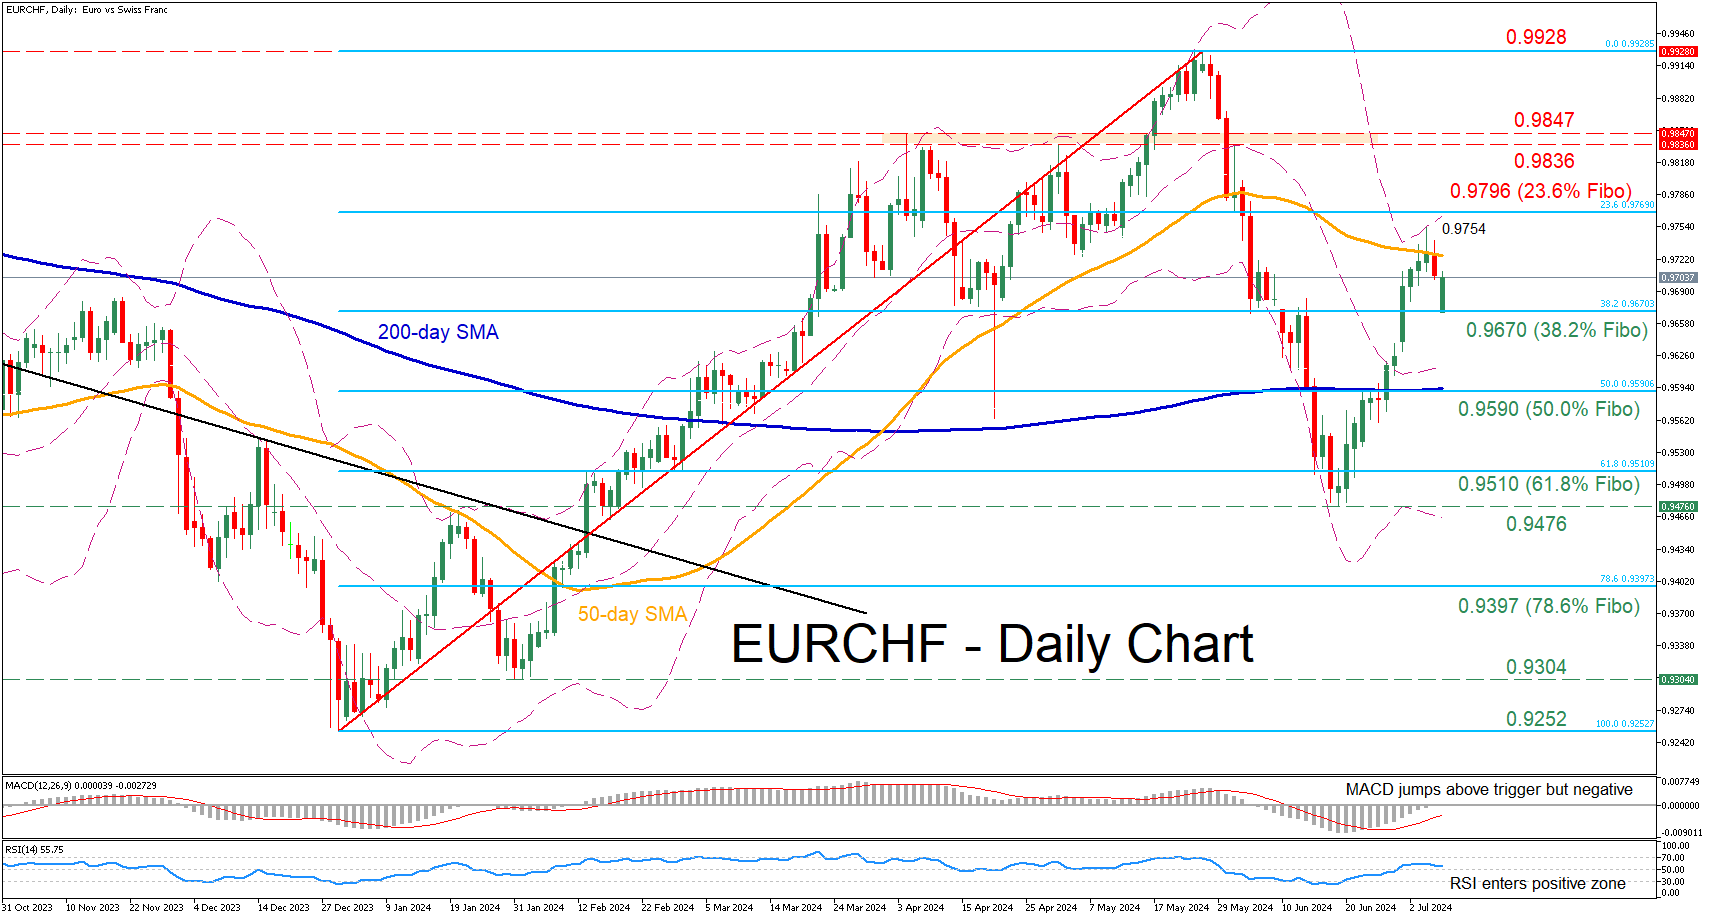
EURCHF Gets Rejected at 50-day SMA
- EURCHF was rebounding strongly from 4-month low
- But its advance came to a halt at the 50-day SMA
- Oscillators are cautiouslytilted to the bullish side
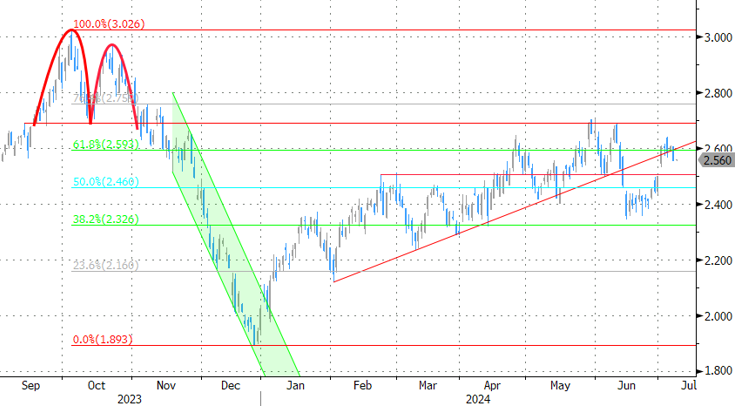
EURCHF has been in a steep recovery since mid-June, attempting to erase the aggresive slide from its 2024 peak. However, the rebound seems to have been on hold in the past couple of sessions after the 50-day simple moving average (SMA) prevented further advances.
Should that rejection trigger a pullback, initial support could be found at 0.9670, which is the 38.2% Fibonacci retracement of the 0.9252-0.9928 upleg. Lower, the pair’s retreat could pause at the 50.0% Fibo of 0.9590, which overlaps with the 200-day SMA. Should that barricade also fail, additional support could be found at the 61.8% Fibo of 0.9510.
On the flipside, if the price manages to claim the 50-day SMA, the recent rejection region of 0.9764 could prove to be a tough barricade for the bulls. Further upside attempts could meet resistance at the 23.6% Fibo of 0.9796. In case of an upside violation, attention could shift to the 0.9836-0.9847 range defined by the May resistance zone and the April peak.
Overall, EURCHF’s recovery seems to be jeopardized after its rejection at the 50-day SMA. However, the momentum indicators remain tilted to the upside, suggesting that the bulls have not yet surrendered.
GBP/USD Price Outlook: Cable Holds the High Ground, Multi-Month Resistance Up Ahead
- GBP/USD is facing a key multi-month resistance level at 1.2850 after a positive run.
- The outcome of US inflation data and Fed Chair Powell’s testimony could significantly impact the GBP/USD exchange rate.
- A break above 1.2850 might require a catalyst, like a substantial drop in US inflation, while support levels are identified at 1.2750 and below.
GBP/USD opened slightly lower last night due to the unexpected results from the French elections. This resulted in the US Dollar receiving a safe haven bid, with Friday’s USD shorts potentially covering their positions also playing a role. As a result, the US Dollar experienced temporary strength at the start of the week.
However, GBP/USD has since risen back to where it ended last week, just above the 1.2800 level, with a key multi-month resistance level ahead.
The positive momentum for GBP/USD following the UK elections appears likely to continue, bolstered by renewed optimism over potential rate cuts from the US Federal Reserve, which is weighing on the US dollar.
Interestingly, market participants are now pricing in a rate cut from the Bank of England at the August 1 meeting, after inflation returned to the Central Bank’s 2% target. The probability of a rate cut being priced is at 62.8% for the August 1 meeting and has increased substantially over the past week.
UK Interest Rate Probability
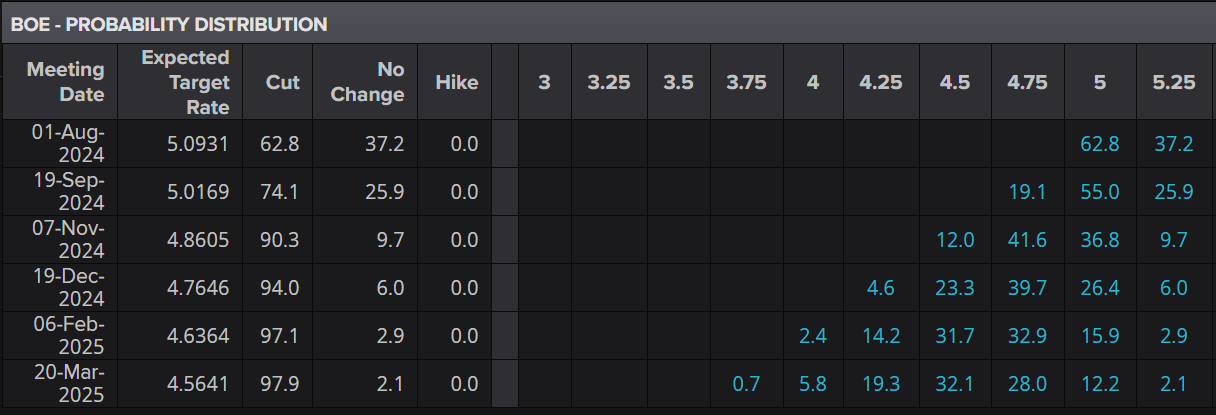
Source: LSEG
US Inflation Data Dominates
Looking ahead to the rest of the week, economic data is sparse from the UK with all eyes focused on incoming Prime Minister Keir Starmer and his new Finance Minister Rachel Reeves.
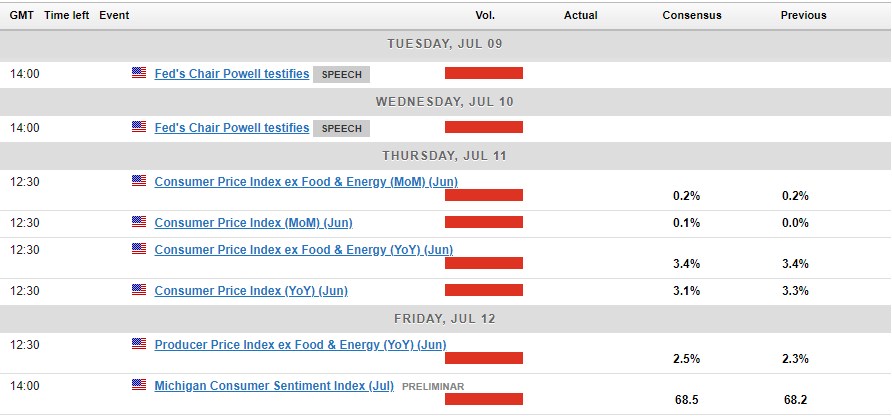
The US and market participants across the globe will have their gaze fixated on US inflation data released later in the week. Following the recent batch of data from the US which showed signs of weakness, the CPI print is significant. A drop off in inflation could lead to more aggressive pricing by market participants on the rate cut front which in theory could send the US Dollar tumbling.
There are also two days of testimony before congress from Fed Chair Jerome Powell. It is likely that the Fed Chair will face tough questions on the economy and his remarks could stoke some swings and volatility which are likely to be short-term in nature.
Technical Analysis on GBP/USD
Cable is on a 7 day winning streak rising from lows around the 1.2600 handle to trade above the 1.2800 handle. The advance may come under pressure as the multi month resistance level at 1.2850 may prove too big of a hurdle.
The 1.2850 handle has held since July 2023, with two unsuccessful attempts to break this level recorded in March and mid-June 2024. The selling pressure at this handle is evident and given the fundamental backdrop, this could remain a concern.
A break of the 1.2850 may need a catalyst, one like a significant drop off in the inflation print due later this week. This could be the type of change needed at a fundamental level to support a breakout and push toward the 130.00 handle.
Conversely, a pullback from here faces support at the 1.2750 handle before 1.2680, 1.2600 and the 1.2500 psychological level come into focus.
GBP/USD Daily Chart, July 5, 2024
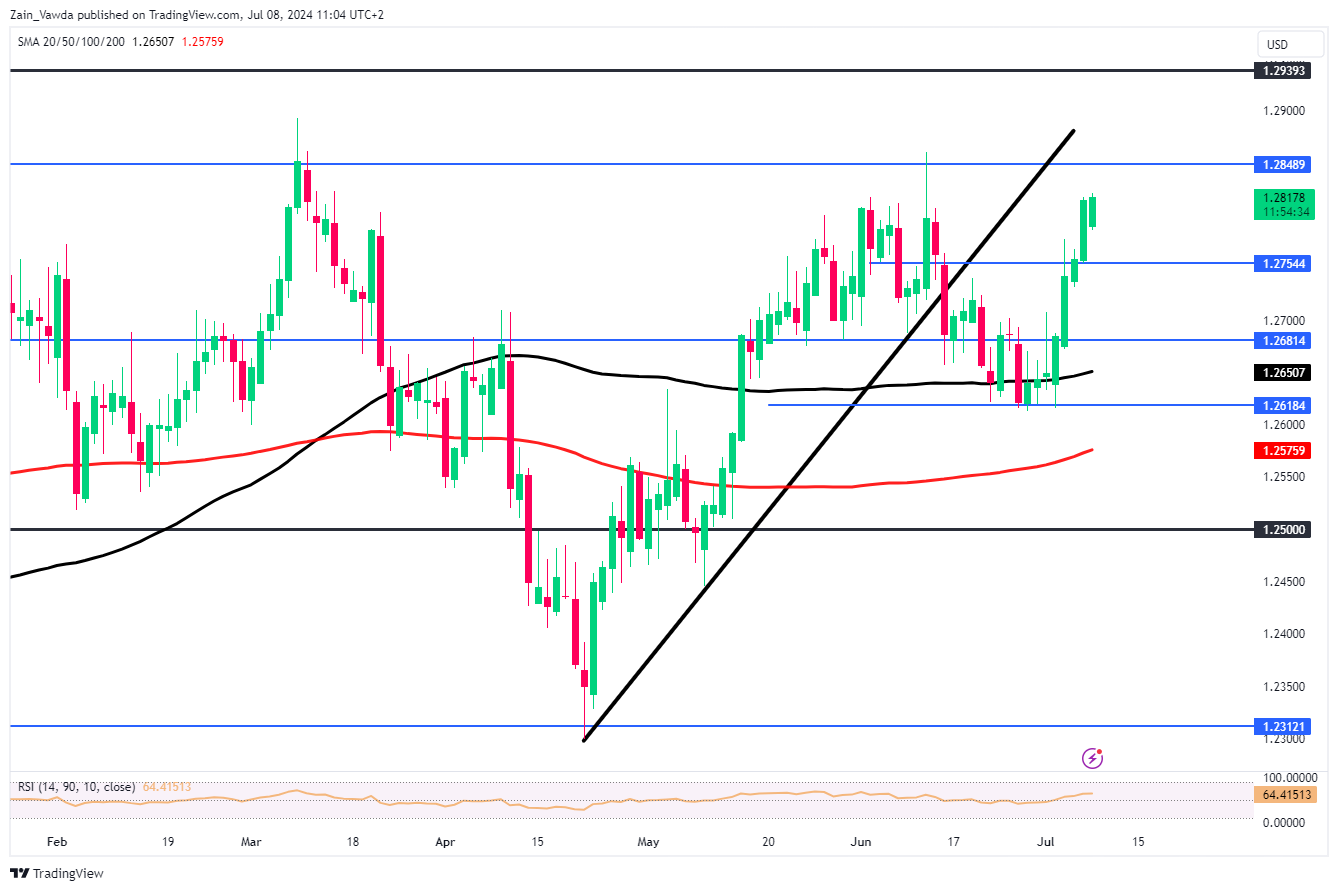
Source: TradingView.com (click to enlarge)
Eurozone Sentix drops sharply to -7.3 on rising political and economic uncertainties
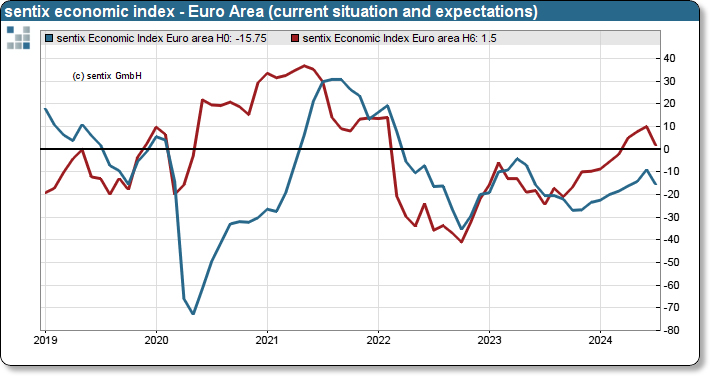
Eurozone Sentix Investor Confidence dropped sharply in July, falling from 0.3 to -7.3, significantly worse than the expected 0.0. This decline ends a series of eight consecutive rises and marks a severe setback. Current Situation Index also declined from -9.0 to -15.8, while Expectations Index fell from 10.0 to 1.5.
Sentix highlighted that investors are increasingly concerned not just about the French elections but also about upcoming state elections in Germany. Moreover, growing worries about the health of the incumbent US president and the uncertainty surrounding who will run against Donald Trump in the next presidential election are adding to the overall anxiety. This uncertainty is creating a vacuum, compounded by the slowdown in the US economy, which is beginning to affect the rest of the world.
Given this "first mover" trend in the Eurozone, ECB is likely to consider further interest rate cuts. Investors anticipate that ECB will shift its focus more towards addressing economic weaknesses, particularly as the Sentix thematic barometer on "Inflation" signals an easing of inflationary pressures.
EUR/USD Outlook: Bullish Bias Above Daily Cloud
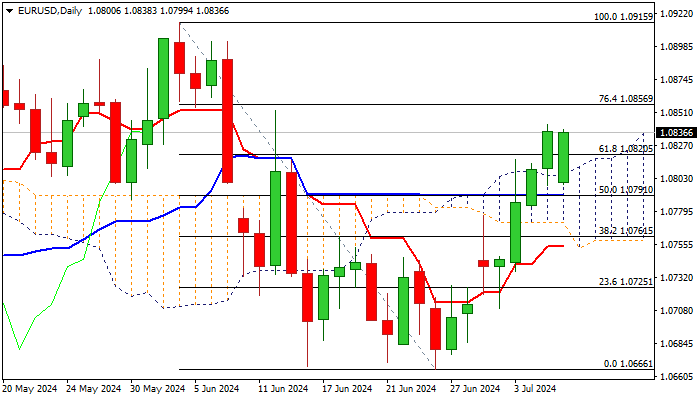
EURUSD opened with gap-lower on Monday but dip was short-lived and larger bulls regained control and pushed the price towards last Friday’s new multi-week high (1.0842).
Today’s dip was contained by psychological 1.0800 support (also the top of rising hourly cloud) with subsequent move higher emerging above the top of daily Ichimoku cloud after a shallow penetration.
Near-term bias is expected to remain with bulls as long as the price holds above daily cloud, with repeated daily close above broken Fibo level at 1.0820 (61.8% of 1.0915/1.0666) to reinforce positive near-term outlook.
Last week’s almost 0.9% advance also contributes to developing signals, as daily studies are bullish however, overbought conditions may obstruct bulls and keep the price in prolonged consolidation.
On the other hand, fundamentals are not so bright, as recent economic data showed that performance in bloc’s core industrial sector is still slow (particularly in Germany (EU’s largest economy) which may prompt the ECB to cut rates sooner or more than expected, which would be a negative signal for euro.
Res: 1.0842; 1.0856; 1.0900; 1.0919.
Sup: 1.0820; 1.0800; 1.0777; 1.0756.
Crypto: Bears Trying to Break the Neck of Bull Trend
Market Picture
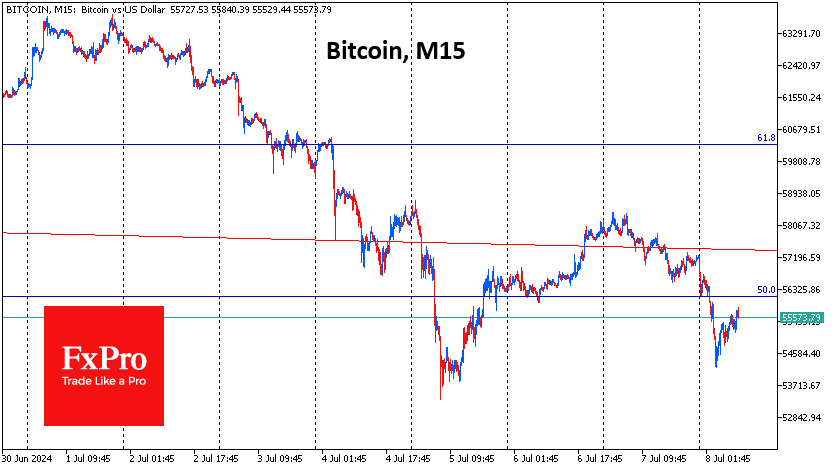
The cryptocurrency market is moving up and down, experiencing increased volatility with swings between 2.0 and 2.15 trillion. These are very intense swings, reflecting the massive amounts of capital flowing through the market. The Cryptocurrency Fear and Greed Index is at 28 (fear), and on Saturday, it fell to 26, its lowest level since January 2023.
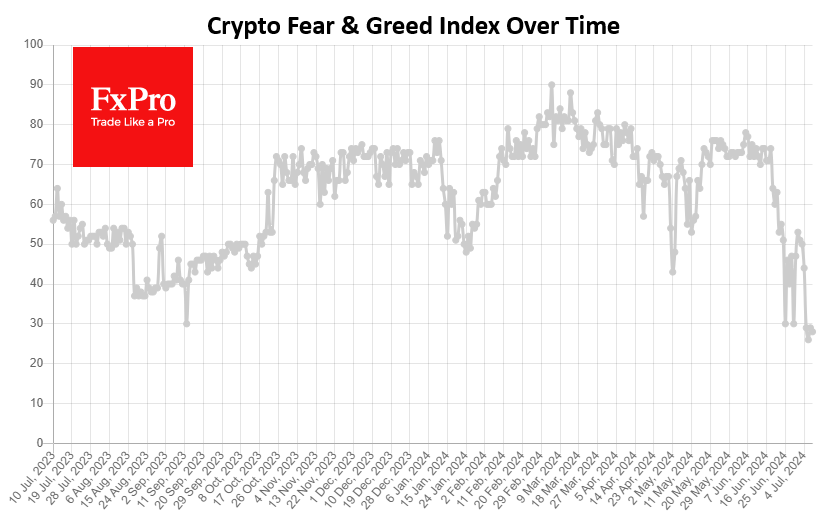
On Bitcoin’s intraday timeframe, it’s easy to see how strong downward momentum is being replaced by longer recovery periods. But for now, the balance of power is with the bears, who on Friday and Sunday unleashed a hefty portion of off-target gains as the price reached the $58.3K level—the level of the 200-day moving average. This is a clear attempt to reverse the bullish trend since January 2023, which is in line with the dynamics of the Cryptocurrency Fear and Greed Index.
Santiment noted that the crypto market is under pressure from negative news, and social media is at its highest level of fear, uncertainty, and doubt. Analysts believe that now is an opportune time for traders willing to take risks and buy cryptocurrencies while the market is down and frustrated.
In another recalculation, the difficulty of mining Bitcoin fell by a notable 5% to 79.5T. According to Glassnode, the smoothed 7-day moving average hash rate fell to 580 EH/s, down 11.5% from the May high of 656 EH/s.
News background
The MtGox trustee, who went bankrupt in 2014, announced plans in July for a gradual refund of 137,000 BTC to the platform’s customers. Arkham celebrated the transfer of 47,228.7 BTC (~$2.71 billion) from the exchange’s cold storage to a new address. Nobuyaki Kobayashi confirmed that some payments in Bitcoin and Bitcoin Cash have been honoured.
Notcoin (NOT) soared by 50% over the weekend, fuelled by a massive coin burn. On Wednesday, Notcoin also announced the launch of a new project with the well-known analytics platform Helika. It aims to develop the ecosystem of cryptocurrency games in Telegram.
Bitcoin sales by German and US authorities are also putting pressure on BTC. In recent weeks, German authorities have sold the first cryptocurrency for a total of $195 million through various exchanges. The German parliament has criticised the German authorities for selling bitcoins.
The actions of the bitcoin whales are exacerbating the asset’s fall. After “Sleeping” for more than ten years, the wallet moved 1,004 BTC worth $57 million to a new address, pointed out ‘Spot On Chain’. Since 27 June, two wallets have moved 9,301 BTC (about $563 million) to the Binance, according to Lookonchain.
China’s Problems Could Cloud RBA’s Hawkish Intentions
- China to gain more airtime this week
- The ailing housing sector and the bond rally in focus
- RBA remains hawkish, but consumer appetite is critical
- Aussie benefits from dollar weakness
Market’s focus could turn to China this week
The post non-farm payrolls week tends to be a quiet one as the market digests the latest developments and prepares for the next risk events. Accordingly, the calendar is less impressive this week apart from Fed Chairman Powell's testimony on Tuesday and Thursday’s US CPI release. This means that the market could have time to focus on countries away from the spotlight, for example China.
China’s main issue remains the housing sector. Supply destocking is progressing very slowly with the housing price index dropping to the lowest level since July 2015. The strong set of measures announced in May 2024 has yet to make an impact, which raises the possibility for further action from the Chinese authorities.
Communist Party’s plenary session on July 15-18 could hold surprises
Actually, the third plenary session of the 20th Communist Party of China (CPC) Central Committee will be held on July 15-18, with the usual issues being on the agenda. Boosting domestic demand appears to be the primary target of this session with developments in the housing sector also to be discussed. The market is speculating that further support measures could be announced during the plenary.
In the meantime, there appears to be a storm brewing in the bond market. Sovereign bond yields have been dropping aggressively as demand for safe assets has been increasing from (a) investors preparing for another stock market crash, and (b) commercial banks trying to safely invest their spare reserves as borrowing slows down. The PBoC has announced its willingness to intervene forcefully in the market, but the real solution would probably be to act upon China's underlying economic issues. This makes the upcoming plenary session even more important.
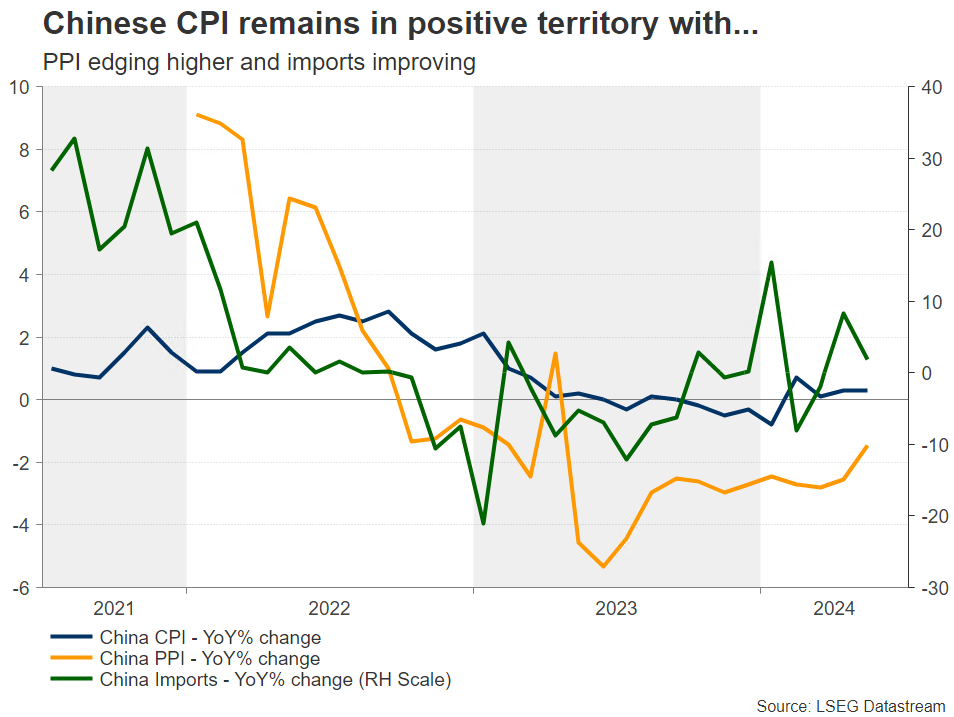 Amidst these developments and following a rather mixed set of public and private PMI surveys, the inflation report for June will be published on Wednesday with the key trade balance data following towards the end of the week. CPI has been edging higher lately, and combined with the recent uptick demand for imports, one could argue that there are some tentative signs of improving domestic demand.
RBA remains hawkish
Not far from the Chinese shores, the RBA remains one of the most hawkish central banks. The June 19 meeting kept the door open to a rate cut down the line if data supports it. And considering the data released since then, the door remains firmly open as the labour market remains tight and the May CPI jumped to 4%. However, consumer appetite remains the big question mark going forward, especially as the housing market continues to show signs of weakness on the back of heightened interest rates.
Focus on inflation-related prints ahead of end-July official CPI report
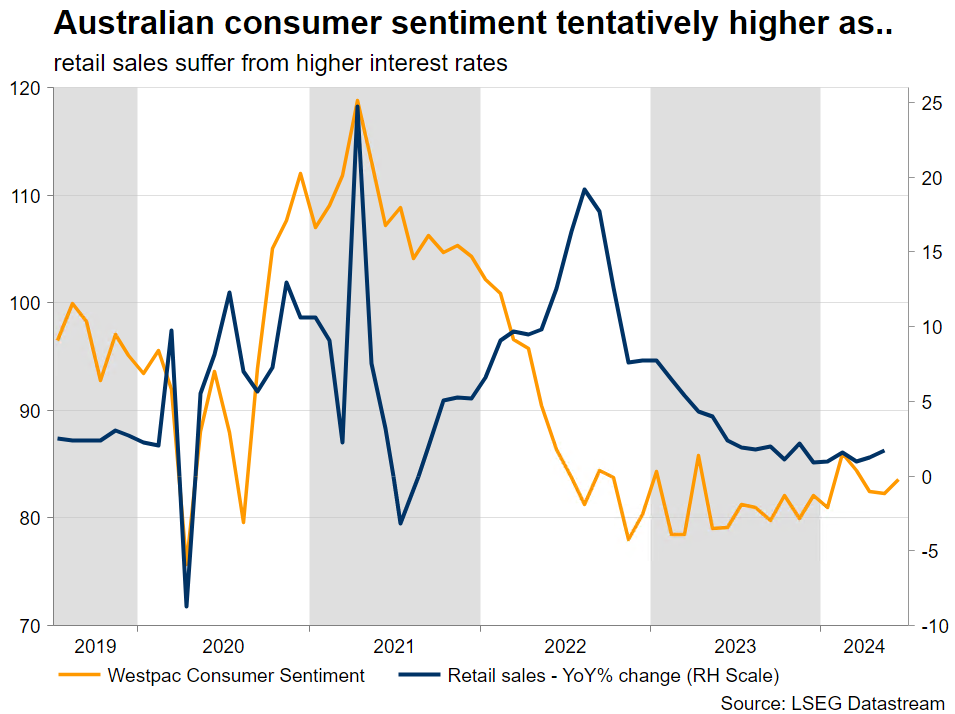
Following the recently disappointing PMI surveys, there are some interesting data releases this week such as the Westpac consumer confidence indicator and the consumer inflation expectations index. The latter is especially critical for the RBA as it jumped to 4.4% in June and, despite the downward trend that has been in place since June 2022, progress has been very slow lately.
This mirrors the inflation stickiness seen across the developed countries, which is the main reason for the Fed postponing its much-expected rate cuts. The market understands that the crucial number for the RBA is the July inflation report for the second quarter of 2024 released at the end of July. Considering the various inflation indicators, predominantly the May and June monthly inflation prints, there is a strong possibility for an upside surprise on July 31. Confirmation of such an outcome could unlock the rate hike for the RBA, making the August 6 meeting live.
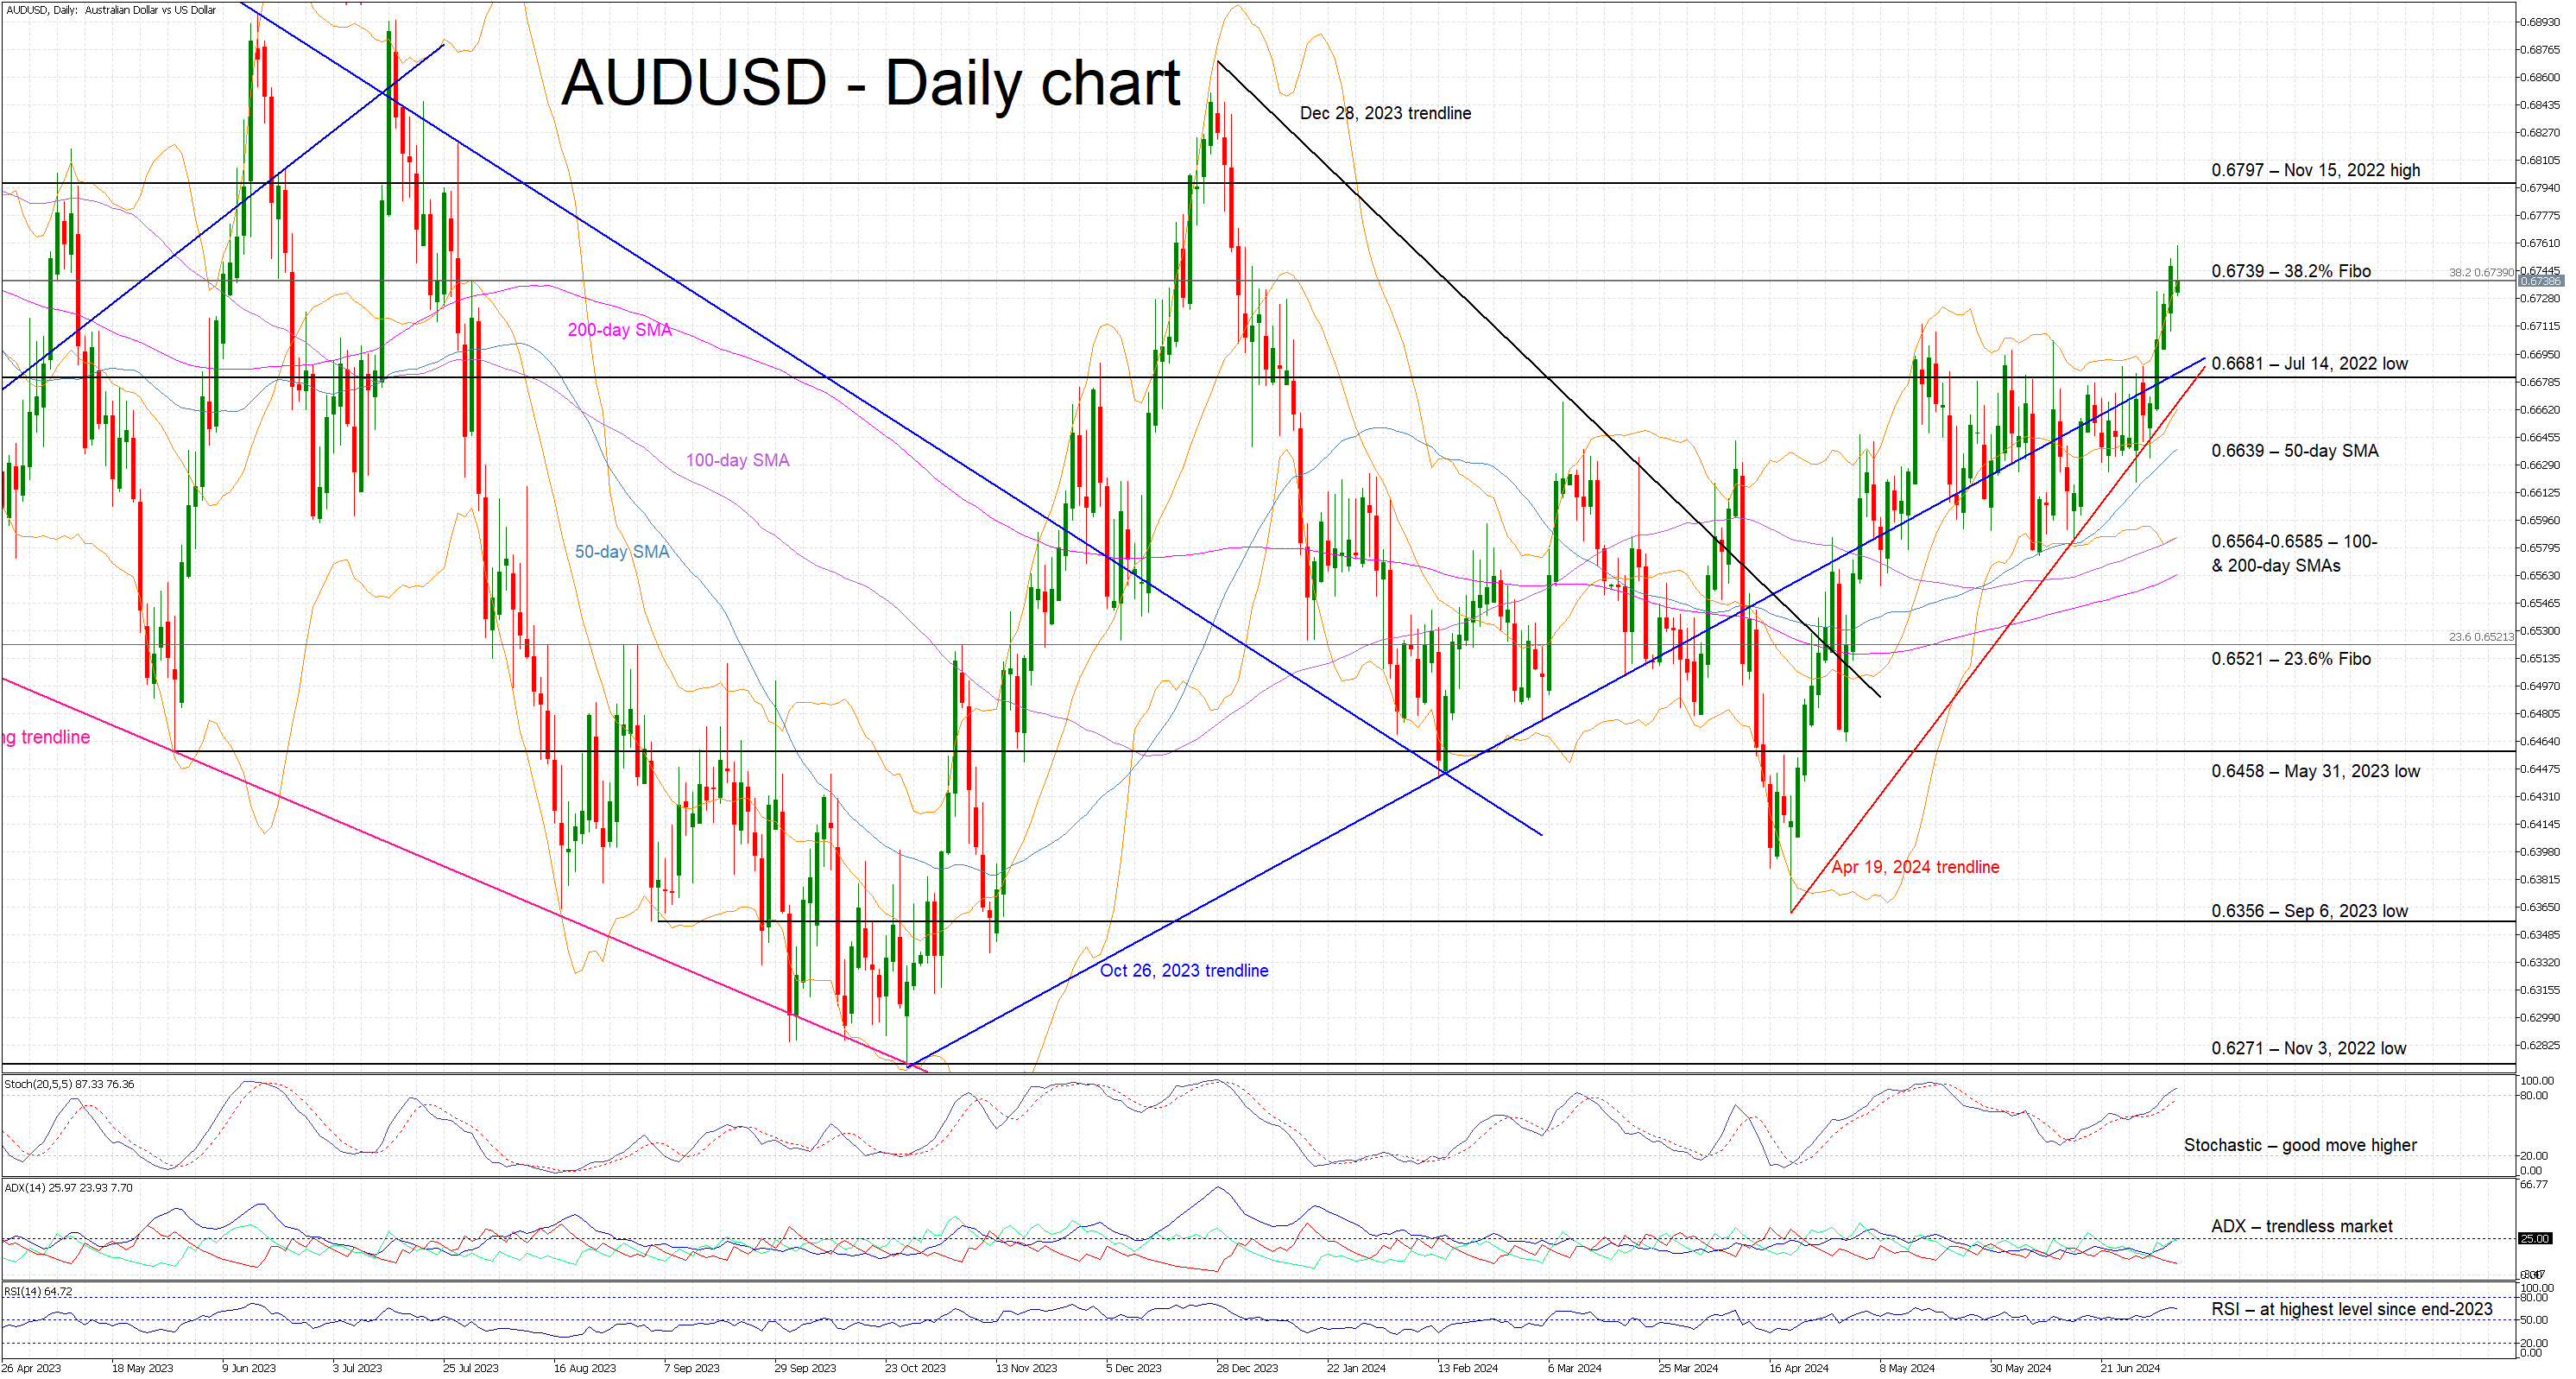
Aussie/dollar tests 2024 highs
The aussie/US dollar pair has managed to forcefully break above the 0.6681 level, which has been acting as strong resistance over the past two months. Last week’s weak US labour market data, the revitalized expectations for a September Fed rate cut and the continued hawkishness of the RBA has allowed the aussie to take advantage of widespread dollar weakness. A strong set of Chinese and Australian data could boost the pair further, but only a dovish appearance from Chairman Powell and a weak US CPI print could unlock a rally towards the end-2023 highs.
BoJ highlights spread of big firm wage hikes to smaller companies
In the Regional Economic Report, BoJ maintained its economic assessment for five out of Japan's nine regions, while upgrading two and downgrading two. Eight regions, with the exception of Hokuriku, indicated that their economies had been recovering moderately, picking up, or picking up moderately, although some weakness was noted in certain areas.
"Many regions reported that big firms' big pay hikes in this year's wage negotiations were spreading to small and medium-sized companies," BoJ noted. This suggests a positive spillover effect from large corporations to smaller businesses.
BOJ also noted that consumption was "firm as a whole," driven by robust spending from inbound tourists. This strong tourist spending is helping to offset softer consumption among households affected by rising living costs.
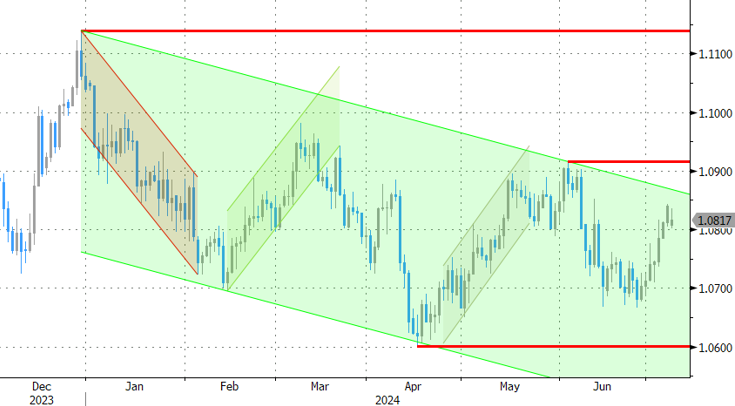
EURUSD Jumps Above 200-day SMA
- EURUSD advances after violation of restrictive trendline
- Reclaims both 50- and 200-day SMAs
- Oscillators suggest that bullish forces are strengthening
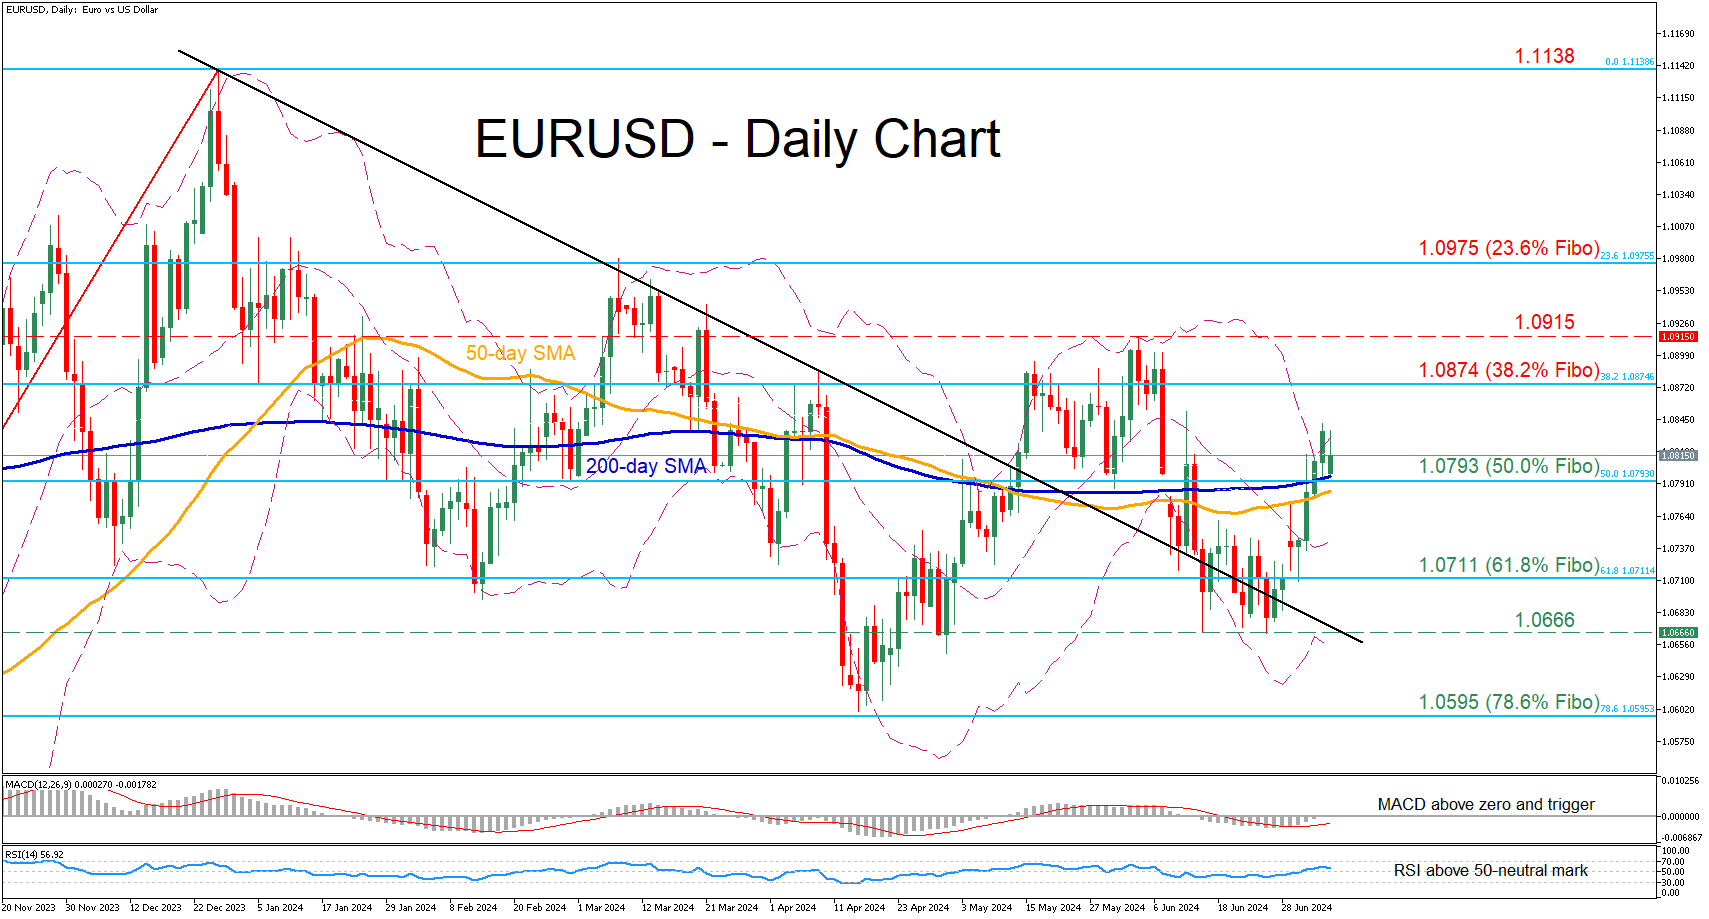
EURUSD has been attempting a recovery from its one-month low of 1.0666, with the price crossing above the downward sloping trendline in place since December 2023. After some volatile sessions, the pair managed to conquer both its 50- and 200-day simple moving averages (SMAs).
Should the recent uptick strengthen, the price could initially challenge 1.0874, which is the 38.2% Fibonacci retracement of the 1.0447-1.1138 upleg. Higher, the June peak of 1.0915 might come under scrutiny. Further advances could then stall around the 23.6% Fibo of 1.0975, a region that curbed the pair’s upside in March.
Alternatively, if the pair falls back below its SMAs, immediate support could be found at the 50.0% Fibo of 1.0793. Failing to halt there, the pair could descend towards the 61.8% Fibo of 1.0711. Even lower, the one-month bottom of 1.0666 may provide downside protection.
In brief, EURUSD has regained some lost ground in the past few sessions, while the break above its SMAs has further improved its short-term technical picture. Nevertheless, a break above its June high of 1.0915 is needed for the bulls to regain confidence for a full-scale reversal.
Gold Lacks Clear Direction in Short Term
- Gold slows pace after rebound off neckline
- RSI and stochastics look overstretched
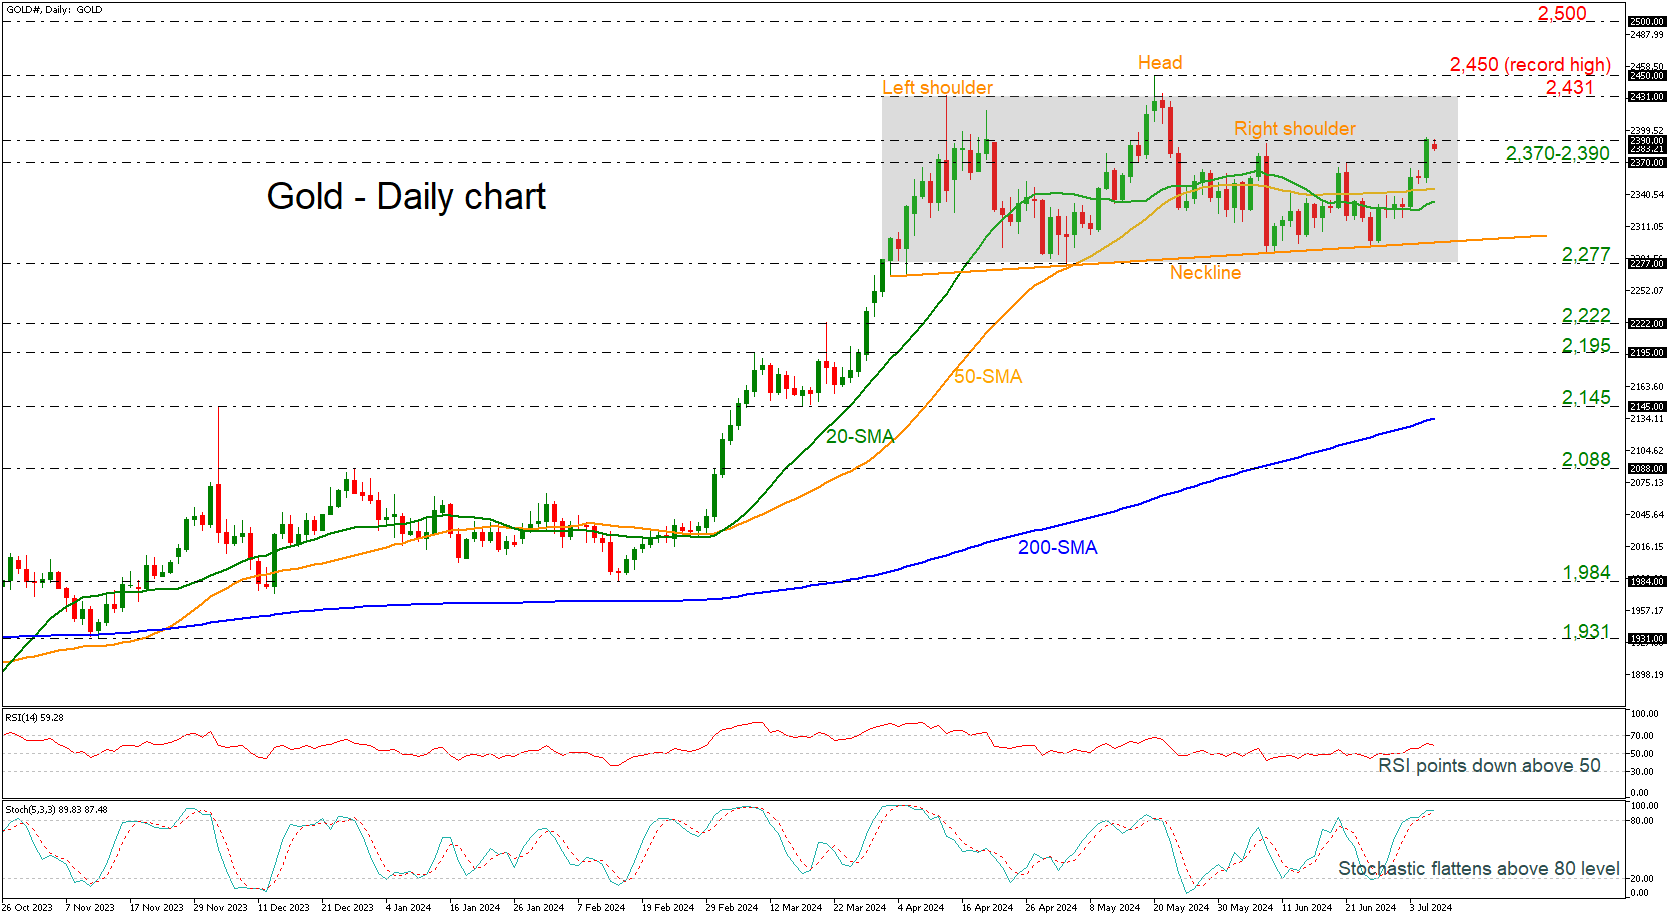
Gold prices jumped higher, meeting the restrictive region of 2,370–2,390, which is also acting as the right shoulder pattern in the short-term picture.
However, the technical oscillators and the current market price action suggest a downside reversal. The RSI is pointing downward above the neutral threshold of 50, whereas the stochastic is flattening in overbought territory.
Should prices reverse lower, immediate support could come from the 50- and 20-day simple moving averages (SMAs) at 2,346 and 2,334 respectively. A drop below this area would take the commodity towards the neckline around 2,300 before testing the lower boundary of the trading range at 2,277. A drop beneath these lines could significantly endorse the bearish outlook, hitting the 2,222 barrier.
On the other hand, a successful close above the previous high could find major resistance at the 2,431 mark, ahead of the record peak of 2,480. Even higher, the next round numbers, such as 2,500 and 2,600, could attract traders’ attention.
All in all, the precious metal has been developing in a sideways pattern in the near term, and only decisive moves above 2,450 or below 2,277 may change this view.
France Election Outcome Mixed Bag for Euro
Markets
The US payrolls added to recent evidence that the US labour market might be cooling. Headline June Job growth still printed at a solid 206k, but with a 111k downward revision for the previous two months. Wage growth (AHE) eased as expected (0.3% M/M and 3.9 % Y/Y from 4.1%). The jobless rate rose from 4.0% to 4.1%. The report didn’t signal a dramatic deterioration, but justifies the Fed turning to a more balanced approach when assessing the weight of the two pillars of its mandate: inflation vs maximal employment. The US yield curve bull steepened with yields easing between 10.2 bps (2-y) and 5.1 bps (30-y). The US 2-y yield dropped below the 4.70%/4.66% support area. Markets currently see the chance of a first Fed rate cut in September rising to about 80%. A second step in December is fully discounted. German yields in sympathy eased between 5.9 bps (5-y) and 3.6 bps (30-y). The dollar already was downwardly oriented going in to the payrolls releases and lost some (albeit modest) further ground afterwards (DXY close 104.87 from 105.16; EUR/USD 1.0840 from 108.12). Even the yen regained some ground (USD/JPY close at 160.75 compared to a peak of 161.95 mid last week). The prospect of/hope for a (Fed-supported) soft landing still supported US equities (S&P +0.54%, Nasdaq +0.90%, both closing at a new record).
This morning, the market focus is on the surprise outcome of the French Parliamentary elections. The left-wing Nouveau Front Populaire won most seats (178) with Macron’s centrist Alliance coming out second (expected 156 seats). The far-right Rassemblement National is seen obtaining 143 seats. With a majority of 289 seats necessary, none of the three blocks is close to be able to form a government with full powers. A collation government will be very difficult to make and a long period of political blockage might be on the cards. Far-left leaders Mélenchon already indicated that his party seeks a quick implementation of part of its big spending plans. In this context, there is little prospect that France’s fiscal deficits/debt will be addressed anytime soon. In the run-up to the election a political stalemate from a market point of view was seen as the ‘least worst’ option. Even so, the current outcome probably won’t help for France’s spreads to undo recent widening. The outcome is also mixed bag for the euro. EUR/USD this morning shows no clear trend. Some consolidation or even a slight EUR/USD setback might be on the cards. Further EUR/USD gains toward the 1.0916 June top will have to come from USD softness rather than a euro rebound. In this respect markets look out to Thursday’s US June CPI and Fed Powell testimony before Congress tomorrow and on Wednesday.
News & Views
Japanese base salaries rose by the most in more than 30 years, data from the Ministry of Health, Labour and Welfare showed this morning. Base pay (ex overtime) increased 2.5% y/y in May (from 1.8% in April). The number outpaces the 1.9% headline figure (total cash earnings) due to a sharp drop in bonus pay (-8.5%). The fast increases are result of the wage negotiations (shunto) earlier this year as Japan’s biggest union umbrella group secured a 5.1% pay increase. This is expected to continue to filter through in upcoming readings. The data are a sign for the Bank of Japan that a virtuous wage-price spiral is taking shape. Whether it’ll be enough for the central bank to hike again already at the July meeting is uncertain. Money markets are fifty-fifty divided on the matter (assuming a 10 bps hike). The Japanese yen barely budged on the release. USD/JPY trades a tad weaker in the 160.6 area.
The British Chambers of Commerce in its quarterly report (Q2) said that fewer firms expect to increase their prices in the next three months (39% vs 46% in Q1) amid inflation (headline, that is) easing to target in recent months. Of the ones that do, 67% said that labour costs force them to. That’s in line with the 68% in Q1. Overall business conditions (measured by sales and cashflow) improved with 38% reporting an uptick in domestic sales (+2 ppts). Business confidence has increased with 58% (vs 56%) expecting a turnover rise over the next 12 months. But despite the boost in both conditions and confidence, most firms say they haven’t ramped up investments. Only 25% reported an increase. The quarterly survey was taken between May 13th and June 10th, before the actual (but widely anticipated) outcome of the Labour landslide victory. SMEs make up about 91% of the surveyed.
Graphs
GE 10y yield
The ECB cut its key policy rates by 25 bps at the June policy meeting. A more bumpy inflation path in H2 2024, the EMU economy gradually regaining traction and the Fed’s higher for longer US strategy make follow-up moves difficult. Markets are coming to terms with that. Meanwhile, much of the save haven bids were reversed after the first round in the French elections. The 2.34%-2.4% support zone looks solid.
US 10y yield
The Fed needs more evidence than just one slower-than-expected (May) CPI provided. June dots suggest one move in 2024 and four next year. The long end of the curve was also supported by increased odds of a Trump presidency after the debate with Biden. At the same time, softer US labour market data are fuelling the debate on the September Fed rate cut, steepening the curve.
EUR/USD
EUR/USD is stuck in the 1.06-1.09 range. The desynchronized rate cut cycle with the ECB taking the lead and a swing to the right in European elections pulled the pair to the 1.0665 area. However, the dollar also lost some momentum as the Fed is turning its focus to a potential softening of the labour market, potentially opening the way for policy easing in September.
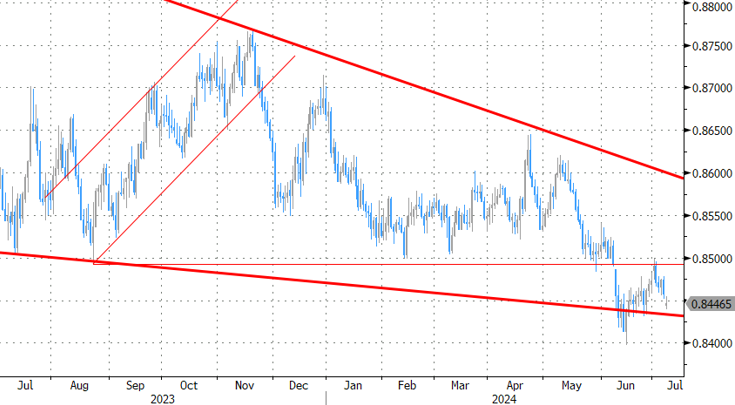
EUR/GBP
Debate at the BOE is focused at the timing of rate cuts. May headline inflation returned to 2%, but core measures weren’t in line with inflation sustainably returning to target any time soon. Still some BoE members at the June meeting appeared moving closer to a rate cut. This might cap further sterling gains. Labour has yet to reveal its policy plans after securing a landslide election victory. EUR/GBP 0.84 is solid support.