
Sample Category Title
GBP/JPY Daily Outlook
Daily Pivots: (S1) 205.21; (P) 205.83; (R1) 206.67; More...
Intraday bias in GBP/JPY remains on the upside for the moment. Firm break of 100% projection of 191.34 to 200.72 from 197.18 at 206.56 will target 138.2% projection at 210.17. On the downside, below 204.97 minor support will turn bias to the downside for deeper pull back.
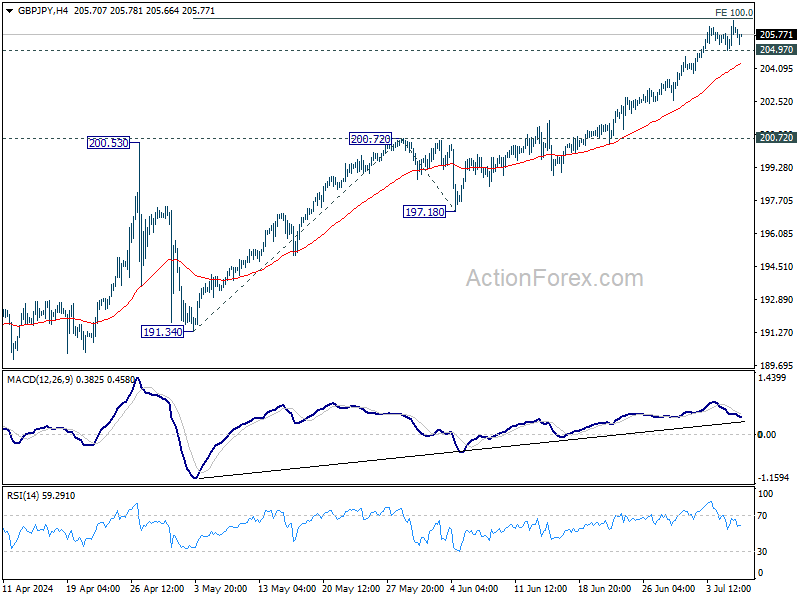
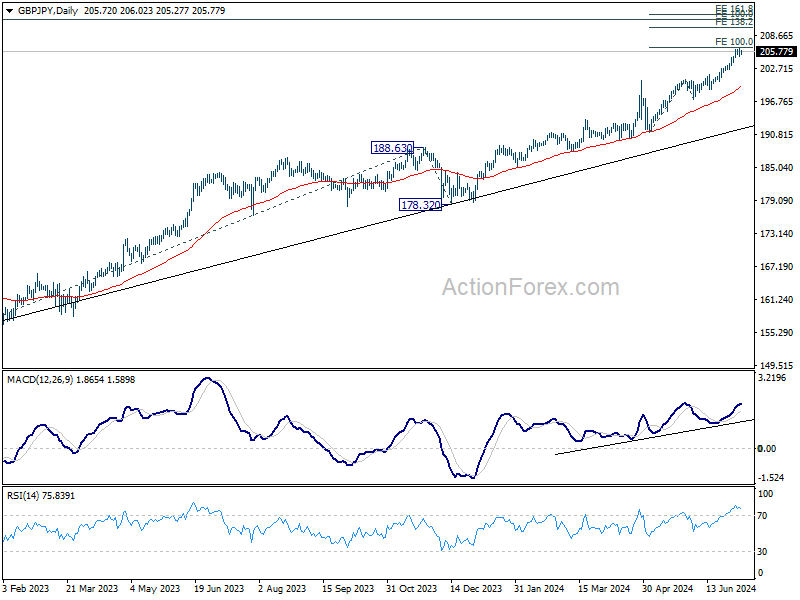
In the bigger picture, long term up trend is still in progress. Next target is 100% projection of 155.33 to 188.63 from 178.32 at 211.62. Outlook will stay bullish as long as 197.18 support holds, even in case of deep pullback.
French Election No Majority, No Spending Surge, But Continued Uncertainty
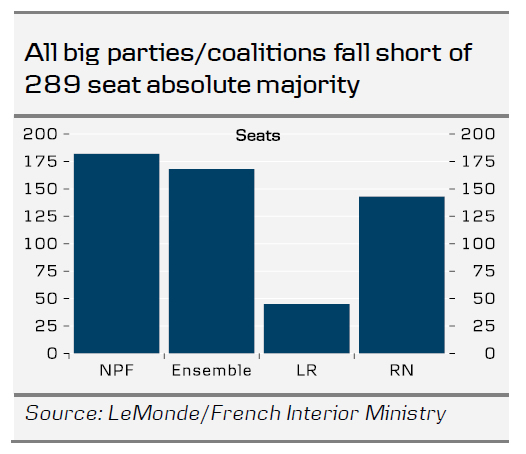
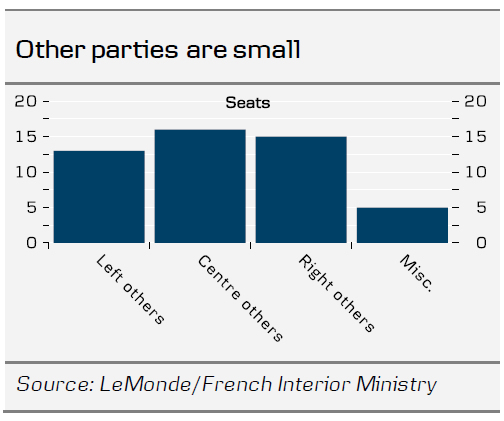
No party secured an absolute majority in the French National Assembly, leaving it highly fractured after the election. The left-wing New Popular Front (NPF) became the largest party, securing 182 seats. Macron's centrist "Ensemble" alliance finished second with 168 seats. The far-right National Rally (RN) has unexpectedly taken third place, garnering 143 seats. A party or coalition needs 289 seats for an absolute majority.
Uncertainty about what the new government will look like is high, and there is no obvious majority government to be formed. However, if a majority government is somehow formed, it likely must include Macron's centrist Ensemble alliance to get above the 289-seat threshold. We must now wait some days or weeks before we know more of what the new government will look like, and it could take even longer before an actual government is formed. In all scenarios the new government will be fragile, as it will consist of different parties with vastly different political views or be a minority government. There is also the risk that no government can be formed, and a technocratic government could be installed for the first time in French history. Uncertainty in French politics is set to persist even after a government is formed as there is a higher than usual risk of the government breaking given the fragmentated results of the election.
However, some uncertainty has been eliminated from markets by the results, as public spending in France is most likely not set to rise significantly since both the left-wing and far-right fell short of an absolute majority. A possible majority government in a coalition including Ensemble necessitates compromises and favours status quo given the different views on fiscal policies the parties in a broad coalition will have. The same would be true for a minority government. A technocratic government would likely neither be able to implement large changes, as it needs broad support. We thus expect the 10y yield spread between France and Germany will tighten to some 40-60 bp within 3 months.
In the coming days, a key question is whether the left-wing "New Popular Front" (NPF) coalition holds or breaks up. As the NPF fell short of an absolute majority, the most moderate parties (Socialists, Greens, and Communists) could potentially break with the far-left "France Unbowed" and form a government with Macron's centrist alliance. This would keep "France Unbowed" and their leader, Melancon out of power as he has refused to government with Macron's alliance, which is import for markets. However, even such a coalition would fall short of an absolute majority by around 10 seats. Importantly for markets is also, that it looks unlikely that Le Pen's far right National Rally will be part of a new government. Another possible scenario is thus a minority government, but it will be in constant thread of no-confidence votes. A minority government will be even weaker than Macron's Ensemble that had 250 seats in the outgoing National Assembly and even they struggled to pass new legislation. Hence, France is set for a prolonged period of political paralysis.
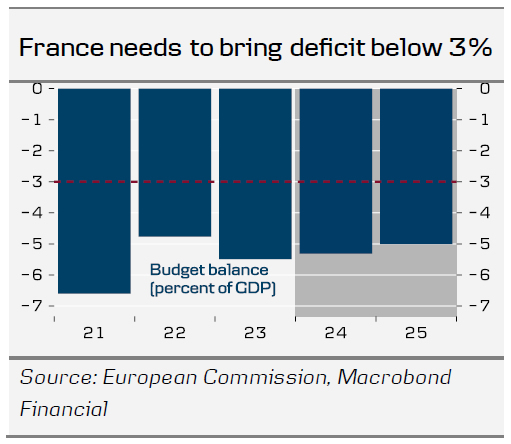
The new government will face pressures from the EU on public finances…
Given the weak public finances in France, the European Commission has officially proposed to open an excessive deficit procedure (EDP) against France together with six other EU countries. The EDP can ultimately result in fines to France of up to 0.05% of GDP to be paid every six months, up to cumulative fines of 0.5% of GDP (EUR 14bn in 2024). Currently it is premature to talk about fines as there is a long political process before it could be actual. The next step is that the new French government will submit budgets and reform proposals on how to correct the deficit in September. If a new government is not formed quickly, the Commission can grant France more time. Then, the Commission will decide whether to officially open an EDP against France. Given the fragmentation in the National Assembly and the fact that a new government will likely be fragile, we expect that it will be difficult for France to come up with structural reforms and spending cuts that can satisfy the commission. Hence, there is a significant chance of the Commission officially opening an EDP against France. Yet, it depends on the new government especially as a technocratic government might have a greater chance of making the unpopular decisions.
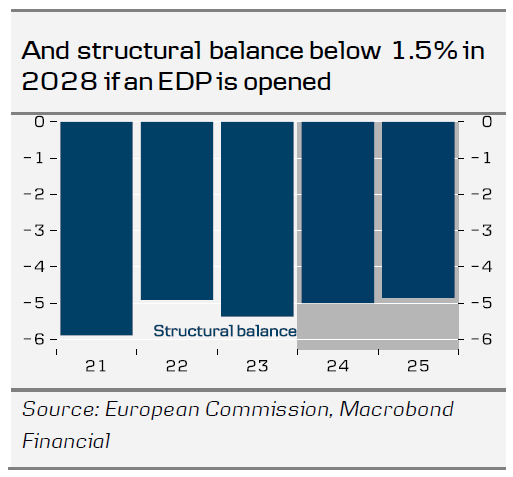
… that likely requires fiscal tightening of 0.50% per year.
If the Commission opens an excessive deficit procedure against France, we estimate that the new government will have to show an increase in the structural balance, of around 0.5 percentage points per year. This will be the case if France is granted the 7- year adjustment period while the four-year adjustment period would require an improvement of 0.9 percentage points per year. Given its size and power in the European Council France could most likely negotiate a seven-year adjustment period by committing to investments in EU priorities like the green transition and digitalisation. However, in either of the cases there is no room for much spending.
EUR/JPY Daily Outlook
Daily Pivots: (S1) 173.79; (P) 174.14; (R1) 174.57; More...
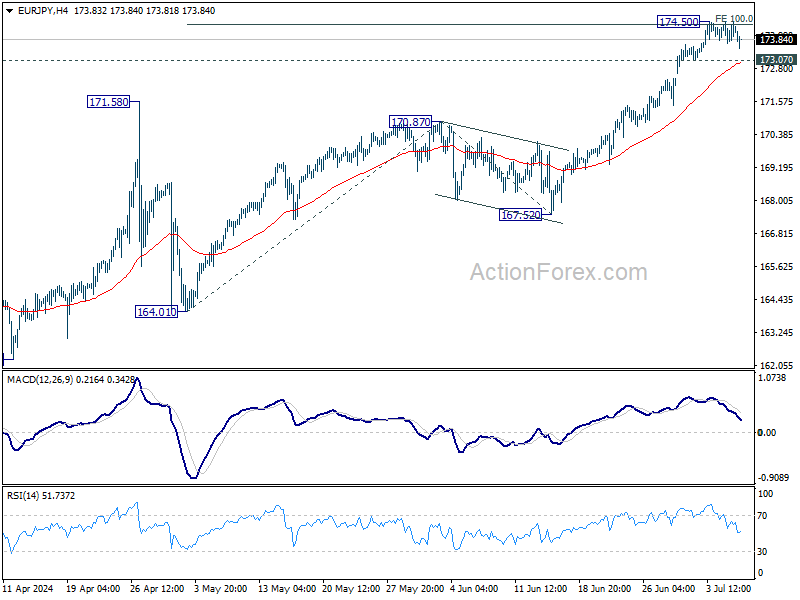
EUR/JPY dips mildly today but stays above 173.07 minor support. Intraday bias remains neutral for the moment. More sideway trading could be seen first. On the upside, firm break of 174.50 will resume the larger up trend and target 138.2% projection of 164.01 to 170.87 from 167.52 at 177.00. On the downside, however, break of 173.07 will turn bias to the downside for deeper pullback.
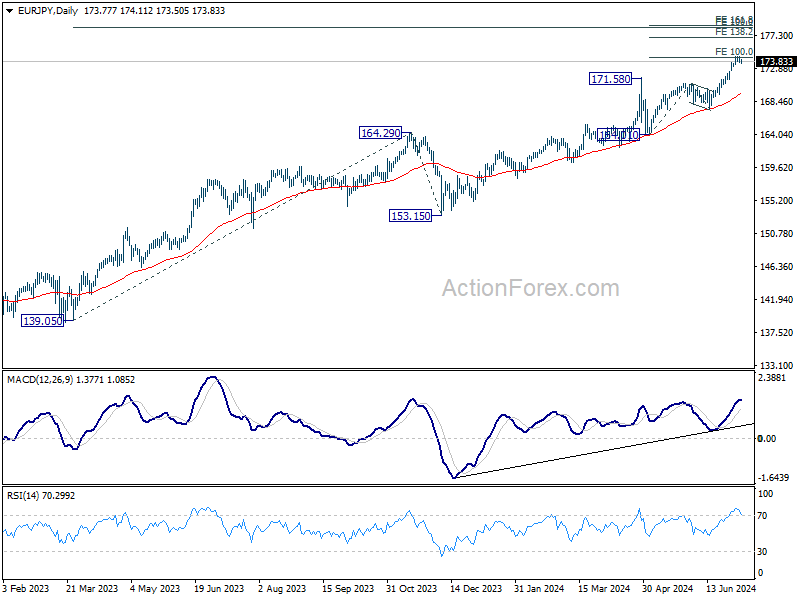
In the bigger picture, long term up trend is still in progress. Next target is 100% projection of 139.05 to 164.29 from 153.15 at 178.38. For now outlook will stay bullish as long as 170.7 resistance turned support holds, even in case of deep pullback.
Euro Edges Down Following Left-Wing Triumph in French Elections
Euro dips mildly a in Asian session after French parliamentary elections on Sunday delivered unexpected results. The markets had anticipated a challenging outcome for centrist President Emmanuel Macron, including a hung parliament. Yet, the outcome was particularly surprising for Marine Le Pen's National Rally. Despite being a frontrunner, her party only secured the third spot. The leftist New Popular Front alliance claimed the top position with over 180 seats. However, no party achieved the absolute majority of 289 seats required to govern alone.
For investors, the fact that a far-right government did not emerge in France is a relief. However, the resulting hung parliament means political gridlock is likely to continue. Macron's strategy of calling snap elections, following the European parliamentary results, did not deliver the desired outcome. His party remains in a precarious position, lacking the necessary support to advance significant legislative proposals, which adds to the political uncertainty in France.
As the political scene in France unfolds, market's attention will shift to the US this week. Fed Chair Jerome Powell's testimony is eagerly awaited, particularly for insights into Fed's readiness for monetary easing. Additionally, US CPI report due on Thursday is crucial. RBNZ rate decision is another highlight of the week while UK will also publish GDP data.
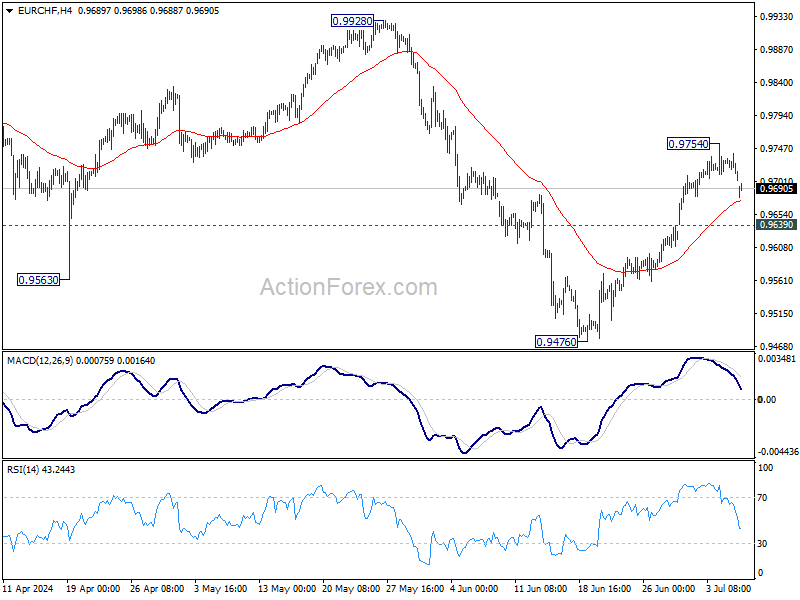
Technically, while EUR/CHF gaps lower as the week starts, selling momentum is limited so far. As long as 0.9639 minor support holds, rise from 0.9476 is still in favor to extend through 0.9754 at a later stage. However, firm break of 0.9639 will argue that the rebound is over, and bring retest of 0.9476 low.
In Asia, at the time of writing, Nikkei is up 0.16%. Hong Kong HSI is down -1.34%. China Shanghai SSE is down -0.53%. Singapore Strait Times is down -0.22%. Japan 10-year JGB yield is up 0.0163 at 1.086.
Japan's nominal wages rises 1.9% yoy, highest in 11months
Japan's nominal labor cash earnings increased by 1.9% yoy in May, up from April's 1.6% growth. Despite this being the 29th consecutive month of growth and the most substantial increase in 11 months, it fell short of the expected 2.1% yoy.
Regular pay saw a notable rise of 2.5% yoy, marking the best pace since January 1993, while overtime pay rebounded by 2.3% yoy, its first increase in six months.
However, these gains in nominal wages are overshadowed by the continued decline in real wages, which fell by -1.4% yoy, marking the 26th consecutive month of decline. This is also a deterioration from the -1.2% yoy drop recorded in April.
Fed Powell's testimony, US CPI, RBNZ Rate Hold, and UK GDP
This week's economic calendar, while not overloaded with events, includes several critical occurrences that could significantly influence financial markets across the spectrum, from stocks and bonds to currencies. Among these, the testimony of Fed Chair Jerome Powell and US CPI report are particularly noteworthy.
Powell's recent comments have indicated that inflation is back on a downward path. However, he emphasized the need for more consistent progress before Fed considers lowering interest rates. This stance will be under intense scrutiny, especially following last week's weak economic data, which pointed to notable cooling of the US economy. Investors are particularly interested in whether Powell believes Fed is ready to start lowering interest rates by September.
The June CPI data, set for release on Thursday, will further clarify the inflation outlook. Expectations are for the headline CPI to decrease from 3.3% to 3.1%, while core CPI is predicted to remain steady at 3.4%. Any upside surprises could prompt Fed officials to maintain their current cautious stance on policy easing. Additionally, PPI and the University of Michigan Consumer Sentiment Index will be key indicators to watch.
Also on the central bank front, RBNZ will announce its rate decision on Wednesday. The market widely expects the OCR to remain at 5.50%. Despite deepening economic slowdown in New Zealand, RBNZ is unlikely to adjust rates yet, as inflation remains high at 4% in Q1. The central bank's forecasts do not predict a reduction in the OCR until Q3 2025. There is prospect of RBNZ signaling an early cut, but only after next week's Q2 CPI release, not at this meeting.
In the UK, GDP data will be a highlight this week, especially following Labour's landslide victory in last week's general election. With the political scene now settled, BoE) is poised to deliver its first rate cut of the cycle next month. Markets are currently pricing in more than a 60% chance that BoE will move at its next meeting on August 1. The decision on whether there will be one or more rate cuts this year will hinge on the evolving economic conditions and inflation trends.
Here are some highlights for the week:
- Monday: Germany trade balance; Eurozone Sentix Investor confidence.
- Tuesday: Australia Westpac consumer sentiment, NAB business confidence; Japan machine tool orders.
- Wednesday: Japan PPI; China CPI, PPI; RBNZ rate decision; Italy industrial production.
- Thursday: Japan machine orders; Germany CPI final; UK GDP, production, trade balance; US CPI, jobless claims.
- Friday: New Zealand BNZ manufacturing; China trade balance; Canada building permits; US PPI, U of Michigan consumer sentiment.
EUR/JPY Daily Outlook
Daily Pivots: (S1) 173.79; (P) 174.14; (R1) 174.57; More...
EUR/JPY dips mildly today but stays above 173.07 minor support. Intraday bias remains neutral for the moment. More sideway trading could be seen first. On the upside, firm break of 174.50 will resume the larger up trend and target 138.2% projection of 164.01 to 170.87 from 167.52 at 177.00. On the downside, however, break of 173.07 will turn bias to the downside for deeper pullback.
In the bigger picture, long term up trend is still in progress. Next target is 100% projection of 139.05 to 164.29 from 153.15 at 178.38. For now outlook will stay bullish as long as 170.7 resistance turned support holds, even in case of deep pullback.
Economic Indicators Update
| GMT | Ccy | Events | Actual | Forecast | Previous | Revised |
|---|---|---|---|---|---|---|
| 23:30 | JPY | Labor Cash Earnings Y/Y May | 1.90% | 2.10% | 1.60% | |
| 23:50 | JPY | Bank Lending Y/Y Jun | 3.20% | 3.10% | 3.00% | |
| 23:50 | JPY | Current Account (JPY) May | 2.41T | 2.13T | 2.52T | |
| 05:00 | JPY | Eco Watchers Survey: Current Jun | 47.0 | 46.3 | 45.7 | |
| 06:00 | EUR | Germany Trade Balance (EUR) May | 19.9B | 22.1B | ||
| 08:30 | EUR | Eurozone Sentix Investor Confidence Jul | 0 | 0.3 |
EUR/USD Recovers and Bulls Are Not Done Yet
Key Highlights
- EUR/USD recovered above the 1.0800 resistance zone.
- A key bullish trend line is forming with support at 1.0790 on the 4-hour chart.
- GBP/USD climbed above the 1.2750 and 1.2800 resistance levels.
- Gold prices surged above the $2,380 resistance zone.
EUR/USD Technical Analysis
The Euro formed a base above the 1.0670 level against the US Dollar. EUR/USD started a decent increase above the 1.0750 resistance level.
Looking at the 4-hour chart, the pair was able to clear the 1.0780 resistance zone. There was a close above the 100 simple moving average (red, 4-hour) and the 200 simple moving average (green, 4-hour).
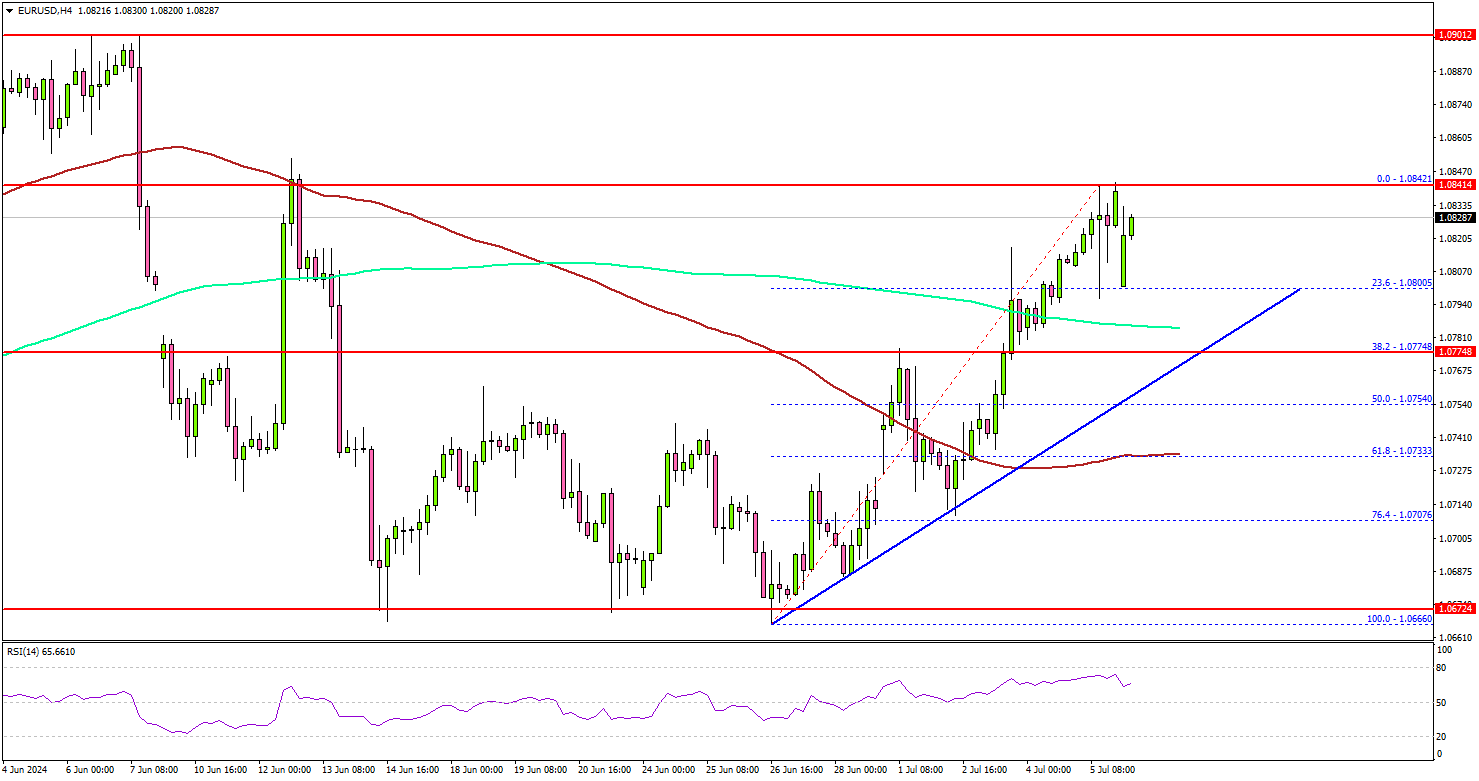
The pair even tested the 1.0840 zone and is currently consolidating gains. On the upside, EUR/USD might face resistance near the 1.0850 level. The next resistance sits at 1.0865.
The main hurdle sits at 1.0920. A clear move above the 1.0920 resistance might send it toward the 1.0980 level. Any more gains might open the doors for a test of the 1.1120 zone in the coming days.
Immediate support is near the 1.0810 level and the 23.6% Fib retracement level of the upward move from the 1.0660 swing low to the 1.0842 high. The next major support is near the 1.0790 level. There is also a key bullish trend line forming with support at 1.0790 on the same chart.
A downside break and close below the 1.0790 support zone could open the doors for more losses. In the stated case, the pair could decline toward the 1.0730 level and the 100 simple moving average (red, 4-hour).
Looking at Gold, the bulls seem to be in action, and they might soon aim for more upsides above the $2,400 resistance zone.
Economic Releases
- Euro Zone Sentix Investor Confidence for July 2024 - Forecast 0.2, versus 0.3 previous.
Japan’s nominal wages rises 1.9% yoy, highest in 11months
Japan's nominal labor cash earnings increased by 1.9% yoy in May, up from April's 1.6% growth. Despite this being the 29th consecutive month of growth and the most substantial increase in 11 months, it fell short of the expected 2.1% yoy.
Regular pay saw a notable rise of 2.5% yoy, marking the best pace since January 1993, while overtime pay rebounded by 2.3% yoy, its first increase in six months.
However, these gains in nominal wages are overshadowed by the continued decline in real wages, which fell by -1.4% yoy, marking the 26th consecutive month of decline. This is also a deterioration from the -1.2% yoy drop recorded in April.
GBPUSD Wave Analysis
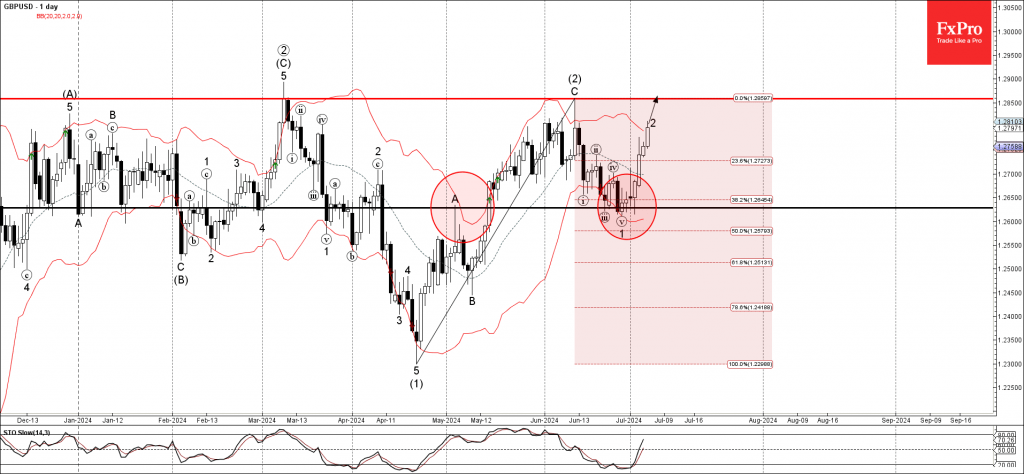
- GBPUSD rising inside wave 2
- Likely to rise to resistance level 1.2850
GBPUSD currency pair recently reversed up from the key support level 1.2630 (which also stopped the earlier impulse ii at the end of June).
The support level 1.2630 was strengthened by the lower daily Bollinger Band and by the 38.2% Fibonacci correction of the previous sharp ABC correction (2) from April.
Given the bearish USD sentiment seen today, GBPUSD currency pair can be expected to rise to the resistance level 1.2850 (which stopped the previous correction (2)).
USDCAD Wave Analysis
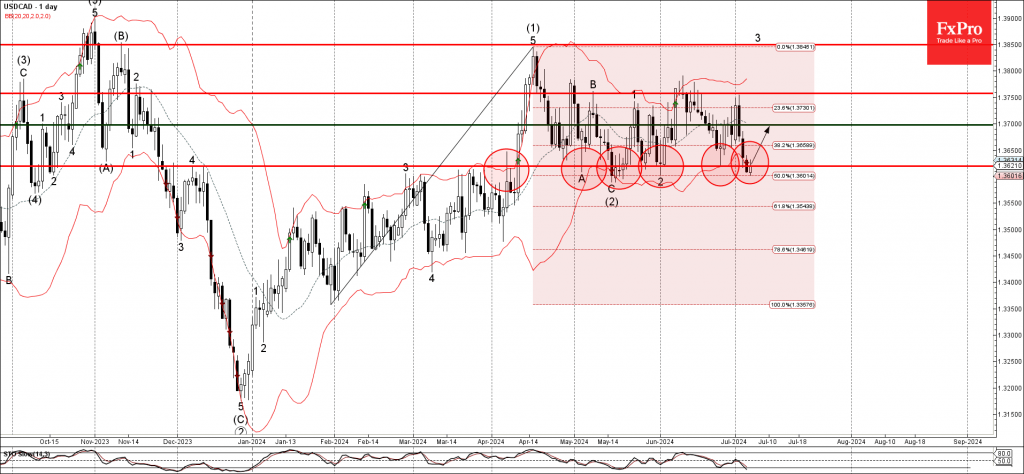
- USDCAD reversed from powerful support level 1.3620
- Likely to rise to resistance level 1.3700
USDCAD currency pair just reversed up from the powerful support level 1.3620 (which has been steadily reversing the pair from the start of May).
The support level 1.2630 was strengthened by the lower daily Bollinger Band and by the 50% Fibonacci correction of the previous sharp upward impulse from January.
Given the clear daily uptrend, USDCAD currency pair can be expected to rise to the resistance level 1.3700.
Forex and Cryptocurrency Forecast
EUR/USD: The US is Not Very Good, Europe is Not Very Bad
On Friday, June 5, the Dollar Index (DXY) hit a three-week low, while the euro showed its largest weekly gain against the dollar in a year. This was due to the US not performing as well as expected and Europe not faring as poorly.
Disappointing private sector employment statistics from ADP (150K versus the forecasted 163K and previous 157K) and an increase in repeated jobless claims (238K versus 234K) for the ninth consecutive week indicate a cooling labour market. The slowdown in business activity in the service sector, the fastest in four years, and the drop in the ISM Index from 53.8 to 48.8 points, below the threshold of 50.00, suggest that the US economy is not as smooth as the Federal Reserve (Fed) would like.
The FOMC's June meeting minutes mentioned that monetary policy should be ready to respond to economic issues, a sentiment echoed by Fed Chairman Jerome Powell. Consequently, this gloomy macroeconomic data increased the likelihood of a monetary expansion cycle and interest rate cuts in September from 63% to 73%. Derivatives are almost certain that there will be two 25 basis point (bp) cuts in 2024, lowering the rate from 5.50% to 5.00%. This caused US Treasury yields and the DXY to drop, while stock indices and EUR/USD rose. The S&P500 set its 33rd record this year, and EUR/USD reached a high of 1.0842 on July 5.
The euro was also bolstered by the situation in France. The left-wing "New People's Front" (NFP) and the government bloc "Together for the Republic" (Ensemble) joined forces to prevent the right-wing from gaining power, which might end successfully. If the right-wing "National Rally" (RN) does not gain an absolute majority in the new parliament after the second round of elections, there will be no confrontation with the EU or Frexit (analogy with British Brexit).
Polls indicate the right-wing will secure 190 to 250 out of 577 seats, while 289 are needed for an absolute majority. The second round of elections will be held on Sunday, July 7, which might cause gaps in euro pairs on Monday.
Last week, the euro was also supported by the European Central Bank, or rather, by the minutes of its June Governing Council meeting. On one hand, 25 out of 26 Council members voted for a 25 basis point rate cut. However, this decision was made with several caveats concerning still high wage growth rates and the persistence of inflation, which resists and does not want to drop to the target level of 2.0%.
Preliminary June data showed that the CPI decreased only by 0.1% from 2.6% to 2.5%, and the Core CPI remained at 2.9% (y/y), above the consensus forecast of 2.8%. ECB officials fear the CPI might rise due to geopolitical tensions, supply chain disruptions, raw material and energy price increases, and other factors. This almost rules out a rate cut at the ECB Governing Council meeting on July 18 and suggests only one act of monetary expansion in the second half of 2024.
Key US labour market data released at the end of the week on Friday, July 5, could change the dollar's position and the EUR/USD dynamics. According to the Bureau of Labour Statistics (BLS), non-farm payrolls (NFP) increased by 206K in June, lower than May's 218K but above the forecast of 190K. Other data showed the unemployment rate rose from 4.0% to 4.1%, and wage inflation dropped from 4.1% to 3.9% (y/y).
After the publication of this data, EUR/USD ended the week at 1.0839. However, this does not mean it will start the next week at this level. Traders are closely watching the French elections and the political situation related to the November US presidential elections. Biden's interview with ABC News at 00:00 GMT on Saturday, July 6, when markets are closed, could also impact dollar pairs.
As of the evening of July 5, analysts' forecasts for the near future are as follows: 55% predict the pair will rise, 45% foresee a fall. In technical analysis, all trend indicators and oscillators on D1 are in favour of the euro, although a quarter indicate the pair is overbought. The nearest support is in the 10790-10805 zone, followed by 1.0725, 1.0665-1.0680, 1.0600-1.0620, 1.0565, 1.0495-1.0515, 1.0450, and 1.0370. Resistance zones are at 1.0890-1.0915, 1.0945, 1.0980-1.1010, 1.1050, and 1.1100-1.1140.
Notable events in the upcoming week include Jerome Powell's testimony in the US Congress on July 9 and 10, updated CPI data for Germany and the US on Thursday, July 11, and US initial jobless claims. The week will end with Germany's retail sales data and the US Producer Price Index (PPI) and the University of Michigan Consumer Sentiment Index.
GBP/USD: The Pound Gained with the Labour Party
The pound sterling and British stocks rose after the opposition centre-left Labour Party secured a convincing victory in the parliamentary elections. The British currency achieved a weekly gain of 1% – the best in the last seven weeks.
According to Reuters, the Labour Party won 337 out of 650 seats, indicating a majority in the House of Commons. UK Prime Minister Rishi Sunak conceded defeat and congratulated his opponents on their victory. In turn, Labour Party leader and Prime Minister-elect Keir Starmer declared that from today "we are embarking on a mission of national renewal and starting to rebuild our country." Starmer will replace Sunak as Prime Minister, ending 14 years of Conservative rule.
The markets responded positively to the national election results. The pound became the only component of the DXY to strengthen (by 0.2%) this year. "Apart from the weakening of the dollar," commented Singapore's DBS Bank, "the markets warmly welcomed the victory of the opposition Labour Party. This will put an end to years of political and economic uncertainty under Conservative leadership following the Brexit referendum in 2016. Labour leader Keir Starmer, while he is alive, has ruled out the possibility of the UK joining three blocs – the EU, the single market, and the customs union. […] However, Labour may seek more favourable trade agreements by aligning with EU rules in specific sectors such as agriculture, food, and chemicals."
"As for monetary policy," continued DBS strategists, "the OIS market assesses a 62.4% probability of the Bank of England (BoE) cutting the rate by 25 basis points to 5.0% at the meeting on August 1." However, DBS believes this will not significantly harm the pound, provided that expectations for a Fed rate cut in September increase.
The final note of the five-day period saw the GBP/USD pair at 1.2814. Specialists from another Singaporean bank, UOB, believe the likelihood of the pound strengthening has increased. They note that a strong resistance level is in the area of last month's high of 1.2860. The median forecast for the near term is as follows: 35% of analysts expect further pound strengthening and pair growth, 50% foresee a decline, and the remaining 15% are neutral. As for technical analysis on D1, 100% of trend indicators are green. Among the oscillators, 90% are green, a third of which are in the overbought zone, and the remaining 10% are neutral grey. In case of further decline, the pair will find support levels and zones at 1.2735-1.2750, 1.2680, 1.2655, 1.2610-1.2625, 1.2540, 1.2445-1.2465, 1.2405, and 1.2300-1.2330. In case of growth, the pair will meet resistance at levels 1.2850-1.2860, followed by 1.2895, 1.2965-1.2995, 1.3040, and 1.3130-1.3140.
Among the events of the coming week, the publication of UK GDP data for May on Thursday, July 11, stands out. The next important event, as previously mentioned, will be the publication of a fresh inflation report in the United Kingdom on July 17.
USD/JPY: Back to 1986
The yen lost over 12% against the dollar this year due to the large interest rate differential between Japan and the US. It continued to lose ground in the first half of the past week, reaching a new 38-year high of 161.94 on Wednesday, July 3, but failed to break above 162.00 due to disappointing US statistics.
Until Friday, Japanese officials largely refrained from discussing possible interventions. According to several experts, they may fear the wrath of the United States following sharp remarks from American authorities regarding recent similar actions. However, on July 5, Finance Minister Shunichi Suzuki once again stated that the authorities would closely monitor the state of the stock and currency markets. A week earlier, he expressed that he was "deeply concerned about excessive and unilateral movements in the forex market" and hoped that "confidence in the Japanese currency remains."
OCBC Bank economists noted that "USD/JPY will follow US Treasury yields and the dollar. A reversal in USD and a Fed rate cut or a BoJ signal to normalize (rate hike or accelerated balance sheet reduction) is needed for a downward reversal, none of which seem to be happening." OCBC concluded that the path of least resistance for USD/JPY might still be upward unless there is intervention. "Intervention, at best, is a tool to slow the yen's depreciation, not to reverse the trend," they added.
The week ended with USD/JPY at 160.78. UOB Group analysts noted that the pair's upward momentum is starting to weaken, but only a break below 160.45 would indicate that the USD will not strengthen further. If the pair breaks above 162.00, the next level to watch is 163.00. OCBC economists see further targets for USD/JPY at 164.00 and 164.90, with support at 160.20, 158.10 (21 DMA), and 156.90 (50 DMA).
Many traders remain cautious, fearing another intervention by Japanese authorities. 65% of analysts expect another intervention and a southward movement of the pair, while the remaining 35% point north. Among trend indicators on D1, only 10% point south, with the rest looking north. Oscillator indicators are 25% red and 75% green.
No significant macroeconomic data is expected for Japan in the upcoming week.
CRYPTOCURRENCIES: Back to February 26
The last five days of June gave investors hope that the black streak was over. But alas! On the first day of July, the bulls' strength waned, and BTC/USD turned south again, easily breaking support around $60,000 and plummeting to a local bottom at $53,543, a level last seen on February 26.
A long time ago, in 1961, the 35th President of the United States, John Fitzgerald Kennedy, uttered a phrase that became famous: "Victory has a thousand fathers, but defeat is an orphan." So, the current victory of the bears over the bulls also has many "fathers," although not a thousand. Several factors influenced the decline of the crypto market.
Firstly, investor disappointment that bitcoin failed to reach a new all-time high (ATH) after the April halving. Due to the halving of their reward, BTC miners were forced to sell a significant amount of their coins to cover operational costs. It was reported that their reserves reached a 14-year low. Downward pressure was also exerted by the German government, which began selling a large amount of bitcoin (about 50,000 BTC) seized by the police from a pirate site in January.
Sales intensified sharply after the announcement on June 24 that creditor payments from the bankrupt crypto exchange Mount Gox (Mt.Gox) would start in early July. These assets had been blocked, and now 20,000 former clients are to receive a total of 162,100 BTC (about $9 billion). According to a K33 study, the anticipation of this event put significant pressure on digital asset prices. Traders assumed that most recipients would be inclined to sell their tokens, given that BTC's price had risen exponentially since 1994. Real panic ensued when test transactions were observed on wallets associated with Mt.Gox.
According to Quinn Thompson, CEO of the crypto hedge fund Lekker Capital, the market has largely accounted for the German government's actions and Mt.Gox creditor payments. Thus, this negative pressure is expected to gradually weaken, as noted by Fundstrat analyst Tom Lee.
Another disappointment was the anticipated launch of Ethereum exchange spot ETFs last week, which did not materialise. The US Securities and Exchange Commission (SEC) rejected the applicants' S-1 form submissions, requesting additional adjustments by July 8. Therefore, approval may occur closer to mid-month or later, if at all. As a result, investors withdrew a record $119 million over the past two weeks, the highest since August 2022, making Ethereum an outsider in the crypto market.
Overall, global cryptocurrency exchange-traded funds recorded a third consecutive week of outflows, losing a total of $1.2 billion in investments. Most of the losses came from US spot Bitcoin ETFs, with about half of the inflows coming from retail investors, who typically lack long-term planning and patience. Many whales also began to take profits due to the absence of positive signals. The stock market also played against digital assets. In the last two months, both the S&P500 and Nasdaq Composite consistently hit record highs, prompting some investors to shift their funds from cryptocurrencies to stocks.
Despite the current gloomy outlook, many experts remain cautiously optimistic about the future. MN Trading founder Michaël van de Poppe believes an upward reversal will occur with the upcoming listing of Ethereum ETFs. Another expert, Ali Martinez, noted that in previous years, when June ended in a downtrend, there was a sharp rise the following month: historically, bitcoin gained an average of 7.42%. However, he believes July may be more challenging than usual due to the shock from Germany's bitcoin sales and Mt.Gox creditor payments.
Santiment analysts observed that both bullish and bearish sentiments in X, Reddit, Telegram, 4Chan, and BitcoinTalk networks are waning, indicating traders' loss of interest in trading. "We interpret this as fear and apathy among the crowd – a potential bottom signal," Santiment noted. "At the same time, there is increased talk about holding cryptocurrencies, which could be a positive sign."
"Bears still control the situation, but bitcoin is heavily oversold," said analyst Willy Woo. He believes markets will correct the oversold condition, but at this stage, it does not indicate fundamental demand growth or guarantee a sustained bullish trend. Woo emphasized that a breakout of the resistance line on the daily bitcoin RSI chart will create a "technical but not fundamental recovery."
According to Blockware Intelligence experts, bitcoin needs to overcome the $65,000 level to develop a rebound. This level corresponds to the acquisition cost for short-term investors. Currently, the digital gold prices have dropped below the total cost of short-term holders for the first time since August 2023. "Last summer, under similar circumstances, the price remained in a sideways trend for another two months before breaking out again," added Blockware Intelligence specialists.
Pratik Kala, a DigitalX analyst, predicts consolidation and low volatility for the crypto market in July. He stated, "Bitcoin is looking for the next major catalyst to move up. It's not visible on the horizon yet, but things will change as the US elections approach." Quinn Thompson from Lekker Capital also believes that the current "overly bearish" sentiments will gradually shift. He sees the US presidential elections as a growth catalyst for the crypto market, along with increased liquidity from the Fed and the launch of spot ETH ETFs. Another reason for growth could be the increased profitability of mining. Thompson predicts bitcoin will reach $100,000 and Ethereum $7,000 by November.
Galaxy Digital founder Mike Novogratz shares Thompson's view, recently forecasting bitcoin will hit $100,000 by the end of 2024. Tom Lee of Fundstrat expects an even higher figure of $150,000.
As of writing this outlook on the evening of Friday, July 5, BTC/USD is trading at $56,400 and ETH/USD at $2,975. The total crypto market capitalization is $2.06 trillion ($2.24 trillion a week ago). The market lost about $625 billion over the last 30 days. The Crypto Fear and Greed Index dropped from 47 to 29 points in 7 days, moving from the Neutral zone to the Fear zone.